. 2015 Jul 1;1(4):406-419.
doi: 10.1016/j.jcmgh.2015.05.007.

Dysregulated intrahepatic CD4+ T-cell activation drives liver inflammation in ileitis-prone SAMP1/YitFc mice

Affiliations

Dysregulated intrahepatic CD4+ T-cell activation drives liver inflammation in ileitis-prone SAMP1/YitFc mice

Sara Omenetti et al. Cell Mol Gastroenterol Hepatol. .

Abstract

Background and aims: Liver inflammation is a common extraintestinal manifestation of inflammatory bowel disease (IBD); however, whether liver involvement is a consequence of a primary intestinal defect or results from alternative pathogenic processes remains unclear. Therefore, we sought to determine the potential pathogenic mechanism(s) of concomitant liver inflammation in an established murine model of IBD.

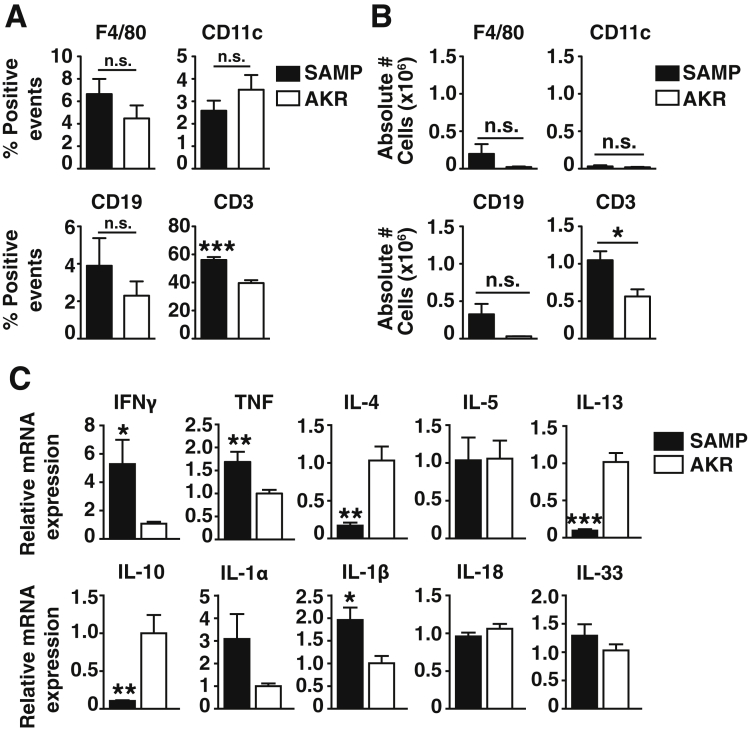
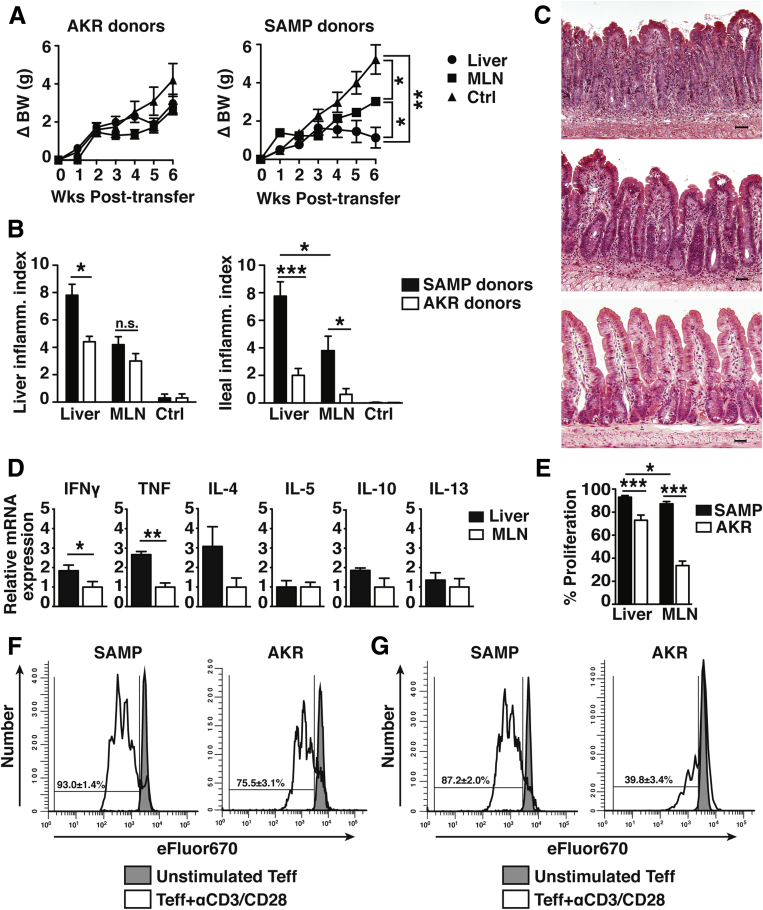
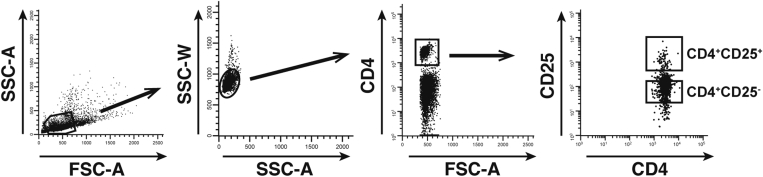
Methods: Liver inflammation and immune cell subsets were characterized in ileitis-prone SAMP1/YitFc (SAMP) and AKR/J (AKR) control mice, lymphocyte-depleted SAMP (SAMPxRag-1-/-), and immunodeficient SCID recipient mice receiving SAMP or AKR donor CD4+ T-cells. Proliferation and suppressive capacity of CD4+ T-effector (Teff) and T-regulatory (Treg) cells from gut-associated lymphoid tissue (GALT) and livers of SAMP and AKR mice were measured.

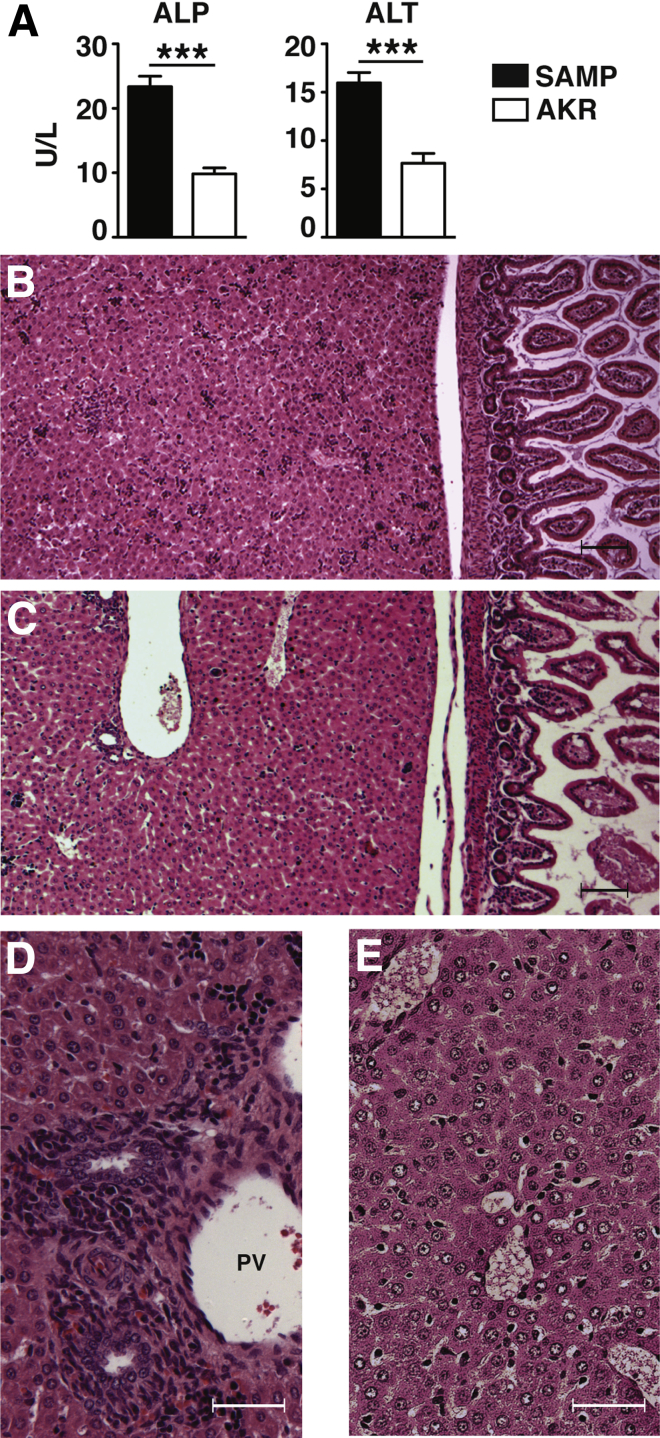
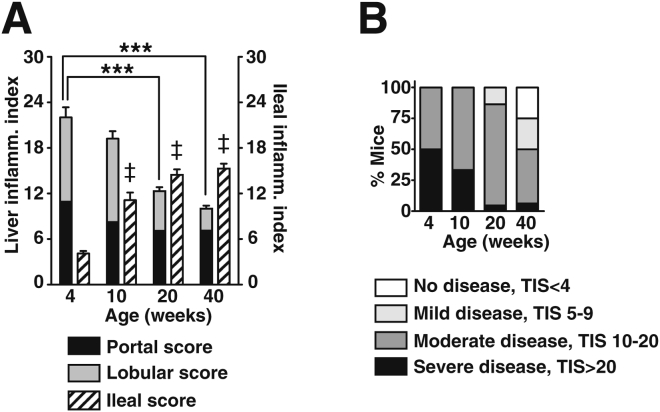
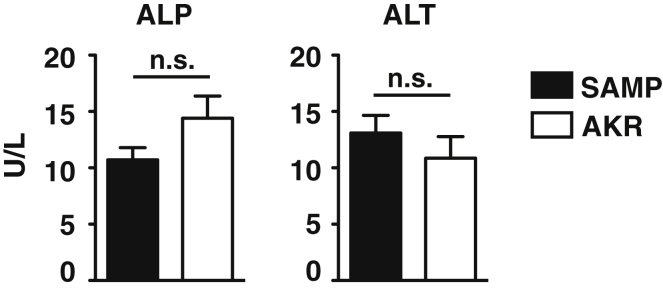
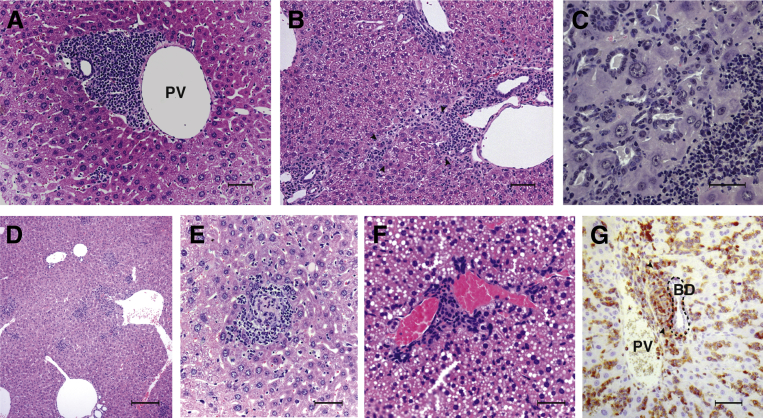
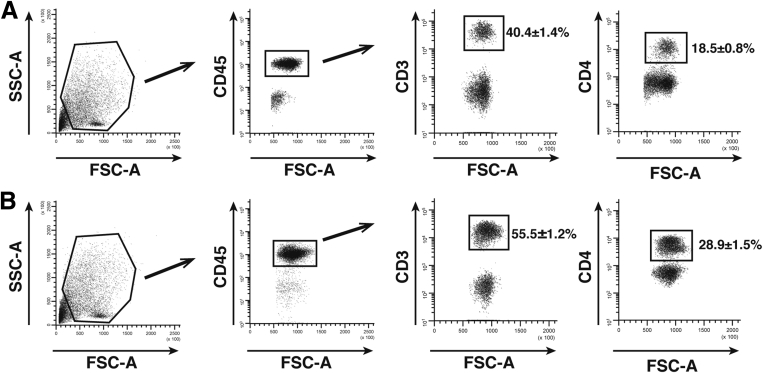
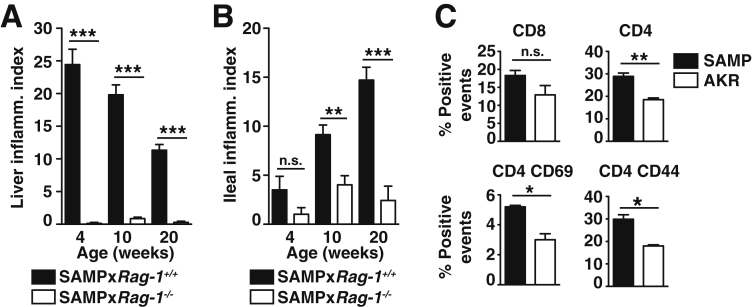
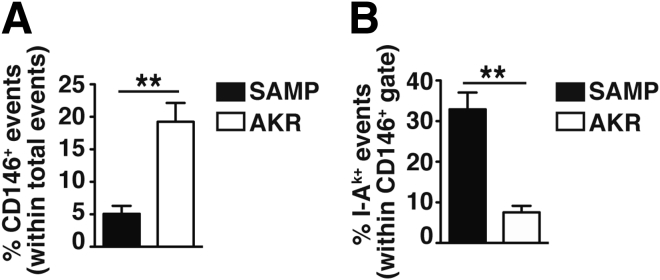
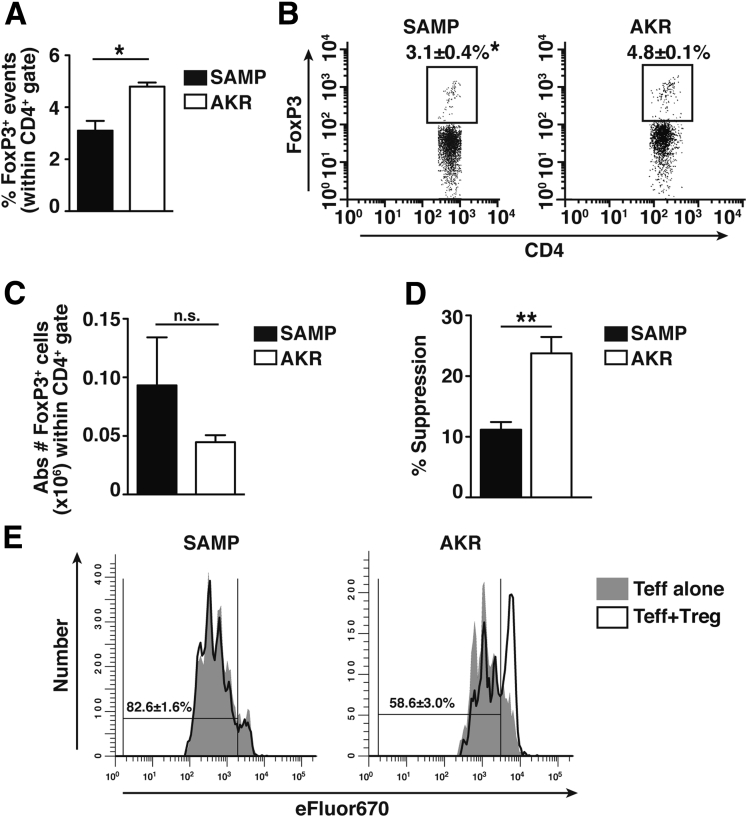
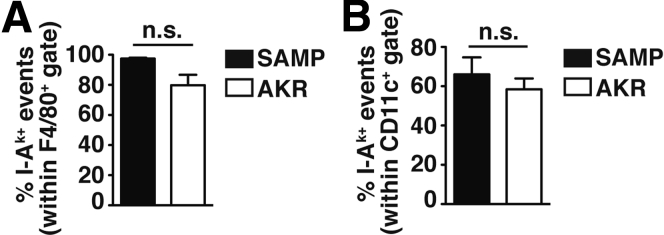
Results: Surprisingly, prominent inflammation was detected in 4-wk-old SAMP livers, prior to histologic evidence of ileitis, while both disease phenotypes were absent in age-matched AKRs. SAMP liver disease was characterized by abundant infiltration of lymphocytes, required for hepatic inflammation to occur, a Th1-skewed environment, and phenotypically-activated CD4+ T-cells. SAMP intrahepatic CD4+ T-cells also had the ability to induce liver and ileal inflammation when adoptively transferred into SCID recipients, whereas GALT-derived CD4+ T-cells produced milder ileitis, but not liver inflammation. Interestingly, SAMP intrahepatic CD4+ Teff cells showed increased proliferation compared to both SAMP GALT- and AKR liver-derived CD4+ Teff cells, while SAMP intrahepatic Tregs were decreased among CD4+ T-cells and impaired in in vitro suppressive function compared to AKR.

Conclusions: Activated intrahepatic CD4+ T-cells induce liver inflammation and contribute to experimental ileitis via locally-impaired hepatic immunosuppressive function.

Keywords: IBD-associated liver inflammation; SAMP1/YitFc mice; hepatic CD4+ T-cells; liver sinusoidal endothelial cells; regulatory T-cells.


Figures

Figure 1
Figure 1
Liver inflammation in young, ileitis-prone SAMP1/YitFc (SAMP). (A) Serum liver enzyme levels in 4-week-old mice (n = 12). Representative histologic photomicrographs of (B, D) inflamed neonatal (1-week-old) SAMP liver with enlarged portal tracts filled with dense inflammatory infiltrates surrounding bile ducts versus (C, E) age-matched AKR/J (AKR) with normal, noninflamed morphology. PV, portal vein. Bars: (B, C) 100 μm, (D, E) 20 μm; ***P < .001.
Figure 2
Figure 2
Liver inflammation in SAMP1/YitFc (SAMP) precedes ileitis and decreases over time. (A) Time-course of SAMP liver and ileal inflammation (n = 24). (B) Incidence and severity of liver disease (n = 24). TIS = total inflammatory score. ***P < .001, P < .01 versus 4-week-olds.
Figure 3
Figure 3
Circulating levels of alkaline phosphatase (ALP) and alanine aminotransferase (ALT) are comparable in SAMP1/YitFc (SAMP) versus AKR/J (AKR) mice at 20 weeks of age. Serum liver enzyme levels in 20-week-old mice as measured by enzyme-linked immunosorbent assay (n = 12). n.s., not statistically significant.
Figure 4
Figure 4
Histologic features of SAMP1/YitFc (SAMP) hepatic inflammation closely resemble liver disease observed in inflammatory bowel disease (IBD) patients. Main, pathologic features of SAMP liver include (A) infiltration of the portal-parenchymal interface with (B) occasional inflammatory bridging (arrows) between portal tracts, (C) ductular proliferation, and (D) hepatocyte anisokaryosis with inflammatory infiltration of liver lobules, often in the form of (E) granulomas. In a limited number of SAMP, (F) mild microvesicular steatosis occurs in association with sinusoidal inflammation. Importantly, (G) focal CD3+ T-cell infiltration (arrows) was observed in the bile duct epithelium. BD, bile duct; PV, portal vein. Bars: (A–C, E) 50 μm, (F, G) 20 μm, and (D) 100 μm.
Figure 5
Figure 5
Flow cytometric strategy for analysis of hematopoietic cells in SAMP1/YitFc (SAMP) and AKR/J (AKR) livers. Nonparenchymal liver cells (NPLC) were isolated from (A) AKR and (B) SAMP livers by enzymatic digestion and used for flow cytometric analysis without any additional enrichment. Figure shows sequential gating on nondebris cells by FSC-A and SSC-A, followed by exclusion of nonhematopoietic cells by CD45 positive expression. CD45+ hematopoietic cells were then investigated for additional markers. Representative plots for CD3 and CD4 expression in (A) AKR and (B) SAMP livers are shown.
Figure 6
Figure 6
SAMP1/YitFc (SAMP) liver is abundantly infiltrated with T lymphocytes that display a TH1-skewed cytokine profile. (A) Percentages and (B) absolute numbers (Abs #) of intrahepatic positive cells for F4/80, CD11c, CD19, and CD3 in total cell gate from young SAMP and AKR/J (AKR); one observation (n) represents pooled samples from two mice (n = 4). (C) Relative mRNA expression of hepatic TH1, TH2, and proinflammatory cytokines in nonparenchymal liver cells (NPLC) from 4-week-old mice (n = 8). *P < .05, **P < .01, ***P < .001 versus AKR. n.s., not statistically significant.
Figure 7
Figure 7
Lymphocytes are required to induce hepatic inflammation and display an activated phenotype in SAMP1/YitFc (SAMP) livers. Severity of (A) liver and (B) ileal inflammation in SAMPXRag-1−/− versus SAMPXRag-1+/+ mice (n = 7). (C) Percentages of intrahepatic positive cells for CD8 and CD4 within the total cell population, as well as CD69 and CD44 within the CD4 positive gate from 4-week-old SAMP and AKR/J (AKR) (n = 8); *P < .05, **P < .01, ***P < .001 versus AKR or SAMPxRag-1+/+. n.s., not statistically significant.
Figure 8
Figure 8
SAMP1/YitFc (SAMP) intrahepatic TH1 effector T cells (Teff) transfer both liver inflammation and ileitis. (A) Change in body weight (ΔBW), and (B) liver and ileal inflammation in recipient mice after adoptive transfer of donor CD4+ T cells; recipients receiving vehicle only served as controls (Ctrl) (n = 8). (C) Representative histologic photomicrographs displaying epithelial crypt hypertrophy and elongation, and villous blunting with dense inflammatory infiltrates throughout mucosa and submucosa in recipients of liver-derived donor cells (top), which were less severe in ilea adoptively transferred with mesenteric lymph node (MLN)-derived donor cells (middle) and Ctrl (lower). (D) TH1/TH2 cytokine mRNA expression in activated ex vivo cultured intrahepatic CD4+ T cells from recipients of donor SAMP liver versus MLN cells. (E) Percentages of Teff proliferation in liver and MLN of 10-week-old SAMP and AKR/J (AKR) mice. Percentages represent dividing cells in the presence of αCD3/CD28. Results are from four independent experiments (five mice pooled per experiment). (F, G) Representative histograms show proliferation of (F) liver- and (G) MLN-derived viable, CD4-gated cells in the absence (gray peaks) and presence (white peaks) of αCD3/CD28. Percentages represent dividing cells in the presence of αCD3/CD28. Bars: 50μm; *P < .05, **P < .01, ***P < .005 versus SCID receiving AKR donor cells, SAMP MLN-derived donor cells or AKR controls. n.s., not statistically significant.
Figure 9
Figure 9
In SAMP1/YitFc (SAMP) livers, α4β7+and CCR9+CD4+T cells do not accumulate. (A) Percentages and (B) absolute numbers (Abs #) of intrahepatic CD4+ T-cell subsets from 4-week-old SAMP and AKR/J (AKR). Isolated nonparenchymal liver cells (NPLC) were first gated on CD4 and successively on α4β7 and CCR9, distinguishing between overall positive cells and highly expressing cells; one observation (n) represents pooled samples from two mice (n = 5). (C) Total NPLC numbers (#) isolated by enzymatic digestion without any additional enrichment from 10-week-old SAMP and AKR livers (n = 8). (D) Protein concentrations of hepatic mucosal addressin cell adhesion molecule-1 (MAdCAM-1) and CC chemokine ligand 25 (CCL25) (n = 6). n.s. = not statistically significant.
Figure 10
Figure 10
Liver sinusoidal endothelial cells (LSEC) are decreased in SAMP1/YitFc (SAMP) livers but display greater expression of MHC class II compared with AKR/J (AKR) livers. (A) Percentages of intrahepatic positive cells for CD146+ (LSEC) in total cell gate, and for (B) IAk in CD146+ gate in inflamed young SAMP and AKR controls. One observation (n) represents pooled samples from two mice (n = 5).
Figure 11
Figure 11
In vitro suppressive function of regulatory T cells (Tregs) but not their absolute number is altered in SAMP1/YitFc (SAMP) versus AKR/J (AKR) livers. (A) Percentages of intrahepatic FoxP3+ cells calculated within CD4+ gate, with (B) representative plots (n = 3) in young SAMP and AKR. (C) Absolutes number (Abs #) of intrahepatic FoxP3+ cells isolated per mouse were calculated within CD4+ gate. (D) In vitro Treg suppression activity in livers of young SAMP and AKR mice. Percent suppression is expressed as the percentage of effector T cell (Teff) proliferation that was suppressed by coculture with Tregs. Results are from four independent experiments (15 mice pooled per experiment). (E) Representative histograms showing proliferation of viable, CD4-gated cells in the absence (gray peaks) and presence (white peaks) of hepatic Tregs. Percentages represent dividing cells in the presence of Tregs. *P < .05, **P < .001. n.s., not statistically significant.
Figure 12
Figure 12
FACS sorting strategy for isolation of CD4+CD25and CD4+CD25+cells. CD4+CD25 and CD4+CD25+ cells were isolated from SAMP1/YitFc (SAMP) and AKR/J (AKR) mice, using Percoll gradients for livers and CD4 magnetic beads for mesenteric lymph node cells (MLNs), followed by FACS. Figure shows sequential gating on lymphocytes by FSC-A and SSC-A, followed by exclusion of aggregates by SSC-W and SSC-A. Singlet lymphocytes were selected on CD4 positive fluorescence and then on CD25 positive regulatory T (Treg) or negative effector T (Teff) expression.
Figure 13
Figure 13
MHC class II expression is not increased in SAMP1/YitFc (SAMP) versus AKR/J (AKR) hepatic dendritic cells (DC) and Kupffer cells (KC). Percentages of intrahepatic positive cells for IAk within (A) F4/80+ gate (KC) and (B) CD11c+ gate (DC) in inflamed young SAMP and AKR controls. One observation (n) represents pooled samples from two mice (n = 5).

Similar articles

Cited by

References

    1. Navaneethan U., Shen B. Hepatopancreatobiliary manifestations and complications associated with inflammatory bowel disease. Inflamm Bowel Dis. 2010;16:1598–1619. - PubMed
    1. Adams D.H., Eksteen B., Curbishley S.M. Immunology of the gut and liver: a love/hate relationship. Gut. 2008;57:838–848. - PubMed
    1. Tufail S., Badrealam K.F., Sherwani A. Tissue specific heterogeneity in effector immune cell response. Front Immunol. 2013;4:254. - PMC - PubMed
    1. Grant A.J., Lalor P.F., Hubscher S.G. MAdCAM-1 expressed in chronic inflammatory liver disease supports mucosal lymphocyte adhesion to hepatic endothelium (MAdCAM-1 in chronic inflammatory liver disease) Hepatology. 2001;33:1065–1072. - PubMed
    1. Eksteen B., Grant A.J., Miles A. Hepatic endothelial CCL25 mediates the recruitment of CCR9+ gut-homing lymphocytes to the liver in primary sclerosing cholangitis. J Exp Med. 2004;200:1511–1517. - PMC - PubMed

LinkOut - more resources