

PEG Functionalization of Whispering Gallery Mode Optical Microresonator Biosensors to Minimize Non-Specific Adsorption during Targeted, Label-Free Sensing
- PMID: 26213937
- PMCID: PMC4570306
- DOI: 10.3390/s150818040
PEG Functionalization of Whispering Gallery Mode Optical Microresonator Biosensors to Minimize Non-Specific Adsorption during Targeted, Label-Free Sensing
Abstract
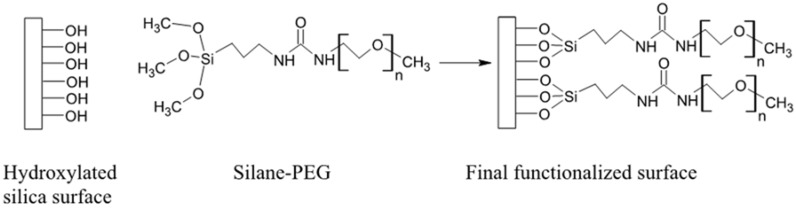
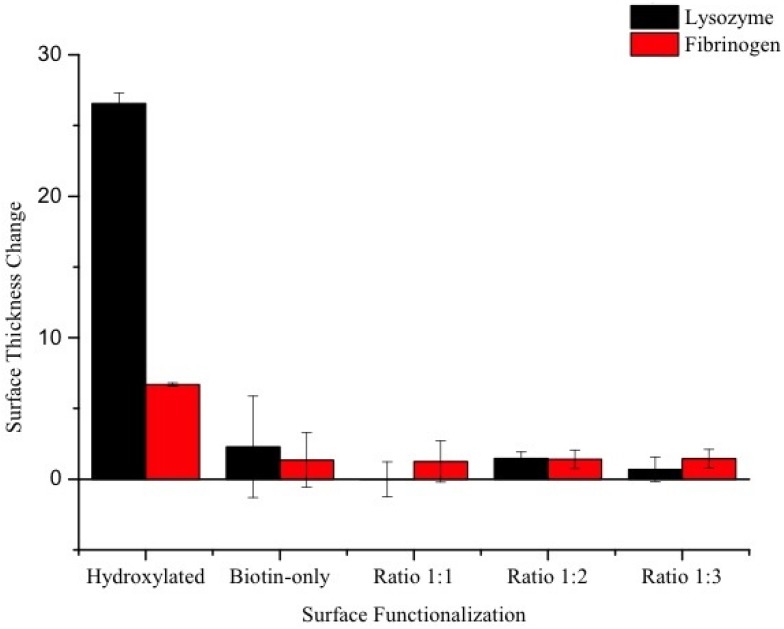
Whispering Gallery Mode (WGM) optical microresonator biosensors are a powerful tool for targeted detection of analytes at extremely low concentrations. However, in complex environments, non-specific adsorption can significantly reduce their signal to noise ratio, limiting their accuracy. To overcome this, poly(ethylene glycol) (PEG) can be employed in conjunction with appropriate recognition elements to create a nonfouling surface capable of detecting targeted analytes. This paper investigates a general route for the addition of nonfouling elements to WGM optical biosensors to reduce non-specific adsorption, while also retaining high sensitivity. We use the avidin-biotin analyte-recognition element system, in conjunction with PEG nonfouling elements, as a proof-of-concept, and explore the extent of non-specific adsorption of lysozyme and fibrinogen at multiple concentrations, as well as the ability to detect avidin in a concentration-dependent fashion. Ellipsometry, contact angle measurement, fluorescence microscopy, and optical resonator characterization methods were used to study non-specific adsorption, the quality of the functionalized surface, and the biosensor's performance. Using a recognition element ratio to nonfouling element ratio of 1:1, we showed that non-specific adsorption could be significantly reduced over the controls, and that high sensitivity could be maintained. Due to the frequent use of biotin-avidin-biotin sandwich complexes in functionalizing sensor surfaces with biotin-labeled recognition elements, this chemistry could provide a common basis for creating a non-fouling surface capable of targeted detection. This should improve the ability of WGM optical biosensors to operate in complex environments, extending their application towards real-world detection.
Keywords: PEG; non-specific adsorption; nonfouling surfaces; optical microresonator; surface characterization; surface functionalization.
Figures


Similar articles
-
Tailoring the protein adsorption properties of whispering gallery mode optical biosensors.Langmuir. 2012 Nov 6;28(44):15743-50. doi: 10.1021/la302041d. Epub 2012 Oct 23. Langmuir. 2012. PMID: 23061463
-
Attaching biological probes to silica optical biosensors using silane coupling agents.J Vis Exp. 2012 May 1;(63):e3866. doi: 10.3791/3866. J Vis Exp. 2012. PMID: 22588224 Free PMC article.
-
Optical sensors based on whispering gallery modes in fluorescent microbeads: response to specific interactions.Sensors (Basel). 2010;10(6):6257-74. doi: 10.3390/s100606257. Epub 2010 Jun 22. Sensors (Basel). 2010. PMID: 22219711 Free PMC article.
-
From Whispering Gallery Mode Resonators to Biochemical Sensors.ACS Sens. 2023 Jul 28;8(7):2440-2470. doi: 10.1021/acssensors.2c02876. Epub 2023 Jun 30. ACS Sens. 2023. PMID: 37390481 Review.
-
Biosensing by WGM Microspherical Resonators.Sensors (Basel). 2016 Jun 17;16(6):905. doi: 10.3390/s16060905. Sensors (Basel). 2016. PMID: 27322282 Free PMC article. Review.
Cited by
-
Integrating Nanostructured Artificial Receptors with Whispering Gallery Mode Optical Microresonators via Inorganic Molecular Imprinting Techniques.Biosensors (Basel). 2016 Jun 15;6(2):26. doi: 10.3390/bios6020026. Biosensors (Basel). 2016. PMID: 27314397 Free PMC article.
-
All-Solid-State Interdigitated Micro-Supercapacitors Based on Porous Gold Electrodes.Sensors (Basel). 2023 Jan 5;23(2):619. doi: 10.3390/s23020619. Sensors (Basel). 2023. PMID: 36679415 Free PMC article.
-
Bacteriostatic Poly Ethylene Glycol Plasma Coatings for Orthodontic Titanium Mini-Implants.Materials (Basel). 2022 Oct 25;15(21):7487. doi: 10.3390/ma15217487. Materials (Basel). 2022. PMID: 36363077 Free PMC article.
-
D-shaped plastic optical fibre aptasensor for fast thrombin detection in nanomolar range.Sci Rep. 2019 Dec 10;9(1):18740. doi: 10.1038/s41598-019-55248-x. Sci Rep. 2019. PMID: 31822733 Free PMC article.
-
A review of Optical Point-of-Care devices to Estimate the Technology Transfer of These Cutting-Edge Technologies.Biosensors (Basel). 2022 Nov 29;12(12):1091. doi: 10.3390/bios12121091. Biosensors (Basel). 2022. PMID: 36551058 Free PMC article. Review.
References
Publication types
MeSH terms
Substances
LinkOut - more resources
Full Text Sources
Other Literature Sources
