

Integration of multimodal neuroimaging methods: a rationale for clinical applications of simultaneous EEG-fMRI
- PMID: 26214023
- PMCID: PMC4520679
Integration of multimodal neuroimaging methods: a rationale for clinical applications of simultaneous EEG-fMRI
Abstract
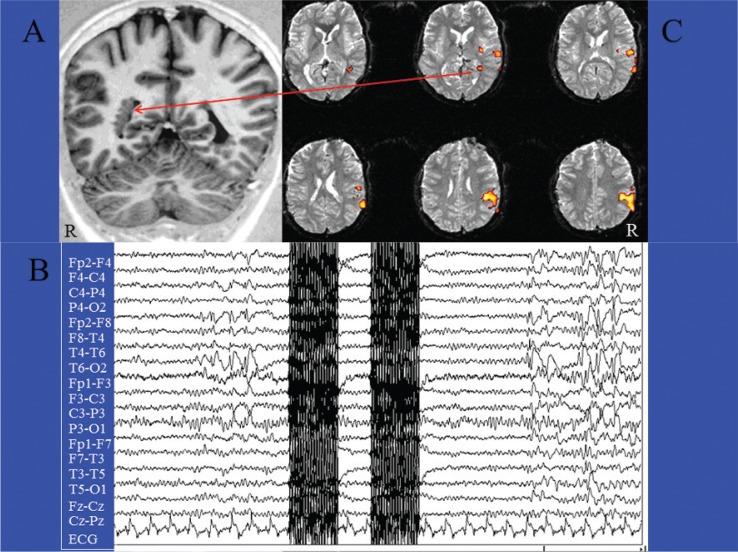
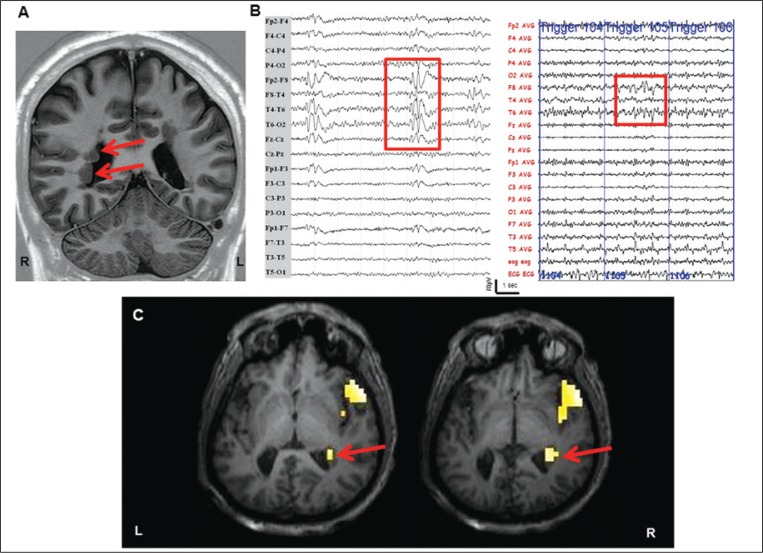
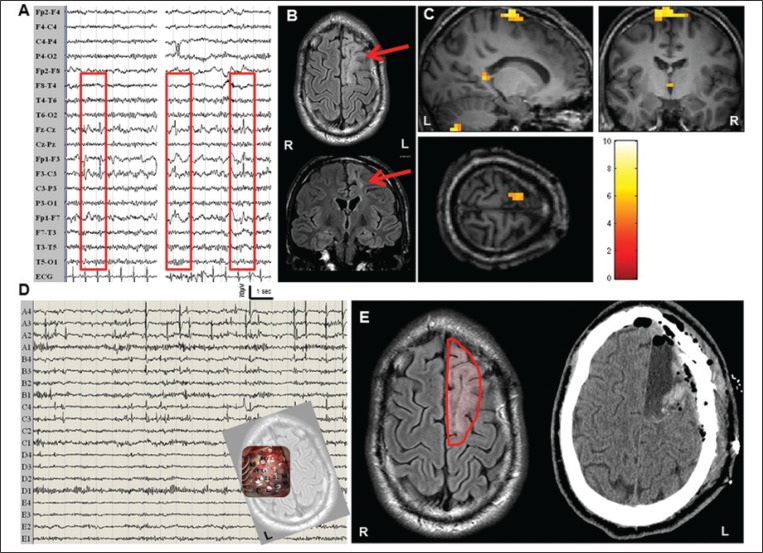
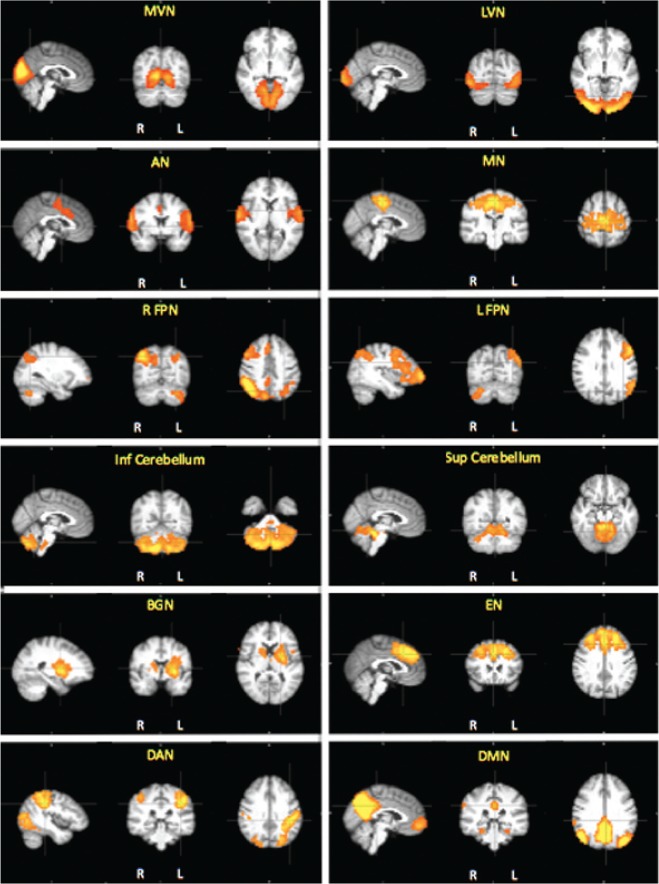
Functional magnetic resonance imaging (fMRI), which has high spatial resolution, is increasingly used to evaluate cerebral functions in neurological and psychiatric diseases. The main limitation of fMRI is that it detects neural activity indirectly, through the associated slow hemodynamic variations. Because neurovascular coupling can be regionally altered by pathological conditions or drugs, fMRI responses may not truly reflect neural activity. Electroencephalography (EEG) recordings, which directly detect neural activity with optimal temporal resolution, can now be obtained during fMRI data acquisition. Therefore, there is a growing interest in combining the techniques to obtain simultaneous EEG-fMRI recordings. The EEG-fMRI approach has several promising clinical applications. The first is the detection of cortical areas involved in interictal and ictal epileptic activity. Second, combining evoked potentials with fMRI could be an accurate way to study eloquent cortical areas for the planning of neurosurgery or rehabilitation, circumventing the above-mentioned limitation of fMRI. Finally, the use of this approach to evaluate the functional connectivity of resting-state networks would extend the applications of EEG-fMRI to uncooperative or unconscious patients. Integration of multimodal neuroimaging methods: a rationale for clinical applications of simultaneous EEG-fMRI.
Figures
Similar articles
-
Improved mapping of interictal epileptiform discharges with EEG-fMRI and voxel-wise functional connectivity analysis.Epilepsia. 2014 Sep;55(9):1380-8. doi: 10.1111/epi.12733. Epub 2014 Jul 24. Epilepsia. 2014. PMID: 25060924
-
Correspondence between large-scale ictal and interictal epileptic networks revealed by single photon emission computed tomography (SPECT) and electroencephalography (EEG)-functional magnetic resonance imaging (fMRI).Epilepsia. 2015 Mar;56(3):382-92. doi: 10.1111/epi.12910. Epub 2015 Jan 29. Epilepsia. 2015. PMID: 25631544
-
From EEG to BOLD: brain mapping and estimating transfer functions in simultaneous EEG-fMRI acquisitions.Neuroimage. 2010 May 1;50(4):1416-26. doi: 10.1016/j.neuroimage.2010.01.075. Epub 2010 Jan 29. Neuroimage. 2010. PMID: 20116435
-
Electrophysiological correlates of the BOLD signal for EEG-informed fMRI.Hum Brain Mapp. 2015 Jan;36(1):391-414. doi: 10.1002/hbm.22623. Epub 2014 Oct 3. Hum Brain Mapp. 2015. PMID: 25277370 Free PMC article. Review.
-
Single-trial EEG-fMRI reveals the dynamics of cognitive function.Trends Cogn Sci. 2006 Dec;10(12):558-63. doi: 10.1016/j.tics.2006.09.010. Epub 2006 Oct 30. Trends Cogn Sci. 2006. PMID: 17074530 Review.
Cited by
-
How do antidepressants influence the BOLD signal in the developing brain?Dev Cogn Neurosci. 2017 Jun;25:45-57. doi: 10.1016/j.dcn.2016.12.003. Epub 2016 Dec 21. Dev Cogn Neurosci. 2017. PMID: 28089656 Free PMC article. Review.
-
Possible Biological Mechanisms Linking Mental Health and Heat-A Contemplative Review.Int J Environ Res Public Health. 2018 Jul 18;15(7):1515. doi: 10.3390/ijerph15071515. Int J Environ Res Public Health. 2018. PMID: 30021956 Free PMC article. Review.
-
Combined EMD-sLORETA Analysis of EEG Data Collected during a Contour Integration Task.PLoS One. 2016 Dec 9;11(12):e0167957. doi: 10.1371/journal.pone.0167957. eCollection 2016. PLoS One. 2016. PMID: 27936219 Free PMC article.
-
EEG Microstate Analysis and the EEG Inverse Problem Solution as a Tool for Diagnosing Cognitive Dysfunctions in Individuals Who Have Had a Mild Form of COVID-19.Hum Physiol. 2022;48(5):587-597. doi: 10.1134/S0362119722600217. Epub 2022 Oct 13. Hum Physiol. 2022. PMID: 36258795 Free PMC article.
-
L-Dopa Modulation of Brain Connectivity in Parkinson's Disease Patients: A Pilot EEG-fMRI Study.Front Neurosci. 2019 Jun 14;13:611. doi: 10.3389/fnins.2019.00611. eCollection 2019. Front Neurosci. 2019. PMID: 31258465 Free PMC article.
References
-
- Allen PJ, Josephs O, Turner R. A method for removing imaging artifact from continuous EEG recorded during functional MRI. Neuroimage. 2000;12:230–239. - PubMed
-
- Allen PJ, Polizzi G, Krakow K, et al. Identification of EEG events in the MR scanner: the problem of pulse artifact and a method for its subtraction. Neuroimage. 1998;8:229–239. - PubMed
-
- Anwar MN, Bonzano L, Sebastiano DR, et al. Real-time artifact filtering in continuous VEPs/fMRI recording. J Neurosci Methods. 2009;184:213–223. - PubMed
-
- Beckmann CF, Smith SM. Tensorial extensions of independent component analysis for multisubject FMRI analysis. Neuroimage. 2005;25:294–311. - PubMed
Publication types
MeSH terms
Substances
LinkOut - more resources
Full Text Sources
Other Literature Sources
Medical