. 2015 Jan-Mar;30(1):33-46.

Impact of C24:0 on actin-microtubule interaction in human neuronal SK-N-BE cells: evaluation by FRET confocal spectral imaging microscopy after dual staining with rhodamine-phalloidin and tubulin tracker green

Impact of C24:0 on actin-microtubule interaction in human neuronal SK-N-BE cells: evaluation by FRET confocal spectral imaging microscopy after dual staining with rhodamine-phalloidin and tubulin tracker green

Amira Zarrouk et al. Funct Neurol. 2015 Jan-Mar.

Abstract

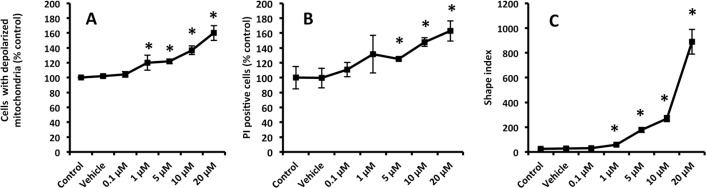
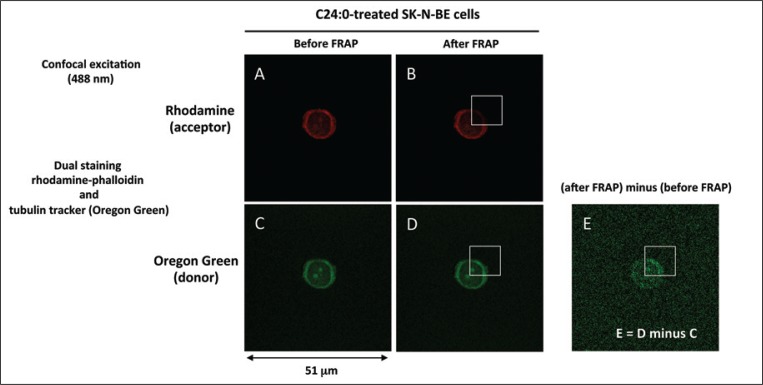
Disorganization of the cytoskeleton of neurons has major consequences on the transport of neurotransmitters via the microtubule network. The interaction of cytoskeleton proteins (actin and tubulin) was studied in neuronal SK-N-BE cells treated with tetracosanoic acid (C24:0), which is cytotoxic and increased in Alzheimer's disease patients. When SK-N-BE cells were treated with C24:0, mitochondrial dysfunctions and a non-apoptotic mode of cell death were observed. Fluorescence microscopy revealed shrunken cells with perinuclear condensation of actin and tubulin. Impact of C24:0 on actin-microtubule interaction in human neuronal SK-N-BE cells: evaluation by FRET confocal spectral imaging microscopy after dual staining with rhodamine-phalloidin and tubulin tracker green After staining with rhodamine-phalloidin and with an antibody raised against α-/β-tubulin, modifications of F-actin and α-/β-tubulin levels were detected by flow cytometry. Lower levels of α-tubulin were found by Western blotting. In C24:0-treated cells, spectral analysis and fluorescence recovery after photobleaching (FRAP) measured by confocal microscopy proved the existence of fluorescence resonance energy transfer (FRET) when actin and tubulin were stained with tubulin tracker and rhodamine-phalloidin demonstrating actin and tubulin co-localization/interaction. In control cells, no FRET was observed. Our data demonstrate quantitative changes in actin and tubulin, and modified interactions between actin and tubulin in SK-N-BE cells treated with C24:0. They also show that FRET confocal imaging microscopy is an interesting method for specifying the impact of cytotoxic compounds on cytoskeleton proteins.


Figures

Figure 1
Figure 1
Flow cytometric and microscopic analysis of C24:0-induced cell death. Flow cytometry and phase contrast microscopy were used to characterize the effects of C24:0 (0.1, 1, 5, 10 and 20 μM; 48 h) on SK-N-BE cells. The ability of C24:0 to induce cell death was evaluated by various criteria: (A) measurement of the transmembrane mitochondrial potential (Δψm) with DiOC6(3) allowing quantification of cells with depolarized mitochondria. [In control and vehicle-treated cells, the percentage of cells with depolarized mitochondria (DiOC6(3)-negative cells) was in the same range (5–10%)]; (B) quantification of dead cells after staining with propidium iodide (PI). [In control and vehicle-treated cells, the percentage of PI-positive cells was in the same range (5–10%)]; (C) quantification of the presence of round cells determined according to the shape index (number of round cells/total number of cells/mm2). Significance of the difference between control and treated cells is indicated by * (Mann-Whitney test; * p<0.05). Significance of the difference between vehicle- and C24:0-treated cells is indicated by # (Mann-Whitney test; # p<0.05). No significant difference was observed between control and vehicle-treated cells.
Figure 2
Figure 2
Morphological characteristics of human neuronal cells (SK-N-BE) treated with C24:0; analysis by transmission electron microscopy and fluorescence microscopy. Transmission electron microscopy (TEM) and conventional fluorescence microscopy of SK-N-BE cells cultured for 48 h in the absence (control cells) (A, D, G) or presence of acyclodextrin (1 mg/mL) (vehicle) (B, E, H), or C24:0 (10 μM) (C, F, I). The insets in figures D, E and F correspond to figures A, B, C, respectively. Some mitochondrial modifications were observed in C24:0-treated SK-N-BE cells (F), in comparison with control (D) and vehicle-treated cells (E): higher numbers of mitochondria, often larger in size, were found (m: mitochondria). TEM and fluorescence microscopy revealed no differences between control and vehicle-treated cells (G, H, I); no signs of apoptosis (cells with perinuclear chromatin, with condensed and/or fragmented nuclei) were detected.
Figure 3
Figure 3
Evaluation of actin and microtubule network organization by conventional fluorescence microscopy. SK-N-BE cells were cultured for 48 h in the absence (control cells) or presence of vehicle (a-cyclodextrin: 1 mg/mL), or C24:0 (5, 10 μM). Actin-F was revealed with rhodamine-phalloidin staining, and microtubules were detected by indirect immunofluorescence with a rabbit polyclonal antibody raised against α- and β-tubulin subunits and a 488-Alexa fluor goat anti-rabbit antibody. The nuclei were counterstained with Hoechst 33342 (1 μg/mL). No differences were revealed between control and vehicle-treated cells whereas perinuclear condensation of actin-F and α-/β-tubulin was observed in several C24:0-treated cells. The sizes of the cells and of the nuclei were also smaller under treatment with C24:0.
Figure 4
Figure 4
Flow cytometric and biochemical quantification of actin and tubulin. SK-N-BE cells were cultured for 48 h in the absence (control cells) or presence of acyclodextrin, 1 mg/mL (vehicle), or C24:0 (5, 10 μM). Flow cytometric quantification of actin and tubulin was performed after cell detachment by trypsinization. Actin-F was revealed with rhodamine-phalloidin (A); tubulin was revealed with a rabbit polyclonal antibody raised against α- and β-tubulin subunits (α-/β-tubulin) and a 488-Alexa fluor goat anti-rabbit antibody (B). In addition, the α-tubulin/β-actin ratio was determined by Western blotting (C). Data shown are mean ± SD from three independent experiments. Significance of the difference between control and treated cells is indicated by * (Mann-Whitney test; * p<0.05). Significance of the difference between vehicle and C24:0-treated cells is indicated by # (Mann-Whitney test; # p<0.05). No significant difference was observed between control and vehicle-treated cells, therefore, data are expressed as % of control.
Figure 5
Figure 5
Confocal images of control (untreated) and C24:0-treated SK-N-BE cells: single staining. Samples were stained with rhodamine-phalloidin (rhodamine: excitation 543 nm / emission 554–605 nm) (A) or tubulin tracker (Oregon Green: excitation 488 nm / emission 554–605 nm) (B), which react with actin-F or α- and β-tubulin subunits (major components of microtubules), respectively.
Figure 6
Figure 6
Confocal images of control (untreated), α-cyclodextrin (vehicle)- and C24:0-treated SK-N-BE cells: dual staining. Samples were dual stained with tubulin tracker (Oregon Green: excitation 543 nm/emission 554–605 nm) and rhodamine-phalloidin (rhodamine: excitation 488 nm/emission 554–605 nm) to reveal possible co-localizations of actin or microtubules (made up of α- and β-tubulin subunits) shown by the emission of an orange fluorescence under 488 nm light. Oregon Green (emission of a green fluorescence under 488 nm light) together with rhodamine (emission of an orange fluorescence under 543 nm light) makes it possible to have FRET in some localizations, Oregon Green being the donor and rhodamine being the acceptor. When cells were not treated (control) or were α-cyclodextrin (vehicle)-treated, microtubules and actin were properly excited at 488 nm and 543 nm, respectively. No orange fluorescence (554–605 nm) was observed when the cells were excited at 488 nm. However, when the cells were C24:0-treated, microtubules and actin were excited by means of the 488 nm light only: fluorescence emission was observed both at 500–550 nm and 554–605 nm.
Figure 7
Figure 7
FRET revealed by spectral image analysis (FAMIS). Image analysis (FAMIS) provided charts (A) from spectral sequences obtained by means of 488 nm and 543 nm excitations, respectively. FAMIS processing provided factor curves and factor images from spectral sequences obtained by means of the 488 nm excitation only in superimposed images; (B) control (untreated SK-N-BE cells); (C) C24:0-treated SK-N-BE cells in which peaks of emission of green and orange factor images were 525 nm and 565 nm, respectively. No FRET was observed in control cells (B) in which the first factor image was green; FRET was only observed in C24:0-treated cells (C) in which the first factor image was green and the second factor image was orange.
Figure 8
Figure 8
Fluorescence resonance energy transfer (FRET) revealed by fluorescence recovery after photobleaching (FRAP). When FRAP was performed under FRET conditions in a region of interest (B inside white square) in C24:0-treated cells, which were simultaneously stained with rhodamine-phalloidin (A) and tubulin tracker (Oregon Green) (C), the fluorescence of the donor (Oregon Green) increased (D) when the acceptor (rhodamine) (B) was photobleached. FRET efficiency is demonstrated in (E) via FRAP (Bertolin et al., 2013): after FRAP, the fluorescence of the donor inside the white square (D) was higher than before FRAP (C).

Similar articles

Cited by

References

    1. Antonenkov VD, Grunau S, Ohlmeier S, et al. Peroxisomes are oxidative organelles. Antioxid Redox Signal. 2010;13:525–537. - PubMed
    1. Baarine M, Ragot K, Athias A, et al. Incidence of Abcd1 level on the induction of cell death and organelle dysfunctions triggered by very long chain fatty acids and TNF-α on oligodendrocytes and astrocytes. Neurotoxicology. 2012;33:212–228. - PubMed
    1. Bamburg JR, Bloom GS. Cytoskeletal pathologies of Alzheimer disease. Cell Motil Cytoskeleton. 2009;66:635–649. - PMC - PubMed
    1. Belloc JF, Vincendeau P, Freyburger G, et al. Flow cytometric study of the activation of polymorphonuclear cells. J Leukoc Biol. 1990;48:353–358. - PubMed
    1. Benzecri JP. L’analyse des données, Tome 2: L’analyse des correspondances. Paris: Dunod; 1973.

Publication types

LinkOut - more resources