

Association between SLC30A8 rs13266634 Polymorphism and Type 2 Diabetes Risk: A Meta-Analysis
- PMID: 26214053
- PMCID: PMC4527121
- DOI: 10.12659/MSM.894052
Association between SLC30A8 rs13266634 Polymorphism and Type 2 Diabetes Risk: A Meta-Analysis
Abstract
Background: Accumulating but inconsistent data about the role of rs13266634 variant of SLC30A8 in type 2 diabetes have been reported, partly due to small sample sizes and non-identical ethnicity.
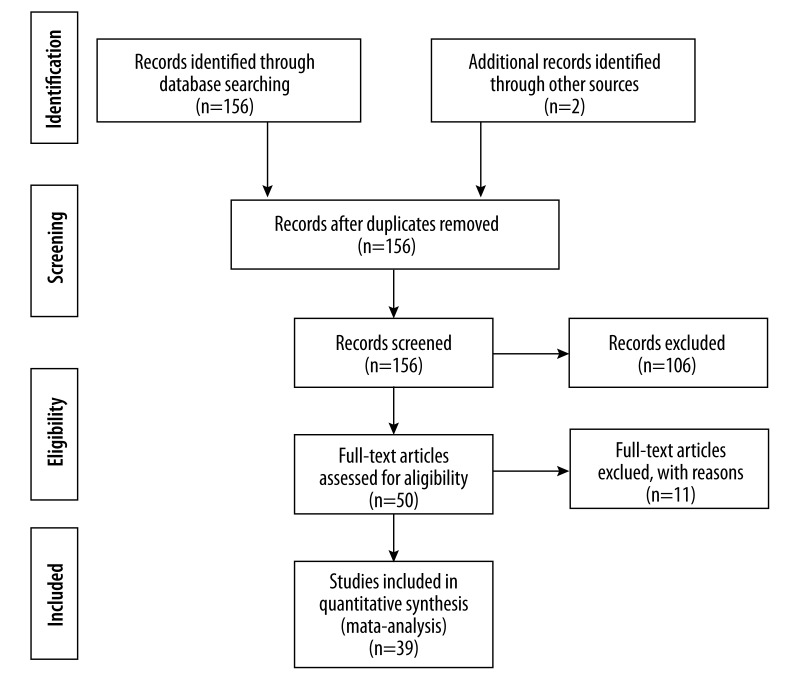
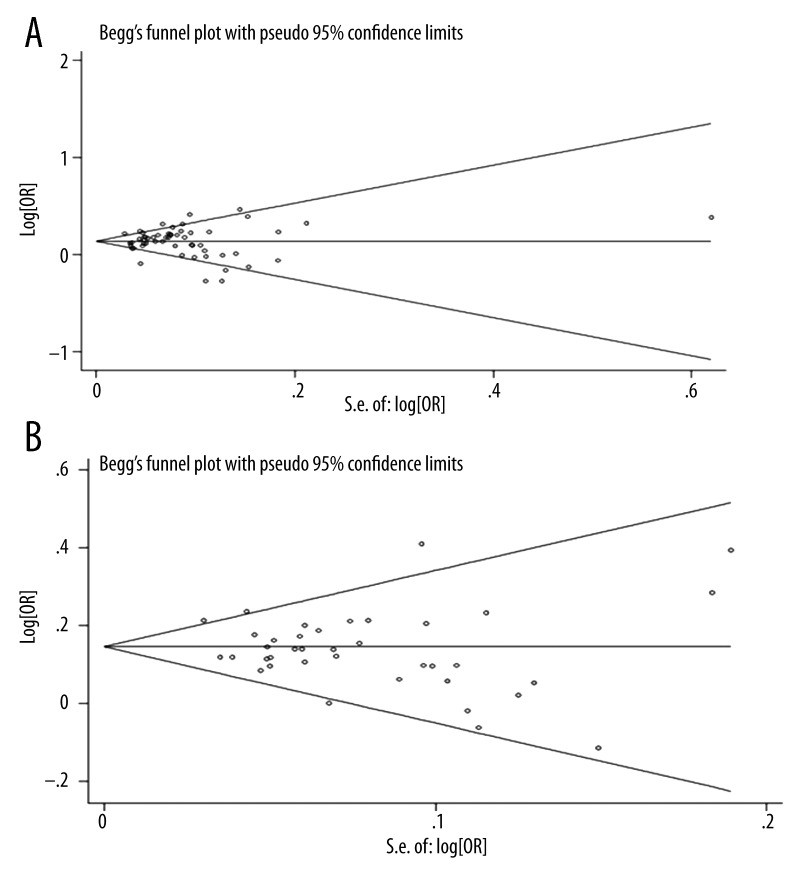
Material and methods: We searched PubMed and Cochrane Library to identify eligible studies and extract data of baseline characteristics, genotype count, odds ratio (OR), and 95% confidence interval (CI). Both adjusted OR with 95% CI and genotype counts were employed to assess the association. Genotype data were further pooled to provide estimates under different genetic models and the most appropriate model was determined. Sensitivity and cumulative analysis were conducted to assure the strength of results.
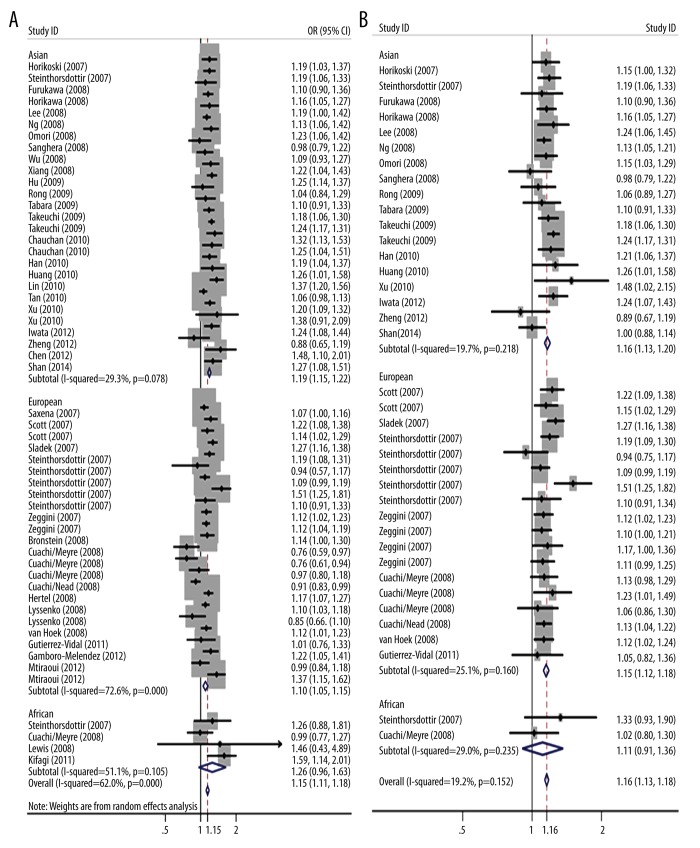
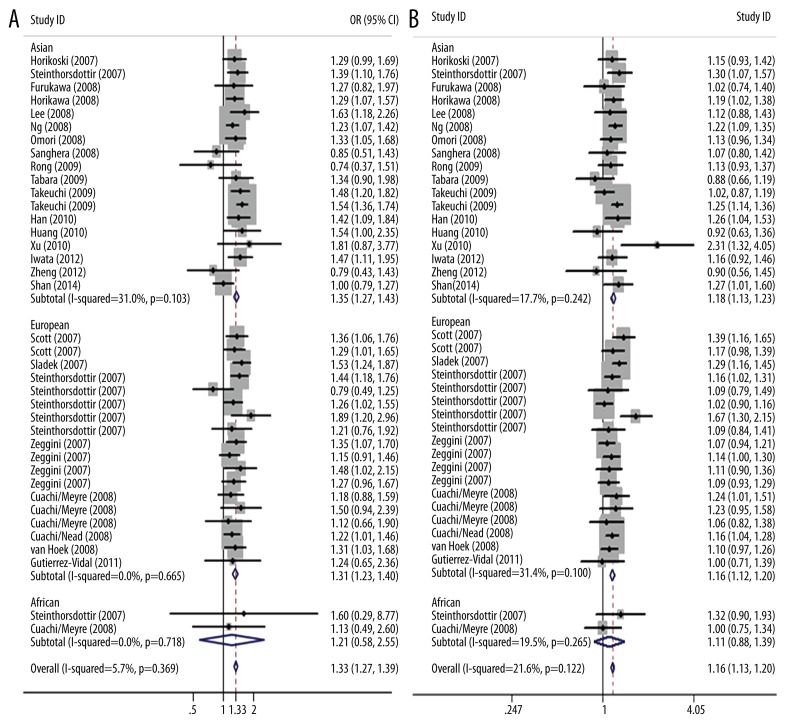
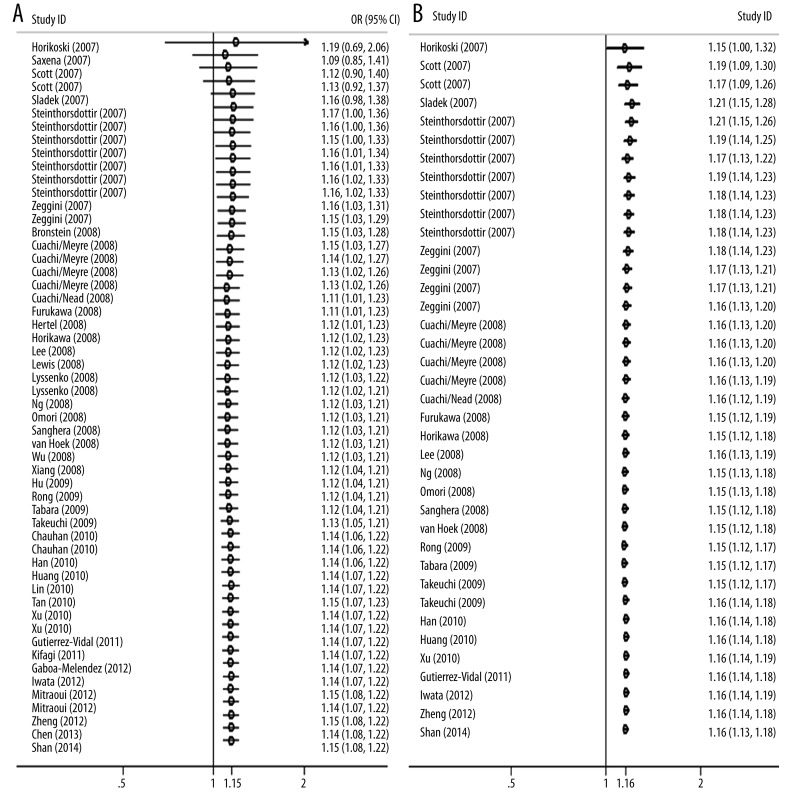
Results: Fifty-five datasets of 39 studies (including 38 of 24 with genotype count) were included. Significant associations were found in allelic contrasts using adjusted ORs and raw genotype count, respectively, overall in Asian and European populations (overall: OR=1.147/1.157, 95% CI 1.114-1.181/1.135-1.180; Asian: OR=1.186/1.165, 95% CI 1.150-1.222/1.132-1.198; European: OR=1.100/1.151, 95% CI 1.049-1.153/1.120-1.183; All p=0.00), but not in African populations (African: OR=1.255/1.111, 95% CI 0.964-1.634/0.908-1.360, p=0.091/0.305). Further analysis with genotype count under different genetic models all showed that individuals with CC genotype had 33.0% and 16.5% higher risk of type 2 diabetes than those carrying TT and CT genotypes, respectively, under the most likely codominant model. Cumulative analysis indicated gradually improved precision of estimation after studies accumulated.
Conclusions: Our results suggest that rs13266634 may be an important genetic factor of type 2 diabetes risk among Asian and European but not African populations.
Figures
References
-
- Danaei G, Finucane MM, Lu Y, et al. National, regional, and global trends in fasting plasma glucose and diabetes prevalence since 1980: systematic analysis of health examination surveys and epidemiological studies with 370 country-years and 2.7 million participants. Lancet. 2011;378:31–40. - PubMed
-
- WHO. Mortality and burden of disease attributable to selected major risks. Geneva: 2009. Global health risks.
-
- American Diabetes Association. Diagnosis and classification of diabetes mellitus. Diabetes Care. 2014:S81–90. - PubMed
-
- Steinthorsdottir V, Thorleifsson G, Sulem P, et al. Identification of low-frequency and rare sequence variants associated with elevated or reduced risk of type 2 diabetes. Nat Genet. 2014;46:294–98. - PubMed
Publication types
MeSH terms
Substances
LinkOut - more resources
Full Text Sources
Medical
