. 2015 Oct;12(10):959-62.
doi: 10.1038/nmeth.3488. Epub 2015 Jul 27.

A microfluidic device for epigenomic profiling using 100 cells

Affiliations

A microfluidic device for epigenomic profiling using 100 cells

Zhenning Cao et al. Nat Methods. 2015 Oct.

Abstract

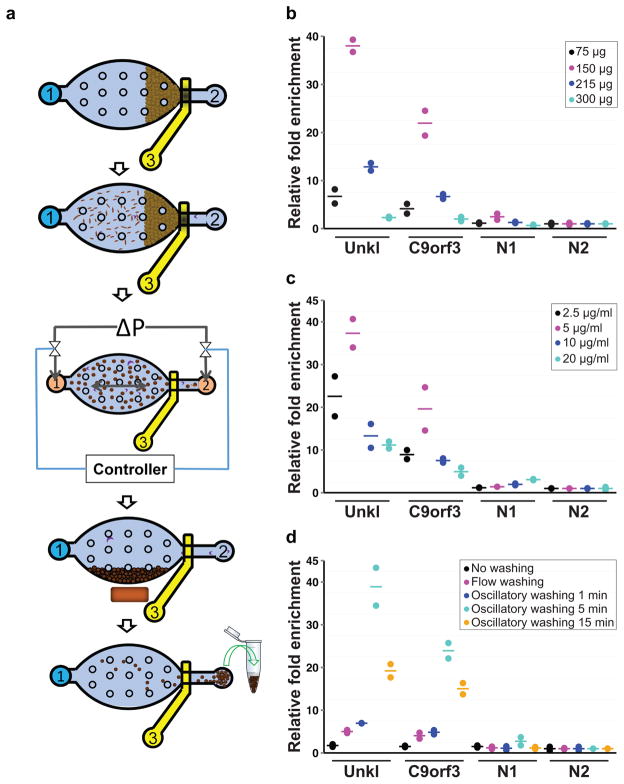
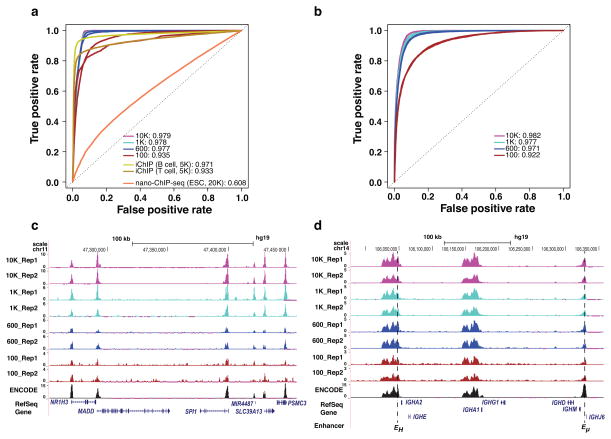
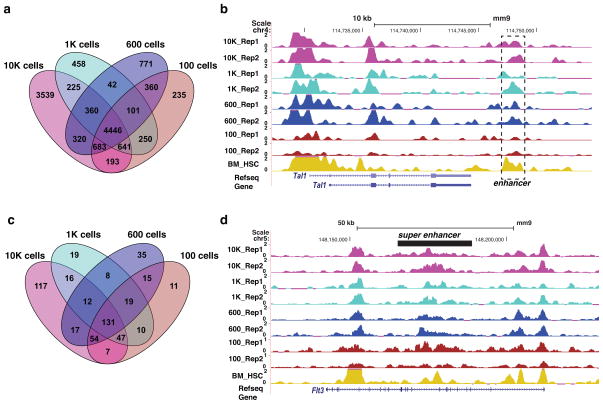
The sensitivity of chromatin immunoprecipitation (ChIP) assays poses a major obstacle for epigenomic studies of low-abundance cells. Here we present a microfluidics-based ChIP-seq protocol using as few as 100 cells via drastically improved collection of high-quality ChIP-enriched DNA. Using this technology, we uncovered many new enhancers and super enhancers in hematopoietic stem and progenitor cells from mouse fetal liver, suggesting that enhancer activity is highly dynamic during early hematopoiesis.


Conflict of interest statement

Competing financial interests: The authors declare competing financial interests. Virginia Polytechnic Institute and State University (on behalf of C.L. and Z.C.) filed an US utility patent (US letters patent serial no. 14/511,422) on the MOWChIP-Seq technology on Oct 10, 2014.

Figures

Figure 1
Figure 1. Overview of the MOWChIP-Seq protocol and its optimization
(a) Schematic illustration for the five major steps of the protocol: step 1: Formation of a packed bed of IP beads; step 2: ChIP by flowing the chromatin fragments through the packed bed; step 3: Oscillatory washing; step 4: Removal of the unbound chromatin fragments and debris by flushing the chamber; step 5: Collection of the IP beads. The microfluidic chamber contains supporting pillars (shown as small circles) that prevent collapsing. (b–d) Optimization of the MOWChIP-Seq protocol. Major parameters of the protocol were optimized by checking for IP fold enrichment of known positive (UNKL and C9orf3) and negative loci (N1 and N2). IP was done against H3K4me3 in GM12878 cells. All experiments were conducted in duplicate and the horizontal lines represent the mean. Parameters optimized include: amount of beads in device chamber (b); concentration of antibody used for coating IP beads (c); washing duration in each of the two washing buffers (d). The relative fold enrichment was normalized against that of N2. 1000-cell samples were used in (b–d). 150 μg IP beads were used in (c, d). The antibody concentration for coating was 5 μg/ml for (b) and (d). The duration of oscillatory washing was 5 min for (b, c). Flow washing in (d) was implemented by flowing each washing buffer unidirectionally for 3 min under 1.5 μl/min.
Figure 2
Figure 2. MOWChIP-Seq generates high quality data using as few as 100 cells
The performance of MOWChIP-Seq was compared to those of two other methods: nano-ChIP-seq and iChIP. (a) Receiver Operating Characteristic (ROC) curves for H3K4me3 data. ROC curves were constructed by comparing the ChIP-Seq data generated by various methods to published gold-standard data generated using conventional protocols with millions of cells. Nano-ChIP-Seq data was from Adli et al. ; iChIP data was from Lara-Astiaso et al. . Values shown are average Area Under the ROC curve (AUC) of two replicate experiments. (b) ROC curves for H3K27Ac data generated by MOWChIP-Seq. (c) Normalized H3K4me3 MOWChIP-Seq signals at the SPI1 gene locus using data generated with various sample sizes. ENCODE data were generated using millions of cells and shown for comparison. (d) Normalized H3K27Ac MOWChIP-Seq signals at the immunoglobin heavy chain locus. Known B-cell enhancers are indicated at the bottom of the figure.
Figure 3
Figure 3. Epigenomics-aided discovery of novel enhancers and super enhancers in fetal liver HSPCs
(a) Venn diagram of sets of enhancers predicted using epigenomic data generated using various sample sizes. (b) Normalized H3K27Ac ChIP-Seq signals at the known Tal +19 enhancer. BM_HSC denotes data on bone marrow HSC generated by Lara-Astiaso et al. . (c) Venn diagram of sets of super enhancers predicted using epigenomic data generated using various sample sizes. (d) Normalized H3K27Ac ChIP-Seq signals at the super enhancer of the Flt3 gene that plays a critical role in hematopoiesis.

References

    1. Park PJ. Nat Rev Genet. 2009;10:669–680. - PMC - PubMed
    1. Adli M, Zhu J, Bernstein BE. Nat Methods. 2010;7:615–618. - PMC - PubMed
    1. Shankaranarayanan P, et al. Nat Methods. 2011;8:565–U565. - PubMed
    1. Zwart W, et al. BMC Genomics. 2013;14:232. - PMC - PubMed
    1. Lara-Astiaso D, et al. Science. 2014;345:943–949. - PMC - PubMed

Publication types