. 2015 Aug;17(8):994-1003.
doi: 10.1038/ncb3205. Epub 2015 Jul 27.

Generation of vascular endothelial and smooth muscle cells from human pluripotent stem cells

Affiliations

Generation of vascular endothelial and smooth muscle cells from human pluripotent stem cells

Christoph Patsch et al. Nat Cell Biol. 2015 Aug.

Abstract

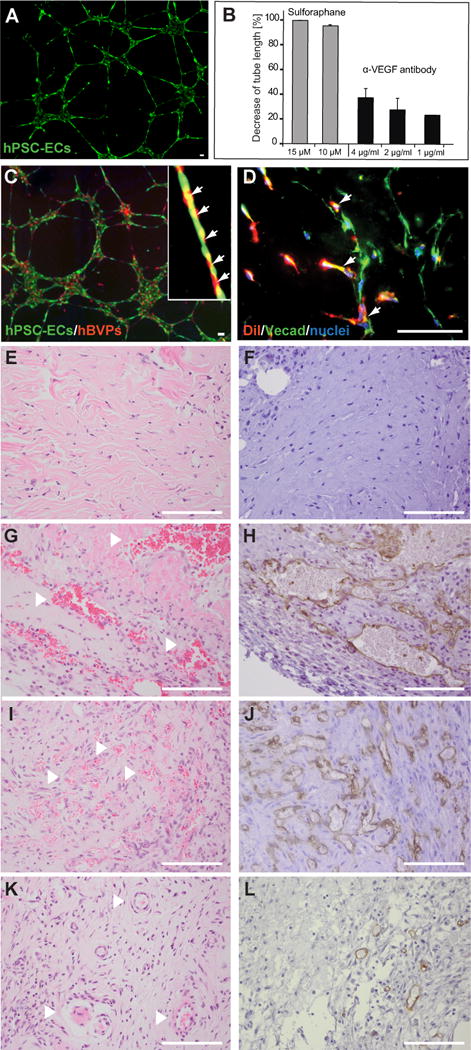
The use of human pluripotent stem cells for in vitro disease modelling and clinical applications requires protocols that convert these cells into relevant adult cell types. Here, we report the rapid and efficient differentiation of human pluripotent stem cells into vascular endothelial and smooth muscle cells. We found that GSK3 inhibition and BMP4 treatment rapidly committed pluripotent cells to a mesodermal fate and subsequent exposure to VEGF-A or PDGF-BB resulted in the differentiation of either endothelial or vascular smooth muscle cells, respectively. Both protocols produced mature cells with efficiencies exceeding 80% within six days. On purification to 99% via surface markers, endothelial cells maintained their identity, as assessed by marker gene expression, and showed relevant in vitro and in vivo functionality. Global transcriptional and metabolomic analyses confirmed that the cells closely resembled their in vivo counterparts. Our results suggest that these cells could be used to faithfully model human disease.


Conflict of interest statement

Competing Financial Interests

The other authors report no relevant conflicts of interest.

Figures

Figure 1
Figure 1. Canonical Wnt activation by GSK3ß inhibitors and mesoderm induction
(A) Luciferase assay of the ß-catenin promoter activity after treatment with increasing concentrations of GSK3ß inhibitors. A 6-point 3-fold serial dilution of each compound was performed (10, 3, 1, 0.3, 0.1, 0.03 μM, last 2 concentration data not shown). Columns show means +/− SD of 5 independent experiments. (B) Immunofluorescent localization of ß-catenin in hPSCs after a 24 hours treatment with either CP21 or CHIR. Representative image shown of 3 independent experiments on 3 different wells per condition. Scale bars: 50 μM (C) Quantitative PCR of ß-catenin target genes upon treatment of hPSCs with CP21 or CHIR. Results shown are means and SEM of 3 independent experiments with 3 biological and technical replicates for each gene. (D) Immunofluorescence staining of hPSCs for markers of pluripotency, mesoderm and endoderm during the first 4 days of differentiation. Representative image shown of 3 independent experiments on 3 different wells per condition. Scale bars: 50 μM.
Figure 2
Figure 2. VEGF and PDGF-BB-mediated differentiation of hPSCs into vascular endothelial or vascular smooth muscle cells
(A) Differentiation efficiency of hPSC-ECs and hPSC-VSMCs from four different hESCs and iPSCs lines, (SEM 3.1, n=10 independent differentiation experiments) for hPSC-ECs and (SEM 2.7, n=16 independent differentiation experiments) for hPSC-VSMCs. Columns show means +/− SEM (B) Representative FACs plots from the differentiation experiments described in A): hPSCs (top panel) hPSC-derived ECs (middle panel) or hPSC-derived VSMCs (lower panel) stained for CD144 and CD140b. n= 10 (hPSC-ECs) and 16 (hPSC-VSMCs) independent differentiation experiments (C) Immunostaining of EC-specific markers on hPSC-ECs; vWF=Von Willebrand factor. All cells (100%) were expressing VE-CAdherin and PECAM1 for both GSK3 inhibitors. 73.48% of the hPSC-ECs differentiated with CHIR and 74.52% of the cells differentiated with CP21 express vWF. Representative image shown of 3 independent experiments on 3 different wells per marker. Scale bars: 50 μM. (D) Immunostaining of VSMCs-specific markers on hPSC-VSMCs; SMA=smooth muscle actin alpha. For CHIR 48% of cells expressed SMA, 96.99% Myosin IIB and 98.7% SM22a. For CP21 62.08% of cells expressed SMA, 92.75% Myosin IIB and 100% SM22a. Representative image shown of 3 independent experiments. Scale bars: 50 μM. (E) Schematic illustration of EC differentiation strategy for hPSCs. (F) Schematic illustration of VSMCs differentiation strategy for hPSCs.
Figure 3
Figure 3. Global transcriptome and metabolomic analyses confirm vascular cell identity of differentiated hPSCs
(A) Global heat map of 2955 differentially expressed genes between embryonic stem cells (ESC) and differentiated endothelial cells (EC), vascular smooth muscle cells (VSMC), and primary cells (>10 fold change for at least one cell type). HUVEC= human umbilical vein EC, HSVEC= human saphenous vein EC, HAEC= human aortic EC, HPVSMC= human pulmonary VSMC, HAVSMC= human aortic VSMC. Columns represent genes, and rows are samples. Column Z-score transformation was performed on log2 expression values for each gene with blue denoting a lower and red a higher expression level according to the average expression level. Hierarchical clustering of genes and samples is based on average linkage and correlation distance. (B) Heat map of marker genes panels for pluripotency, smooth muscle and endothelial cells across the same samples as in (A). Columns represent genes, and rows are samples. Column Z-score transformation was performed on log2 values for each gene with blue denoting a lower and red a higher expression level according to the average expression level. Hierarchical clustering of genes and samples is based on average linkage and correlation distance. (C) Heatmap of the metabolite composition of the different cell types clustered by similarities for the 66 metabolites detected intracellularly (see Supplemental Figure 5 for list of metabolites). Columns represent metabolites and rows represent samples. A dendogram beside the left y-axis illustrates clustering by similarity of metabolite value. There were n=3 cell line biological replicates for each cell type. Metabolite data was acquired as a single acquisition on mass spectrometer. Raw metabolite levels were log2 transformed to approximate a normal distribution. Red = higher values, blue = lower values. PSC= pluripotent stem cell, (c)= contractile and (s)= synthetic, UASMC= umbilical artery smooth muscle cell, HCAEC= human coronary artery EC. (D) Correlation matrix of spearman correlation coefficients of metabolite levels for each cell type. Color code represents strength of correlation: red = strongest correlation, blue = weakest. Spearman rank correlation performed on the non-parametric raw metabolite values and expressed as a correlation matrix (see Supplemental Figure 5 for list of metabolites). n=3 cell line biological replicates for each cell type. Metabolite data was acquired as a single acquisition on mass spectrometer. PSC = pluripotent parental stem cell, (c)= contractile and (s)= synthetic.
Figure 4
Figure 4. In vitro characterization of hPSC-ECs and hPSC-VSMCs
(A) Impedance-based monitoring of hPSC-EC monolayer culture. Thrombin treatment (blue, see inset) induced rapid decrease in impedance compared to control (red). One of the 4 independent experiments is depicted (n=8 technical replicates/experiment). Points represent mean +/− SD. (B) Trans-endothelial electrical resistance (TEER) properties of human umbilical cord endothelial cells (HUVECs) and hPSC-ECs either untreated or treated with 100ng/ml TNF-α; 100ng/ml VEGFA or 100ng/ml IL1; n=3 wells of 3 independent experiments (n= 9 wells in total except for untreated hPSC-ECs n=7 in total). Columns show mean +/− SEM. Student t-test ** p=5.56×10⁻⁶; * p=1.61×10⁻⁵. (C) Uptake of fluorescently labeled acLDL by hPSC-ECs. Scale bars: 50μM. Representative image of 3 independent experiments. (D, E) Expression analyses of adhesion molecule ICAM1 upon treatment of hPSC-ECs with proinflammatory cytokines. Representative images and FACS plot from 3 independent experiments (3 technical replicates/experiment). (D) Immunofluorescence staining reveals upregulation of ICAM1 by TNFα treatment. Scale bars: 50μM. (E) Quantification of ICAM1 expression upon TNFα or IL1ß stimulation. (F) Immunostaining (left) and quantification of adhesion of leukocyte-like HL60 cells to hPSC-ECs upon TNFα stimulation. Scale bars: 50μM. Columns show mean +/− SD of 3 independent experiments. (G) Dose-dependent blockage of HL60 cell adhesion by anti-ICAM1 antibody pretreatment. Columns show mean +/− SD of 3 independent experiments (except for treatment with control antibody concentrations 0.1, 1. 3, here n=1) (H) Calcium imaging of SC-VSMCs at day 13 of differentiation. Stimulation with vasoconstrictive reagents resulted in increase in intracellular calcium. Fold change RFU to t=1 (before treatment) at t=50s (maximum peak). Columns show mean +/− SD of 3 independent assays and data were evaluated using Student’s t-test; * = p=0.03 (I) Contractility assay on UASMCs and hPSC-VSMCs with U46619 48 hours after treatment. This graph shows one single experiment where control = 1 well and test = 2 wells per conditions.
Figure 5
Figure 5. Co-culture experiments and in vivo characterization of hPSC-ECs
(A) In vitro tube formation assay of hPSC-ECs plated on matrigel for 24 hours, representative picture from 10 independent experiments. Scale bar: 50μm. (B) Quantification of the inhibitory effect of anti-angiogenic molecules on the tubologenesis of hPSC-ECs. Columns show means +/− SD of 3 independent experiments, (1ug/ml anti-VEGF, here n=1, no error bar) (C) Tube formation of hPSC-ECs with primary human brain vascular pericytes (hBVPs) (red) on matrigel after 24 hours. Scale bar: 50μm. (D) Close-up view in insert shows tubular structures formed by hPSC-ECs with closely associated hBVPs (arrows), representative picture from 3 independent experiments. Scale bar: 50μm. (E-L) Representative pictures of fibrinogen grafts 14 days after implantation (except E and F, 7 days post implantation), (E,G,I,K) HE staining (F,H,J,L) human specific CD31/DAB staining. (E,F) hPSC-ECs only (G,H) HUVECs + MSCs (I,J) hPSC-ECs + MSCs and (K, L) hPSC-ECs+hPSC-VSMCs. This experiment was conducted once with 5 mice per conditions and 2 implants per mice (=10 implants per conditions). Scale bar: 50μm.

References

    1. Thomson JA, et al. Embryonic stem cell lines derived from human blastocysts. Science. 1998;282:1145–1147. - PubMed
    1. Takahashi K, et al. Induction of pluripotent stem cells from adult human fibroblasts by defined factors. Cell. 2007;131:861–872. doi: 10.1016/j.cell.2007.11.019. - DOI - PubMed
    1. Yu J, et al. Induced pluripotent stem cell lines derived from human somatic cells. Science. 2007;318:1917–1920. doi: 10.1126/science.1151526. - DOI - PubMed
    1. Grskovic M, Javaherian A, Strulovici B, Daley GQ. Induced pluripotent stem cells–opportunities for disease modelling and drug discovery. Nature reviews Drug discovery. 2011;10:915–929. doi: 10.1038/nrd3577. - DOI - PubMed
    1. Tiscornia G, Vivas EL, Belmonte JC. Diseases in a dish: modeling human genetic disorders using induced pluripotent cells. Nat Med. 2011;17:1570–1576. doi: 10.1038/nm.2504. - DOI - PubMed

Publication types

MeSH terms