

Comparative Proteomics of Activated THP-1 Cells Infected with Mycobacterium tuberculosis Identifies Putative Clearance Biomarkers for Tuberculosis Treatment
- PMID: 26214306
- PMCID: PMC4516286
- DOI: 10.1371/journal.pone.0134168
Comparative Proteomics of Activated THP-1 Cells Infected with Mycobacterium tuberculosis Identifies Putative Clearance Biomarkers for Tuberculosis Treatment
Abstract
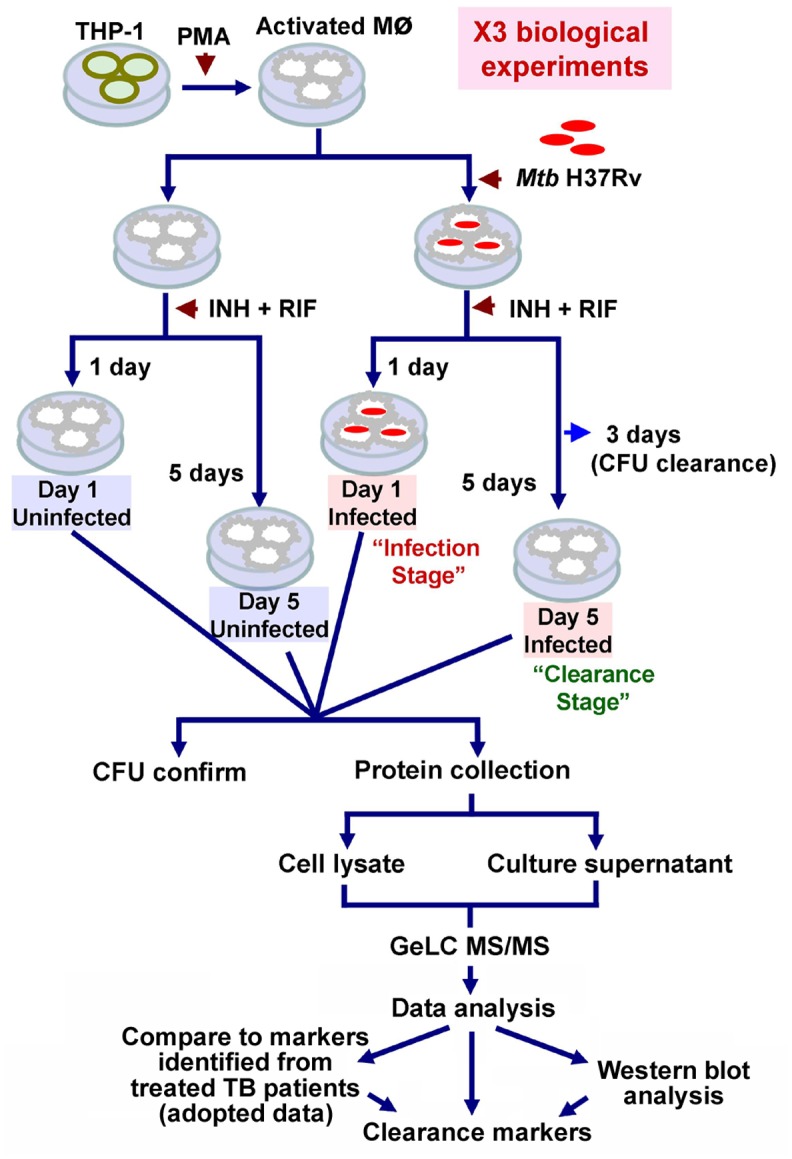
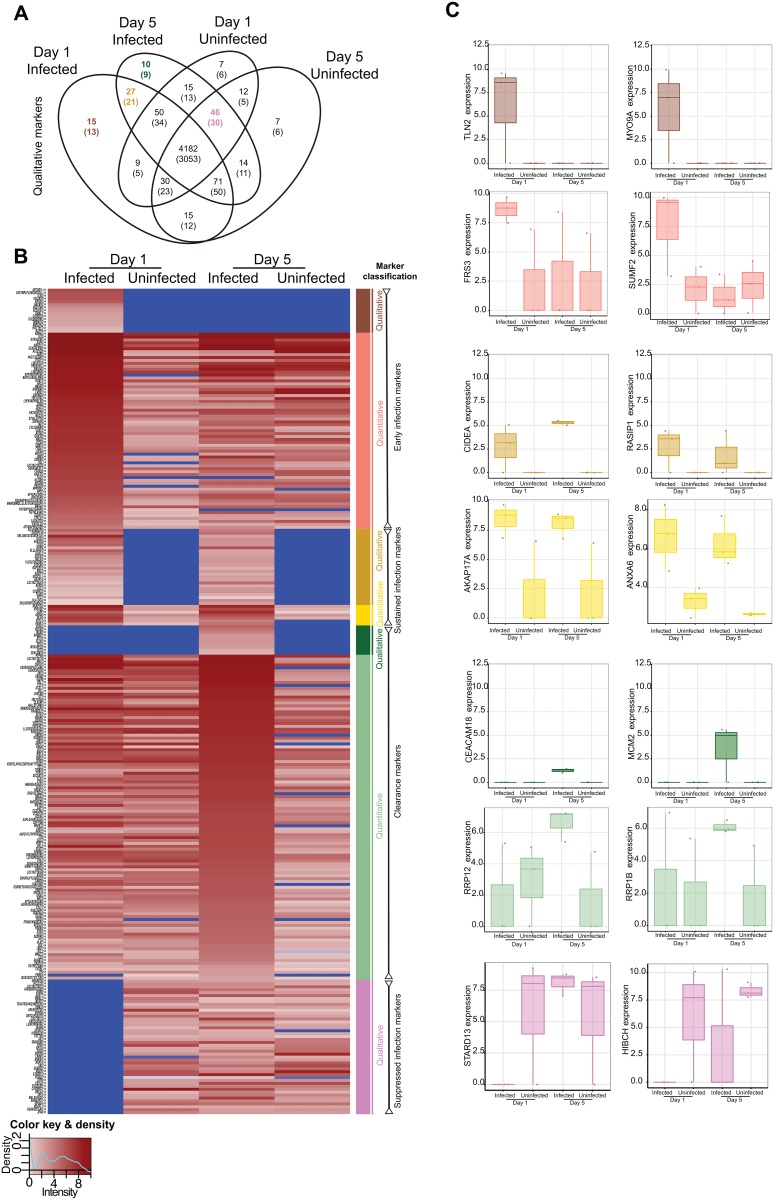
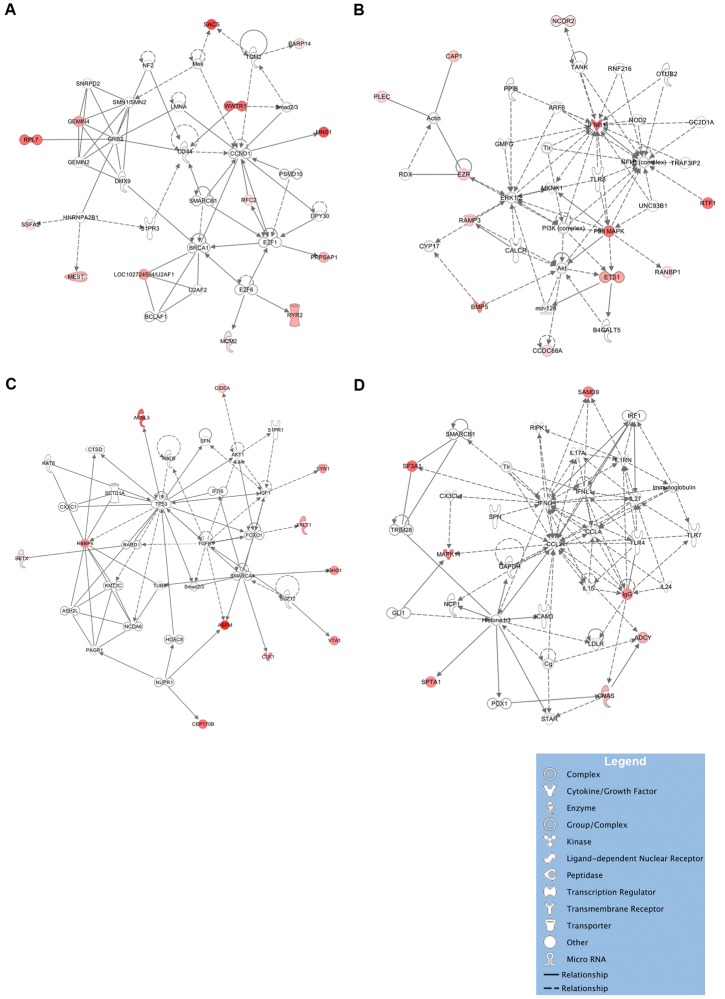
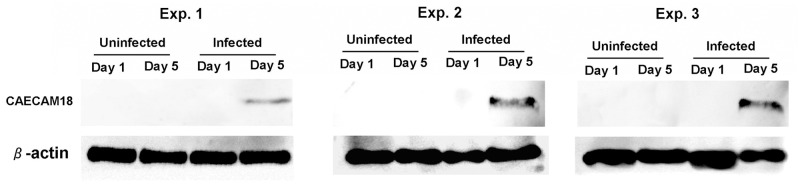
Biomarkers for determining clearance of Mycobacterium tuberculosis (Mtb) infection during anti-tuberculosis therapy or following exposure could facilitate enhanced monitoring and treatment. We screened for biomarkers indicating clearance of Mtb infection in vitro. A comparative proteomic analysis was performed using GeLC MSI/MS. Intracellular and secreted proteomes from activated THP-1 cells infected with the Mtb H37Rv strain (MOI = 1) and treated with isoniazid and rifampicin for 1 day (infection stage) and 5 days (clearance stage) were analyzed. Host proteins associated with early infection (n = 82), clearance (n = 121), sustained in both conditions (n = 34) and suppressed by infection (n = 46) were elucidated. Of the potential clearance markers, SSFA2 and CAECAM18 showed the highest and lowest protein intensities, respectively. A western blot of CAECAM18 validated the LC MS/MS result. For three clearance markers (SSFA2, PARP14 and PSME4), in vivo clinical validation was concordantly reported in previous patient cohorts. A network analysis revealed that clearance markers were enriched amongst four protein interaction networks centered on: (i) CD44/CCND1, (ii) IFN-β1/NF-κB, (iii) TP53/TGF-β and (iv) IFN-γ/CCL2. After infection, proteins associated with proliferation, and recruitment of immune cells appeared to be enriched possibly reflecting recruitment of defense mechanisms. Counteracting proteins (CASP3 vs. Akt and NF-κB vs. TP53) associated with apoptosis regulation and its networks were enriched among the early and sustained infection biomarkers, indicating host-pathogen competition. The BRCA1/2 network was suppressed during infection, suggesting that cell proliferation suppression is a feature of Mtb survival. Our study provides insights into the mechanisms of host-Mtb interaction by comparing the stages of infection clearance. The identified clearance biomarkers may be useful in monitoring tuberculosis treatment.
Conflict of interest statement
Figures
Similar articles
-
Proteomic analysis of infected primary human leucocytes revealed PSTK as potential treatment-monitoring marker for active and latent tuberculosis.PLoS One. 2020 Apr 16;15(4):e0231834. doi: 10.1371/journal.pone.0231834. eCollection 2020. PLoS One. 2020. PMID: 32298370 Free PMC article.
-
Proteomics of Mycobacterium Infection: Moving towards a Better Understanding of Pathogen-Driven Immunomodulation.Front Immunol. 2018 Jan 30;9:86. doi: 10.3389/fimmu.2018.00086. eCollection 2018. Front Immunol. 2018. PMID: 29441067 Free PMC article. Review.
-
Mycobacterium tuberculosis curli pili reduces oxygen consumption rate of THP-1 macrophages during early infection.Int J Biochem Cell Biol. 2025 Aug;185:106802. doi: 10.1016/j.biocel.2025.106802. Epub 2025 May 15. Int J Biochem Cell Biol. 2025. PMID: 40381906
-
Proteomic characterization of Mycobacterium tuberculosis reveals potential targets of bostrycin.J Proteomics. 2020 Feb 10;212:103576. doi: 10.1016/j.jprot.2019.103576. Epub 2019 Nov 6. J Proteomics. 2020. PMID: 31706025
-
Mycobacterial proteomics: analysis of expressed proteomes and post-translational modifications to identify candidate virulence factors.Expert Rev Proteomics. 2015 Feb;12(1):21-35. doi: 10.1586/14789450.2015.1007046. Expert Rev Proteomics. 2015. PMID: 25603863 Review.
Cited by
-
Characterisation of secretome-based immune responses of human leukocytes infected with various Mycobacterium tuberculosis lineages.PeerJ. 2021 Jun 3;9:e11565. doi: 10.7717/peerj.11565. eCollection 2021. PeerJ. 2021. PMID: 34141493 Free PMC article.
-
Comparative Proteomics Analysis of Human Macrophages Infected with Virulent Mycobacterium bovis.Front Cell Infect Microbiol. 2017 Mar 9;7:65. doi: 10.3389/fcimb.2017.00065. eCollection 2017. Front Cell Infect Microbiol. 2017. PMID: 28337427 Free PMC article.
-
Lymphocyte-Specific Biomarkers Associated With Preterm Birth and Bronchopulmonary Dysplasia.Front Immunol. 2021 Jan 21;11:563473. doi: 10.3389/fimmu.2020.563473. eCollection 2020. Front Immunol. 2021. PMID: 33552042 Free PMC article.
-
Proteomic analysis of drug-susceptible and multidrug-resistant nonreplicating Beijing strains of Mycobacterium tuberculosis cultured in vitro.Biochem Biophys Rep. 2021 Mar 9;26:100960. doi: 10.1016/j.bbrep.2021.100960. eCollection 2021 Jul. Biochem Biophys Rep. 2021. PMID: 33748436 Free PMC article.
-
Plasma Proteomics of Type 2 Diabetes, Hypertension, and Co-Existing Diabetes/Hypertension in Thai Adults.Life (Basel). 2024 Oct 5;14(10):1269. doi: 10.3390/life14101269. Life (Basel). 2024. PMID: 39459569 Free PMC article.
References
-
- Flynn JL, Chan J. Immunology of tuberculosis. Annu Rev Immunol. 2001;19:93–129. - PubMed
Publication types
MeSH terms
Substances
Grants and funding
LinkOut - more resources
Full Text Sources
Other Literature Sources
Medical
Research Materials
Miscellaneous
