

Identification of Glial Activation Markers by Comparison of Transcriptome Changes between Astrocytes and Microglia following Innate Immune Stimulation
- PMID: 26214311
- PMCID: PMC4516330
- DOI: 10.1371/journal.pone.0127336
Identification of Glial Activation Markers by Comparison of Transcriptome Changes between Astrocytes and Microglia following Innate Immune Stimulation
Abstract
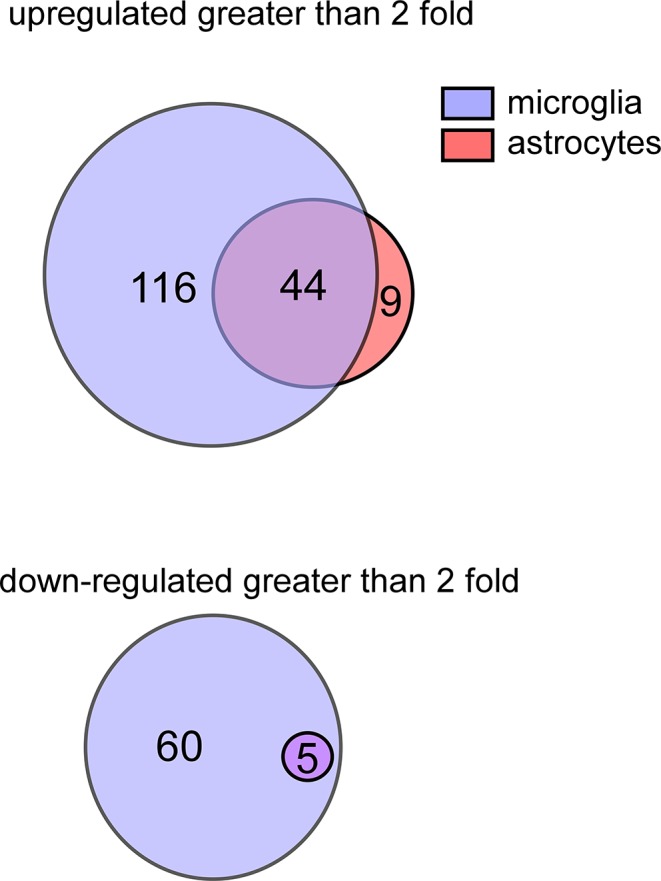
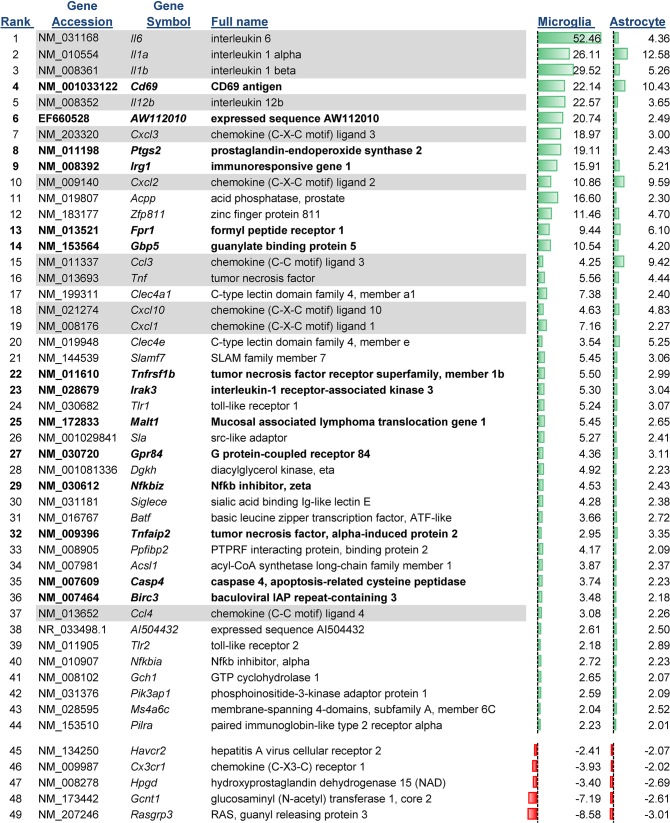
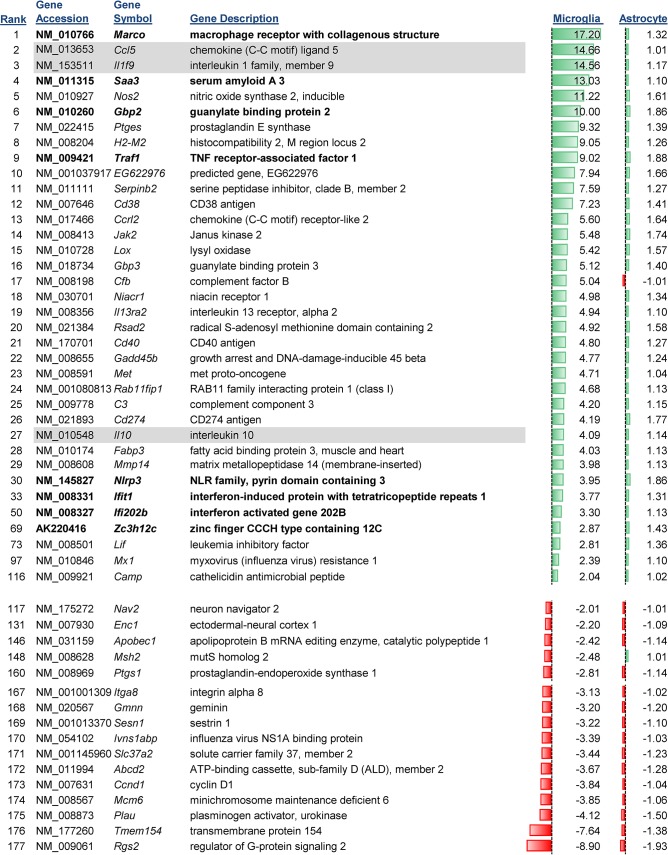
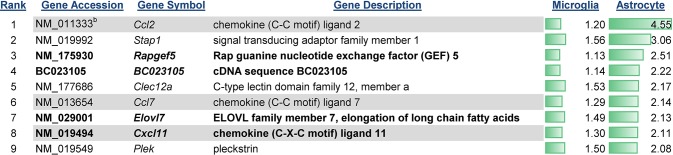
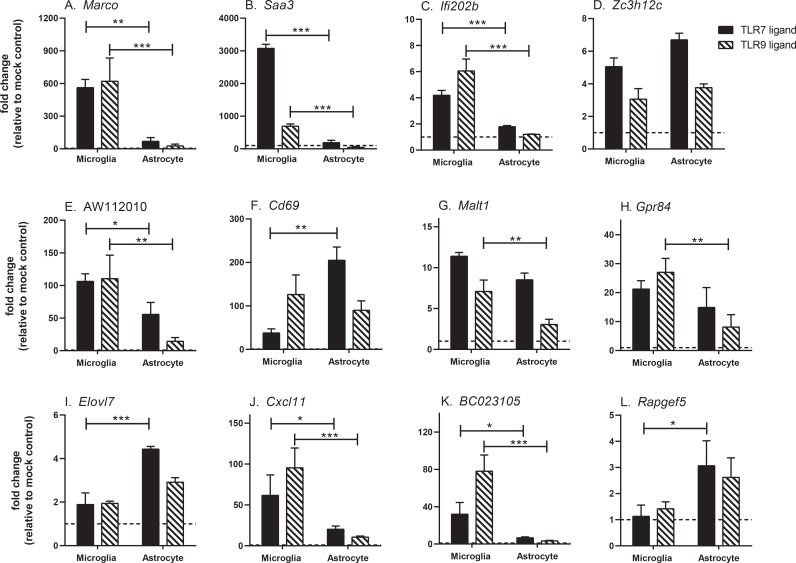
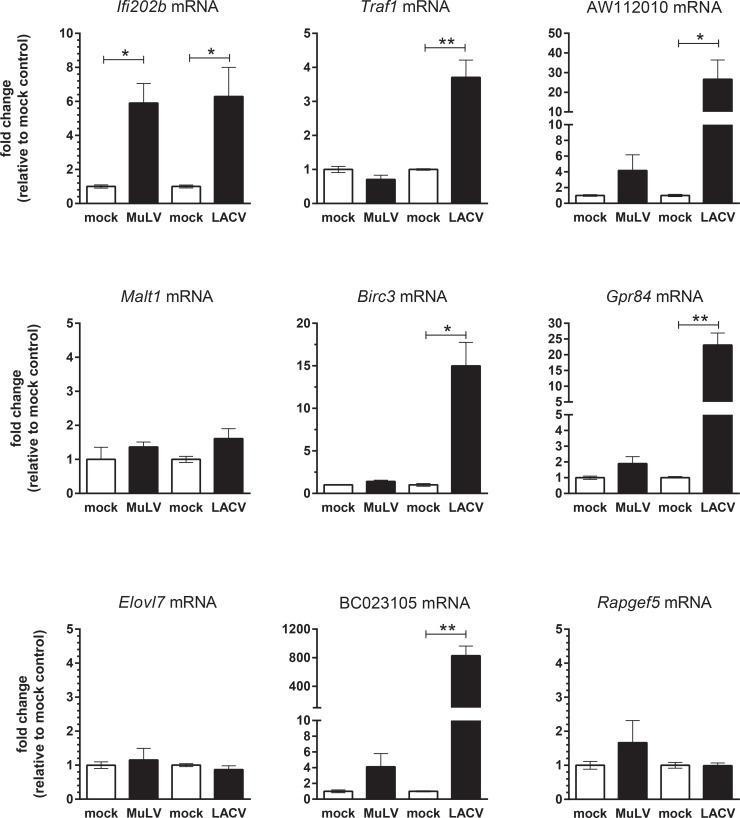
The activation of astrocytes and microglia is often associated with diseases of the central nervous system (CNS). Understanding how activation alters the transcriptome of these cells may offer valuable insight regarding how activation of these cells mediate neurological damage. Furthermore, identifying common and unique pathways of gene expression during activation may provide new insight into the distinct roles these cells have in the CNS during infection and inflammation. Since recent studies indicate that TLR7 recognizes not only viral RNA but also microRNAs that are released by damaged neurons and elevated during neurological diseases, we first examined the response of glial cells to TLR7 stimulation using microarray analysis. Microglia were found to generate a much stronger response to TLR7 activation than astrocytes, both in the number of genes induced as well as fold induction. Although the primary pathways induced by both cell types were directly linked to immune responses, microglia also induced pathways associated with cellular proliferation, while astrocytes did not. Targeted analysis of a subset of the upregulated genes identified unique mRNA, including Ifi202b which was only upregulated by microglia and was found to be induced during both retroviral and bunyavirus infections in the CNS. In addition, other genes including Birc3 and Gpr84 as well as two expressed sequences AW112010 and BC023105 were found to be induced in both microglia and astrocytes and were upregulated in the CNS following virus infection. Thus, expression of these genes may a useful measurement of glial activation during insult or injury to the CNS.
Conflict of interest statement
Figures
Similar articles
-
Interactions between TLR7 and TLR9 agonists and receptors regulate innate immune responses by astrocytes and microglia.Glia. 2010 Apr 15;58(6):650-64. doi: 10.1002/glia.20952. Glia. 2010. PMID: 19998480 Free PMC article.
-
Induction of chemokine and cytokine genes in astrocytes following infection with Theiler's murine encephalomyelitis virus is mediated by the Toll-like receptor 3.Glia. 2006 Jun;53(8):858-67. doi: 10.1002/glia.20346. Glia. 2006. PMID: 16586493
-
A role for DNA-dependent activator of interferon regulatory factor in the recognition of herpes simplex virus type 1 by glial cells.J Neuroinflammation. 2011 Aug 12;8:99. doi: 10.1186/1742-2094-8-99. J Neuroinflammation. 2011. PMID: 21838860 Free PMC article.
-
Role of astroglial toll-like receptors (TLRs) in central nervous system infections, injury and neurodegenerative diseases.Brain Behav Immun. 2021 Jan;91:740-755. doi: 10.1016/j.bbi.2020.10.007. Epub 2020 Oct 8. Brain Behav Immun. 2021. PMID: 33039660 Free PMC article. Review.
-
Innate immunity and neuroinflammation in the CNS: the role of microglia in Toll-like receptor-mediated neuronal injury.Glia. 2010 Feb;58(3):253-63. doi: 10.1002/glia.20928. Glia. 2010. PMID: 19705460 Review.
Cited by
-
PET Imaging of Innate Immune Activation Using 11C Radiotracers Targeting GPR84.JACS Au. 2023 Dec 1;3(12):3297-3310. doi: 10.1021/jacsau.3c00435. eCollection 2023 Dec 25. JACS Au. 2023. PMID: 38155640 Free PMC article.
-
Effect of GPR84 deletion on obesity and diabetes development in mice fed long chain or medium chain fatty acid rich diets.Eur J Nutr. 2018 Aug;57(5):1737-1746. doi: 10.1007/s00394-017-1456-5. Epub 2017 Apr 20. Eur J Nutr. 2018. PMID: 28429080
-
Microglial Metamorphosis in Three Dimensions in Virus Limbic Encephalitis: An Unbiased Pictorial Representation Based on a Stereological Sampling Approach of Surveillant and Reactive Microglia.Brain Sci. 2021 Jul 30;11(8):1009. doi: 10.3390/brainsci11081009. Brain Sci. 2021. PMID: 34439628 Free PMC article.
-
LncRNA AW112010 Promotes Mitochondrial Biogenesis and Hair Cell Survival: Implications for Age-Related Hearing Loss.Oxid Med Cell Longev. 2019 Oct 27;2019:6150148. doi: 10.1155/2019/6150148. eCollection 2019. Oxid Med Cell Longev. 2019. PMID: 31781342 Free PMC article.
-
Innate immune responses after stimulation with Toll-like receptor agonists in ex vivo microglial cultures and an in vivo model using mice with reduced microglia.J Neuroinflammation. 2021 Sep 6;18(1):194. doi: 10.1186/s12974-021-02240-w. J Neuroinflammation. 2021. PMID: 34488805 Free PMC article.
References
-
- Itagaki S, McGeer PL, Akiyama H, Zhu S, Selkoe D (1989) Relationship of microglia and astrocytes to amyloid deposits of Alzheimer disease. J Neuroimmunol 24: 173–182. - PubMed
-
- Minagar A, Shapshak P, Fujimura R, Ownby R, Heyes M, Eisdorfer C (2002) The role of macrophage/microglia and astrocytes in the pathogenesis of three neurologic disorders: HIV-associated dementia, Alzheimer disease, and multiple sclerosis. J Neurol Sci 202: 13–23. S0022510X02002071 [pii]. - PubMed
Publication types
MeSH terms
Substances
Grants and funding
LinkOut - more resources
Full Text Sources
Other Literature Sources
