

Did α-Synuclein and Glucocerebrosidase Coevolve? Implications for Parkinson's Disease
- PMID: 26214314
- PMCID: PMC4516260
- DOI: 10.1371/journal.pone.0133863
Did α-Synuclein and Glucocerebrosidase Coevolve? Implications for Parkinson's Disease
Abstract
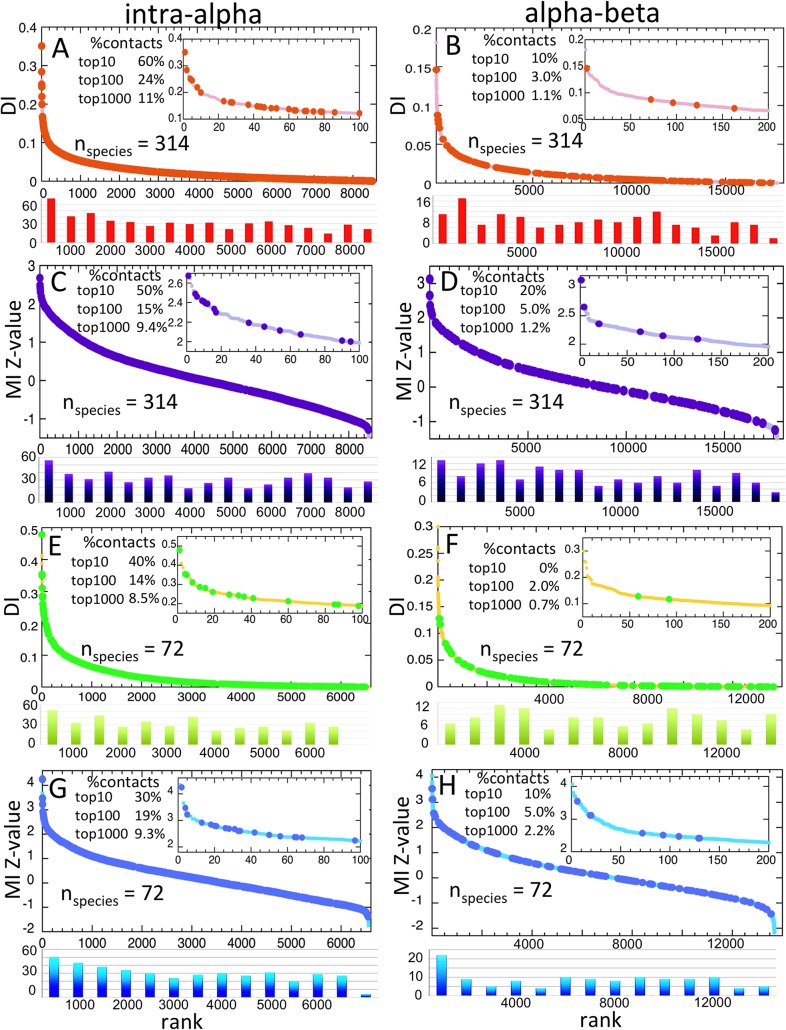
Mutations in the GBA1 gene are associated with increased risk of Parkinson's disease, and the protein produced by the gene, glucocerebrosidase, interacts with α-synuclein, the protein at the center of the disease etiology. One possibility is that the mutations disrupt a beneficial interaction between the proteins, and a beneficial interaction would imply that the proteins have coevolved. To explore this possibility, a correlated mutation analysis has been performed for all 72 vertebrate species where complete sequences of α-synuclein and glucocerebrosidase are known. The most highly correlated pair of residue variations is α-synuclein A53T and glucocerebrosidase G115E. Intriguingly, the A53T mutation is a Parkinson's disease risk factor in humans, suggesting the pathology associated with this mutation and interaction with glucocerebrosidase might be connected. Correlations with β-synuclein are also evaluated. To assess the impact of lowered species number on accuracy, intra and inter-chain correlations are also calculated for hemoglobin, using mutual information Z-value and direct coupling analyses.
Conflict of interest statement
Figures


Similar articles
-
Reduced glucocerebrosidase is associated with increased α-synuclein in sporadic Parkinson's disease.Brain. 2014 Mar;137(Pt 3):834-48. doi: 10.1093/brain/awt367. Epub 2014 Jan 28. Brain. 2014. PMID: 24477431 Free PMC article.
-
Glucocerebrosidase modulates cognitive and motor activities in murine models of Parkinson's disease.Hum Mol Genet. 2016 Jul 1;25(13):2645-2660. doi: 10.1093/hmg/ddw124. Epub 2016 Apr 28. Hum Mol Genet. 2016. PMID: 27126635 Free PMC article.
-
Augmentation of phenotype in a transgenic Parkinson mouse heterozygous for a Gaucher mutation.Brain. 2014 Dec;137(Pt 12):3235-47. doi: 10.1093/brain/awu291. Epub 2014 Oct 27. Brain. 2014. PMID: 25351739 Free PMC article.
-
Mechanisms of Glucocerebrosidase Dysfunction in Parkinson's Disease.J Mol Biol. 2023 Jun 15;435(12):168023. doi: 10.1016/j.jmb.2023.168023. Epub 2023 Feb 23. J Mol Biol. 2023. PMID: 36828270 Free PMC article. Review.
-
Parkinson's disease: acid-glucocerebrosidase activity and alpha-synuclein clearance.J Neurochem. 2016 Oct;139 Suppl 1:198-215. doi: 10.1111/jnc.13517. Epub 2016 Feb 10. J Neurochem. 2016. PMID: 26860955 Review.
Cited by
-
A role for α-Synuclein in axon growth and its implications in corticostriatal glutamatergic plasticity in Parkinson's disease.Mol Neurodegener. 2020 Mar 30;15(1):24. doi: 10.1186/s13024-020-00370-y. Mol Neurodegener. 2020. PMID: 32228705 Free PMC article.
-
Physiological roles of α-synuclein serine-129 phosphorylation - not an oxymoron.Trends Neurosci. 2024 Jul;47(7):480-490. doi: 10.1016/j.tins.2024.05.005. Epub 2024 Jun 10. Trends Neurosci. 2024. PMID: 38862330 Free PMC article. Review.
-
Glucocerebrosidase and its relevance to Parkinson disease.Mol Neurodegener. 2019 Aug 29;14(1):36. doi: 10.1186/s13024-019-0336-2. Mol Neurodegener. 2019. PMID: 31464647 Free PMC article. Review.
-
Past, present, and future of Parkinson's disease: A special essay on the 200th Anniversary of the Shaking Palsy.Mov Disord. 2017 Sep;32(9):1264-1310. doi: 10.1002/mds.27115. Mov Disord. 2017. PMID: 28887905 Free PMC article. Review.
-
Cross-talks among GBA mutations, glucocerebrosidase, and α-synuclein in GBA-associated Parkinson's disease and their targeted therapeutic approaches: a comprehensive review.Transl Neurodegener. 2021 Jan 15;10(1):4. doi: 10.1186/s40035-020-00226-x. Transl Neurodegener. 2021. PMID: 33446243 Free PMC article. Review.
References
-
- Spillantini MG, Schmidt ML, Lee VM, Trojanowski JQ, Jakes R, Goedert M (1997) Alpha-synuclein in Lewy bodies. Nature 388: 839–840. - PubMed
Publication types
MeSH terms
Substances
Grants and funding
LinkOut - more resources
Full Text Sources
Other Literature Sources
Medical
Miscellaneous
