. 2015 Sep;18(9):1281-1290.
doi: 10.1038/nn.4074. Epub 2015 Jul 27.

Determinants of different deep and superficial CA1 pyramidal cell dynamics during sharp-wave ripples

Affiliations

Determinants of different deep and superficial CA1 pyramidal cell dynamics during sharp-wave ripples

Manuel Valero et al. Nat Neurosci. 2015 Sep.

Abstract

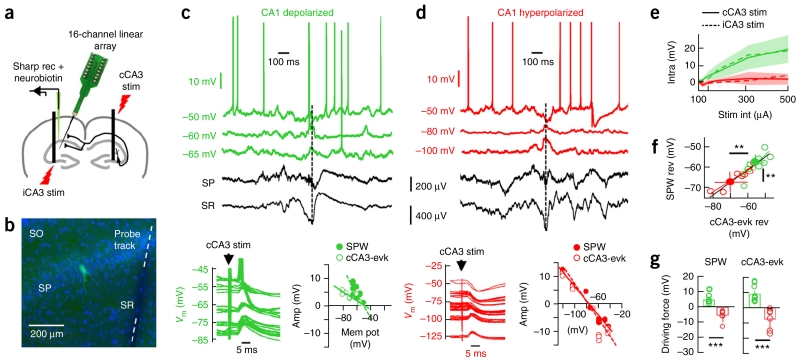
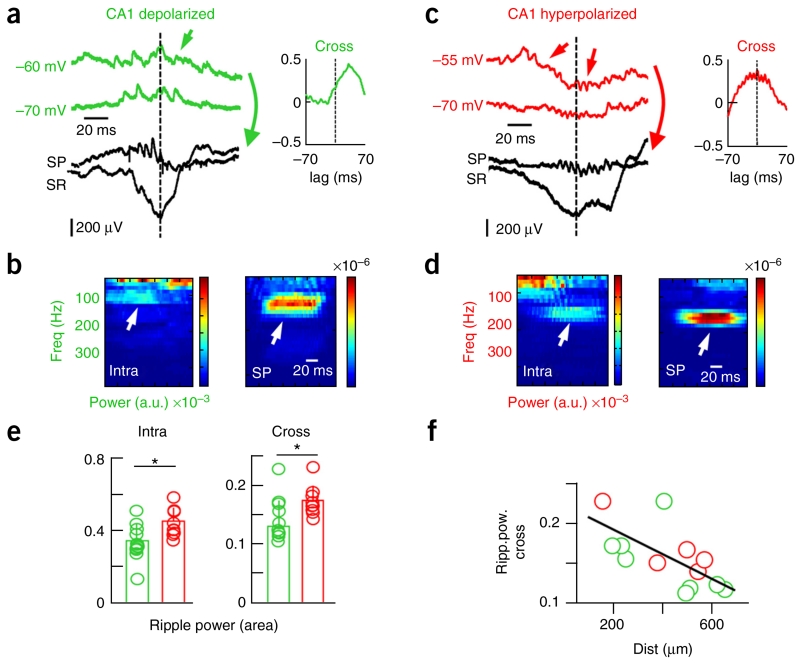
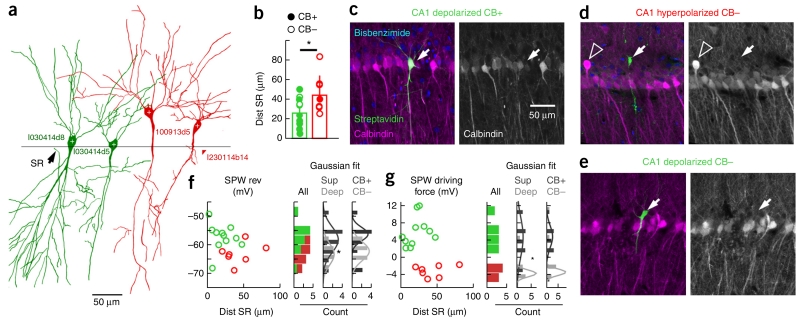
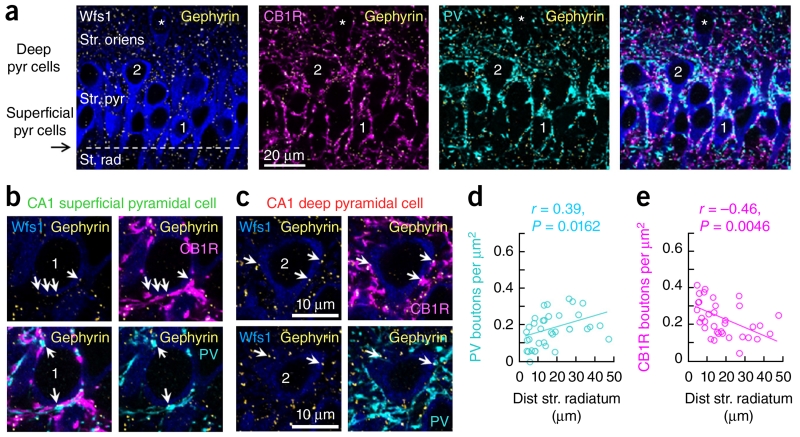
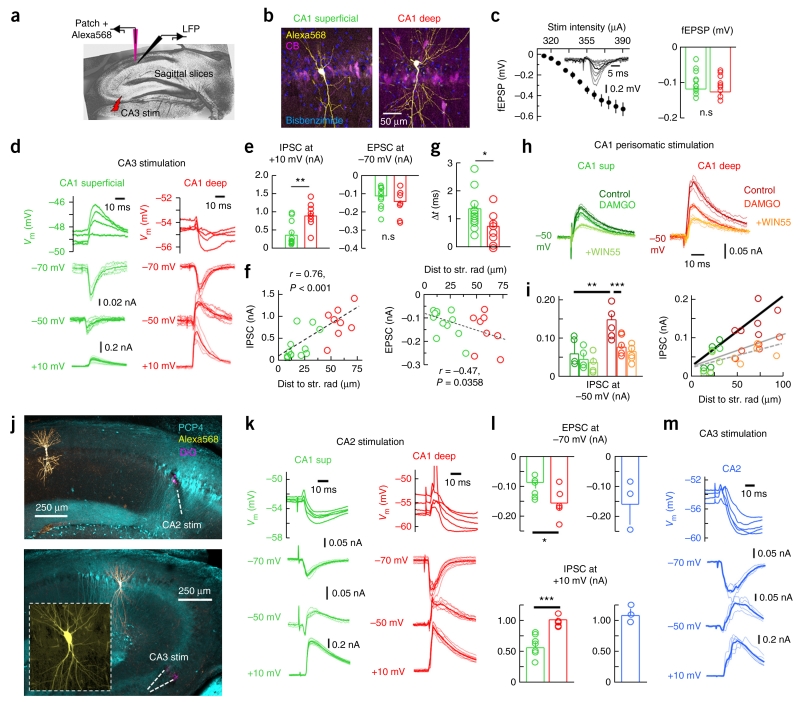
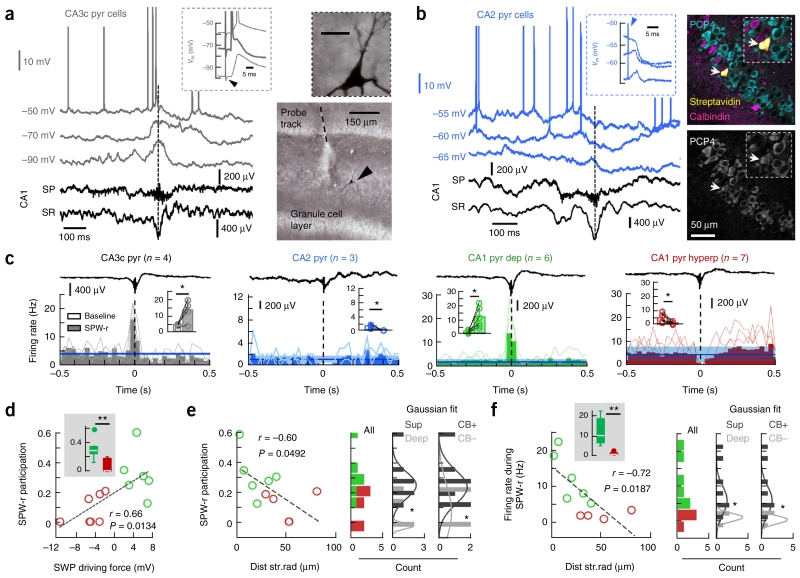
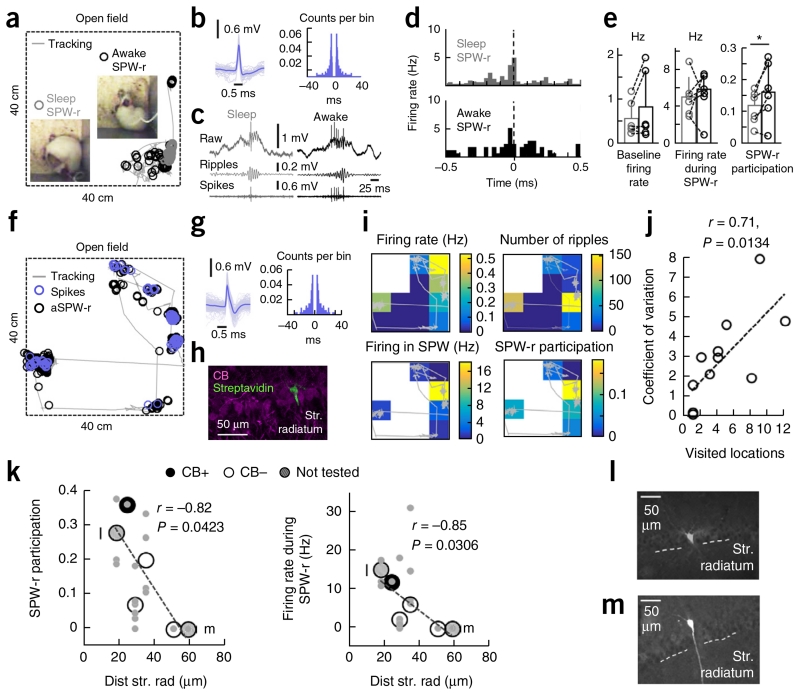
Sharp-wave ripples represent a prominent synchronous activity pattern in the mammalian hippocampus during sleep and immobility. GABAergic interneuronal types are silenced or fire during these events, but the mechanism of pyramidal cell (PC) participation remains elusive. We found opposite membrane polarization of deep (closer to stratum oriens) and superficial (closer to stratum radiatum) rat CA1 PCs during sharp-wave ripples. Using sharp and multi-site recordings in combination with neurochemical profiling, we observed a predominant inhibitory drive of deep calbindin (CB)-immunonegative PCs that contrasts with a prominent depolarization of superficial CB-immunopositive PCs. Biased contribution of perisomatic GABAergic inputs, together with suppression of CA2 PCs, may explain the selection of CA1 PCs during sharp-wave ripples. A deep-superficial gradient interacted with behavioral and spatial effects to determine cell participation during sleep and awake sharp-wave ripples in freely moving rats. Thus, the firing dynamics of hippocampal PCs are exquisitely controlled at subcellular and microcircuit levels in a cell type-selective manner.


Figures

Figure 1
Figure 1
Heterogeneous responses of dorsal CA1 PCs during SPW ripples in vivo. (a) Summary of the experimental approach. CA1 PCs impaled with sharp pipettes were recorded simultaneously to local field potentials using 16-channel silicon probes in urethane anesthetized rats. cCA3 and iCA3 stimulation were applied to evaluate cell responses. (b) Subsequent morphological analysis allowed for evaluation of cell identity (green) and distance to probe track. Blue is bisbenzimide. (c) Representative CA1 PC exhibiting net depolarization during SPW ripples recorded at the stratum radiatum (SR) and pyramidale (SP). A discontinuous line marks the SPW peak used for alignment. Responses to cCA3 stimulation are shown at bottom (left), and the reversal potential estimation of the SPW-associated and cCA3-evoked (cCA3-evk) response are shown on the right. (d) Data are presented as in c for a representative hyperpolarized PC. (e) Group difference of input/output responses of hyperpolarized (red) and depolarized (green) cells to contralateral (solid; n = 7 red, n = 11 green) and ipsilateral (discontinuous; n = 4 red, n = 4 green) CA3 stimulation. Lines reflect mean values. s.d. values for iCA3 stimulation are shadowed. (f) Reversal potential of SPW- and cCA3-evoked responses were tightly correlated (P < 0.0001, r(16) = 89.25; Pearson correlation), but different between groups (SPW-reversal: P = 0.0041, t(19) = 3.27; cCA3-evoked reversal: P = 0.0067, t(16) = 3.11; n = 11 depolarized, n = 7 hyperpolarized cells; unpaired t test). Solid circles represent group mean ± s.d. (g) Significant group differences for SPW- (left, P < 0.0001) and cCA3-evoked driving forces (P < 0.0001). **P < 0.005, ***P < 0.0001.
Figure 2
Figure 2
Different correlation between intracellular and extracellular ripples in depolarized and hyperpolarized CA1 PCs. (a) Representative synaptic activity during SPW ripples in depolarized cells. (b) Time frequency spectrum of intracellular sweeps (green, arrows in a) suggested a contribution to the ripple frequency band simultaneously with the extracellular ripple recorded at the stratum pyramidale (black, SP). A cross-correlation analysis revealed coherent high-frequency oscillations between the intracellular and the extracellular ripple (shown at right in a). (c) Data are presented as in a for a representative hyperpolarized PC. (d) Data are presented as in b for the sweeps shown in c (arrows). (e) Group data of the mean ripple power confirmed stronger intracellular rhythmicity (P = 0.0124, t(19) = −2.8, left) and intra-extra ripple cross-correlation (P = 0.0147, t(19) = −2.7, right) in hyperpolarized (n = 12) versus depolarized (n = 9) cells. (f) Relationship between intra-extra ripple cross-correlation and the recording distance between the cell and the 16-channel probe (P = 0.0137, r(12) = −0.6401; Pearson correlation). *P < 0.05.
Figure 3
Figure 3
Identity of depolarized and hyperpolarized CA1 PCs. (a) Camera lucida drawing of DAB-revealed cells (1 section, 70 μm, 40×). The border between strata pyramidale and radiatum (line) was identified. (b) Group differences in the distance to stratum radiatum (SR, P = 0.0152, t(16) = −2.72; green, n = 11 depolarized; red, n = 7 hyperpolarized). CB immunoreactivity (CB+, filled dots) and the lack thereof (CB−, open) is indicated. (c) Example of a superficial depolarized CB+ cell (arrows) recorded close to radiatum and in the CB+ sublayer. Average intensity projection (five optical sections, 9.44 μm). (d) Example of a deep hyperpolarized CB− cell (arrows) located above the CB+ sublayer. Note the deep CB+ cells (open arrowhead, 12 optical sections, 11.88 μm). (e) Example of a deep depolarized CB− cell (arrow, 8 optical sections, 14.1 μm). (f) Relationship between the SPW-associated reversal potential and the cell distance to radiatum. Histograms for all cells without classification (individual counting from depolarized and hyperpolarized cells is visually identified) and classified according to location (deep/superficial) and immunoreactivity (CB+/CB−) are shown to the right. A Gaussian fit was tested (Shapiro-Wilk test) for deep (P = 0.9859, W = 0.99) and superficial (P = 0.9378, W = 0.97) PCs and means were significant different (P = 0.0405, t(16) = 1.86, unpaired t test). Differences did not reach significance for CB classification (CB+: P = 0.1394, W = 0.88; CB−: P = 0.8568, W = 0.96; P = 0.0923, t(16) = 1.38, unpaired t test, not significant). (g) Data are presented as in d for SPW-associated driving force values (deep: P = 0.0675, W = 0.81; superficial: P = 0.6691, W = 0.95; means were significantly different, P = 0.0135, rank sum = 140, Mann-Whitney; CB+: P = 0.2403, W = 0.91; CB−: P = 0.0113, W = 0.74; n.s.). *P < 0.05.
Figure 4
Figure 4
GABAergic perisomatic innervation of CA1 pyramidal cells. (a) Average intensity projection (five optical sections, 1.43 μm thick) of CA1 pyramidal cells immunoreactive for Wfs1 (blue). A typical superficial pyramidal cell close to the border with radiatum is marked 1. Cell 2 is a deep pyramidal cell. An example of oriens pyramidal cells (also counted as deep) is highlighted by an asterisk. Gephyrin immunolabeling allowed identification of GABAergic puncta (yellow). CB1R− (magenta) and PV-immunoreactive (cyan) terminals surrounded pyramidal cell somata and dendrites. (b) Superficial layer cell 1 from a (single 0.29-μm-thick optical section). Both PV (cyan) and CB1R (magenta) terminals were associated with gephyrin puncta (yellow, arrows) on the Wfs1-immunoreactive soma (blue). Top row, four gephyrin puncta and corresponding CB1R-immunoreactive terminals (arrows). Bottom row, two gephyrin puncta (arrows) associated with PV-immunoreactive terminals. (c) Data are presented as in b for deep layer cell 2 from b shown in single 0.29-μm-thick optical sections at two different depths. (d) Estimation of the density of PV+/gephyrin puncta over all Wfs1 pyramidal cells revealed a significant positive correlation with the distance to radiatum (n = 34 cells, 4 confocal stacks, n = 3 rats). (e) An opposite trend was found for CB1R+/gephyrin puncta in the same dataset.
Figure 5
Figure 5
Mechanisms of CA1 PC heterogeneity studied in vitro. (a) Schematic representation of in vitro experiments. (b) Classification of CA1 PCs as deep and superficial. Average intensity projection from three (7.66 μm, deep) and seven optical sections (19.86 μm, superficial). (c) Stimulation intensity (inset, radiatum field excitatory postsynaptic potentials (fEPSP)) was adjusted to obtain similar fEPSPs in slices used to evaluate deep (n = 8) and superficial cells (n = 12, P = 0.6831, right). (d) Representative current- and voltage-clamp responses of deep and superficial CA1 PCs to CA3 stimulation. (e) Stronger ISPCs were evoked in deep PCs at +10 mV (P = 0.0021, t(18) = −3.39; n = 8 deep, n = 12 superficial). EPSCs at −70 mV was not significant (P = 0.2221). (f) Correlation between the amplitude of IPSC (left) and EPSC (right) and distance to radiatum. (g) Group differences of onset timing between excitation and inhibition (P = 0.0431, t(18) = −2.18). (h) Evaluation of perisomatic stimulation responses in deep and superficial PCs. Representative responses to perfusion with the μ-opioid receptor antagonist DAMGO (200 nM) and the CB1R agonist WIN55,212 (5 μM). (i) IPSC amplitude measured at −50 mV in deep (n = 5) and superficial PCs (n = 4) in response to pharmacological interventions. **P = 0.0061, t(7) = −3.87; ***P = 0.0055, t(4) = 5.44. The relationship between the IPSC amplitude and the distance to radiatum (control, thick line, r = 0.86, P = 0.0012) was reduced by DAMGO (gray continuous line, r = 0.78, P = 0.0131) and remained non-significant after WIN55,212 (discontinuous line). (j) Confirmation of CA2 stimulation with DiO and PCP4 immunolabeling. Bottom, confirmation of CA2 PC identity. Images were taken at 10×. Inset, 40×. (k) Representative responses of deep and superficial CA1 PCs to CA2 stimulation. (l) Deep (n = 5) and superficial (n = 7) CA1 PC responses to CA2 stimulation (EPSCs: P = 0.0474, t(10) = −2.25; IPSCs: P = 0.0007, t(10) = 4.81). Right, similar data from CA2 cells in response to CA3 stimulation (blue, n = 3). (m) Responses of a representative CA2 pyramidal cell to CA3 stimulation. *P < 0.05, **P < 0.005, ***P < 0.0001.
Figure 6
Figure 6
Microcircuit control of SPW-associated responses in dorsal PCs in vivo. (a) Representative response of a CA3c PC during SPWs recorded in CA1 (discontinuous line). Inset, ortodromic and antidromic (thick line) responses to cCA3 stimulation (arrowhead). Right, cell identification with DAB reaction at 10× and 100× (inset, scale bar represents 20 μm). Note large spines (thorny excrescences). (b) Data are presented as in a for a representative CA2 PC. Right, validation with PCP4 immunolabeling (arrows, 3 optical sections, 2.92 μm). (c) Firing rate histograms (bin size of 30 ms) of PCs recorded along the cornu ammonis at resting membrane potentials are aligned by CA1 SPW ripples. Blue lines represent mean firing rate (s.d. is shadowed) as estimated from baseline (−500 to −400 ms). Insets, firing rate modulation before (baseline) and around SPW peak (60-ms window). CA3c: P = 0.0464, t(3) = −3.27, n = 4; CA2: P = 0.0441, t(2) = 3.13, n = 3; CA1 depolarized: P = 0.0173, t(5) = −3.49, n = 6; CA1 hyperpolarized cells: P = 0.0275, t(6) = 2.89, n = 7. (d) Relationship between cell participation of SPW ripples and the associated driving force for all CA1 PCs shown before. Inset, significant group differences (P = 0.0034, t(12) = 3.63). (e) SPW participation against the distance to radiatum in histologically confirmed PCs (n = 6 depolarized, n = 4 hyperpolarized). Right, histograms from unclassified cells (all) and classified according to location (deep/superficial) and immunoreactivity (CB+/CB−) tested against a Gaussian distribution (Shapiro-Wilk test). Deep: P = 0.1612, W = 0.82; superficial: P = 0.1609, W = 0.87; means are significantly different at P = 0.0431, t(8) = 2.35, unpaired t test. For CB+: P = 0.1749, W = 0.87; CB−: P = 0.060, W = 0.77; means are significantly different at P = 0.0302, t(8) = 2.146 for an unpaired t test, but not for a Mann-Whitney test. (f) Data are presented as in e for firing rate data. Shapiro-Wilk test for deep: P = 0.7804, W = 0.98; superficial: P = 0.5954, W = 0.93; means are significantly different at P = 0.043, t(8) = 1.94, unpaired t test. For CB+: P = 0.5954, W = 0.93; CB−: P = 0.7804, W = 0.98; means are significantly different at P = 0.043, t(8) = 1.94, unpaired t test. *P < 0.05, **P < 0.005, ***P < 0.0001.
Figure 7
Figure 7
CA1 PC participation during SPW ripples in drug-free conditions. (a) Single-cell recording of CA1 PCs and LFPs in freely moving rats enabled identification of activity patterns during sleep (gray) and awake (black) conditions. Insets, representative behavior. (b) Action potential waveform and firing autocorrelogram of the cell recorded from the rat shown in a. (c) Representative examples of sleep and awake SPW ripples. Ripples: 100–200-Hz filtered raw signal; spikes: high-pass signals at 300 Hz. (d) Firing rate histograms (30-ms bins) of the cell shown before for all SPW ripples recorded during sleep (221) and awake (60). (e) State-dependent effects were not significant for the baseline firing rate (P = 0.1887, t(5) = −1.52) or the firing rate during SWP ripples (P = 0.8661, t(5) = −0.18), but reached significance for SPW ripple participation (P = 0.0420, t(5) = −2.71; n = 6 CA1 PCs, 1 histologically confirmed). *P < 0.05. (f) Recordings obtained from freely moving rats also allowed us to examine spatial effects in awake SPW ripple participation (black). Spikes are shown in blue. (g) Spike waveform and autocorrelation of the cell recorded in f. (h) Juxtacellular labeling and post hoc identification of the cell in g confirmed it was a deep CB− PC (3 optical sections, 6 μm). (i) Spatial dependence of activity of cell shown in g. (j) Relationship between the coefficient of variation of the firing rate during awake SPW ripples and the number of visited locations (4 × 4) in the 40-cm × 40-cm arena (n = 11 cells, 6 histologically confirmed). (k–m) Participation (left) and firing rate (right) during SPW ripples against the distance to radiatum for histologically confirmed cells (n = 6). Values represent means for the entire recording session. Individual values during different states (awake, sleep) and spatial locations for each cell are shown in gray. Calbindin classification is shown, except for two not tested cells indicated in by letters and shown in l and m.

References

    1. Buzsáki G, Leung LWS, Vanderwolf CH. Cellular bases of hippocampal EEG in the behaving rat. Brain Res. 1983;287:139–171. - PubMed
    1. Skaggs WE, et al. EEG sharp waves and sparse ensemble unit activity in the macaque hippocampus. J. Neurophysiol. 2007;98:898–910. - PubMed
    1. Kamondi A, Acsády L, Buzsáki G. Dendritic spikes are enhanced by cooperative network activity in the intact hippocampus. J. Neurosci. 1998;18:3919–3928. - PMC - PubMed
    1. Csicsvari J, Hirase H, Mamiya A, Buzsáki G. Ensemble patterns of hippocampal CA3-CA1 neurons during sharp wave-associated population events. Neuron. 2000;28:585–594. - PubMed
    1. Ylinen A, et al. Sharp wave-associated high-frequency oscillation (200 Hz) in the intact hippocampus: network and intracellular mechanisms. J. Neurosci. 1995;15:30–46. - PMC - PubMed

Publication types