

Pneumococal Surface Protein A (PspA) Regulates Programmed Death Ligand 1 Expression on Dendritic Cells in a Toll-Like Receptor 2 and Calcium Dependent Manner
- PMID: 26214513
- PMCID: PMC4516265
- DOI: 10.1371/journal.pone.0133601
Pneumococal Surface Protein A (PspA) Regulates Programmed Death Ligand 1 Expression on Dendritic Cells in a Toll-Like Receptor 2 and Calcium Dependent Manner
Abstract
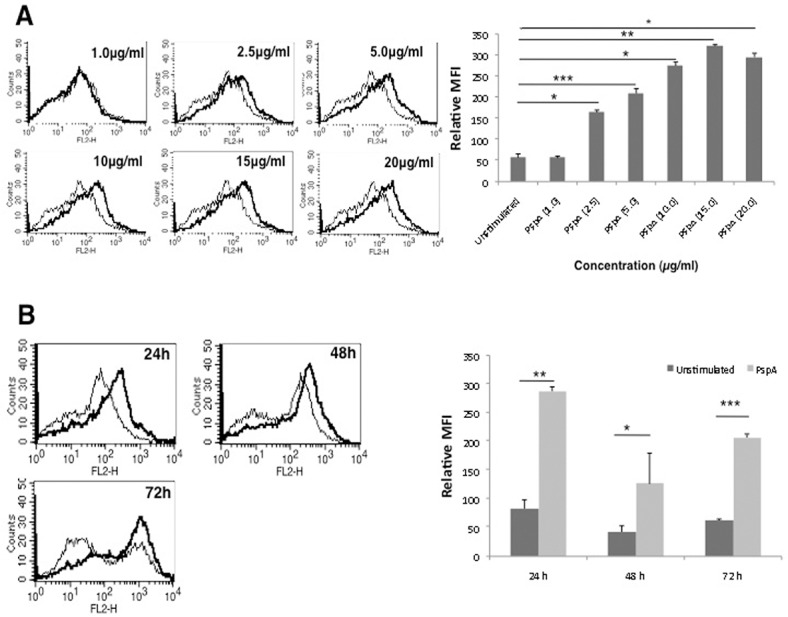
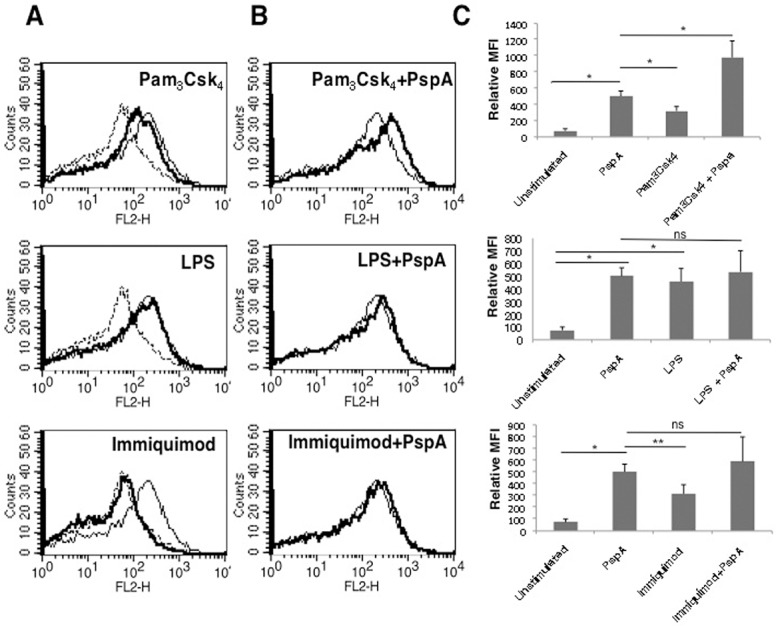
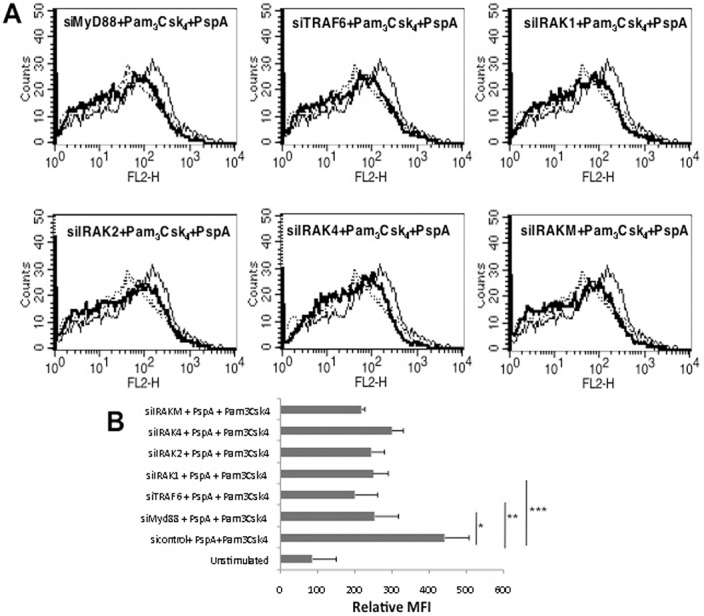
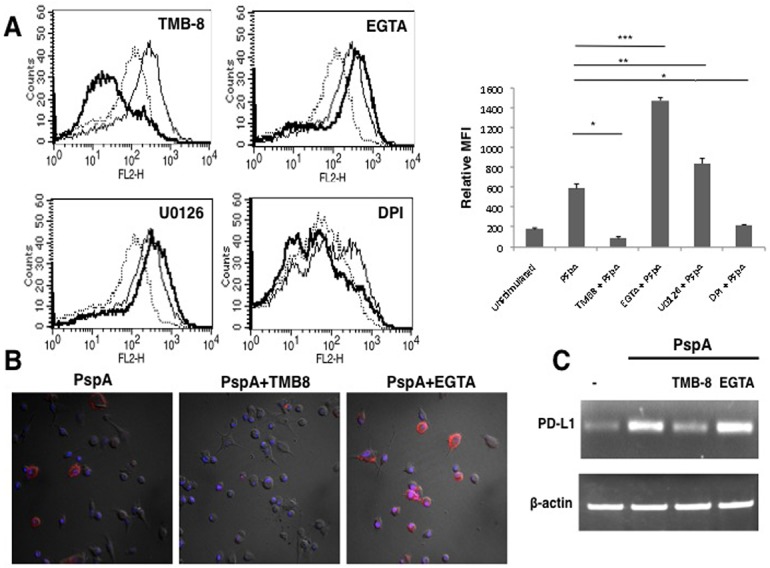
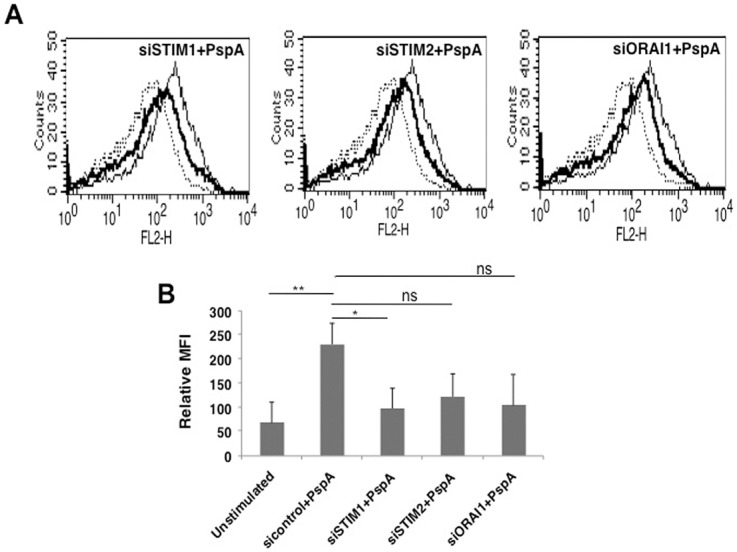
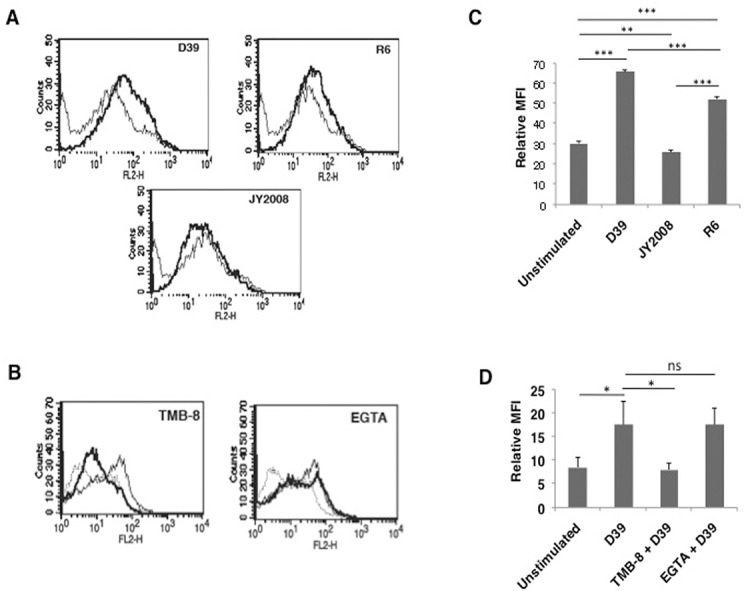
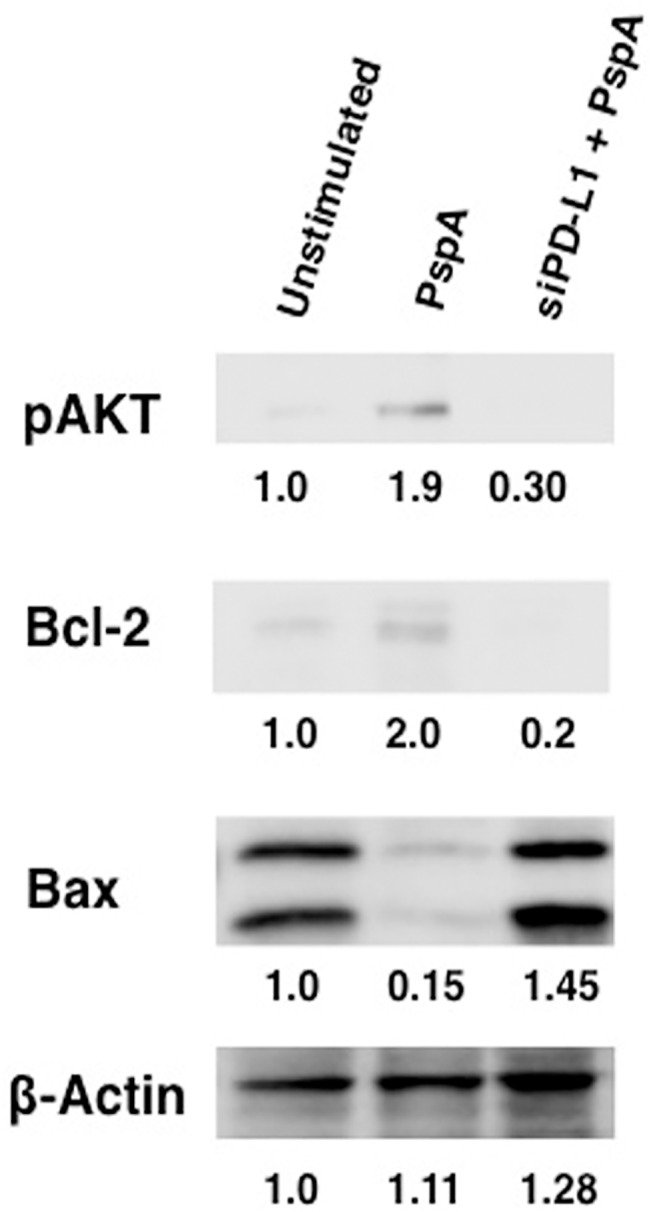
Pneumonia leads to high mortality in children under the age of five years worldwide, resulting in close to 20 percent of all deaths in this age group. Therefore, investigations into host-pathogen interactions during Streptococcus pneumoniae infection are key in devising strategies towards the development of better vaccines and drugs. To that end, in this study we investigated the role of S. pneumoniae and its surface antigen Pneumococcal surface protein A (PspA) in modulating the expression of co-stimulatory molecule Programmed Death Ligand 1 (PD-L1) expression on dendritic cells (DCs) and the subsequent effects of increased PD-L1 on key defence responses. Our data indicate that stimulation of DCs with PspA increases the surface expression of PD-L1 in a time and dose dependent manner. Characterization of mechanisms involved in PspA induced expression of PD-L1 indicate the involvement of Toll-Like Receptor 2 (TLR2) and calcium homeostasis. While calcium release from intracellular stores positively regulated PD-L1 expression, calcium influx from external milieu negatively regulated PD-L1 expression. Increase in PD-L1 expression, when costimulated with PspA and through TLR2 was higher than when stimulated with PspA or through TLR2. Further, knockdown of TLR2 and the intermediates in the TLR signaling machinery pointed towards the involvement of a MyD88 dependent pathway in PspA induced PD-L1 expression. Incubation of DCs with S. pneumoniae resulted in the up-regulation of PD-L1 expression, while infection with a strain lacking surface PspA failed to do so. Our data also suggests the role of PspA in ROS generation. These results suggest a novel and specific role for PspA in modulating immune responses against S. pneumoniae by regulating PD-L1 expression.
Conflict of interest statement
Figures
Similar articles
-
MyD88 signaling is not essential for induction of antigen-specific B cell responses but is indispensable for protection against Streptococcus pneumoniae infection following oral vaccination with attenuated Salmonella expressing PspA antigen.J Immunol. 2008 Nov 1;181(9):6447-55. doi: 10.4049/jimmunol.181.9.6447. J Immunol. 2008. PMID: 18941235 Free PMC article.
-
Morphine inhibits murine dendritic cell IL-23 production by modulating Toll-like receptor 2 and Nod2 signaling.J Biol Chem. 2011 Mar 25;286(12):10225-32. doi: 10.1074/jbc.M110.188680. Epub 2011 Jan 18. J Biol Chem. 2011. PMID: 21245149 Free PMC article.
-
Both innate immunity and type 1 humoral immunity to Streptococcus pneumoniae are mediated by MyD88 but differ in their relative levels of dependence on toll-like receptor 2.Infect Immun. 2005 Jan;73(1):298-307. doi: 10.1128/IAI.73.1.298-307.2005. Infect Immun. 2005. PMID: 15618166 Free PMC article.
-
Overexpression of programmed death ligand 1 in dendritic cells inhibits allogeneic lymphocyte activation in mice.J Surg Res. 2012 Aug;176(2):e79-87. doi: 10.1016/j.jss.2011.12.009. Epub 2011 Dec 30. J Surg Res. 2012. PMID: 22381170
-
Protective Immune Responses Elicited by Fusion Protein Containing PsaA and PspA Fragments.Immunol Invest. 2015;44(5):482-96. doi: 10.3109/08820139.2015.1037956. Immunol Invest. 2015. PMID: 26107747
Cited by
-
Emerging Bordetella pertussis Strains Induce Enhanced Signaling of Human Pattern Recognition Receptors TLR2, NOD2 and Secretion of IL-10 by Dendritic Cells.PLoS One. 2017 Jan 11;12(1):e0170027. doi: 10.1371/journal.pone.0170027. eCollection 2017. PLoS One. 2017. PMID: 28076445 Free PMC article.
-
Suppression of Protective Responses upon Activation of L-Type Voltage Gated Calcium Channel in Macrophages during Mycobacterium bovis BCG Infection.PLoS One. 2016 Oct 10;11(10):e0163845. doi: 10.1371/journal.pone.0163845. eCollection 2016. PLoS One. 2016. PMID: 27723836 Free PMC article.
-
Mycobacteria modulate SUMOylation to suppresses protective responses in dendritic cells.PLoS One. 2023 Sep 29;18(9):e0283448. doi: 10.1371/journal.pone.0283448. eCollection 2023. PLoS One. 2023. PMID: 37773921 Free PMC article.
References
-
- Bryce J, Boschi-Pinto C, Shibuya K, Black RE. WHO Child Health Epidemiology Reference Group. WHO estimates of the causes of death in children. Lancet. 2005; 365: 1147–1152. - PubMed
-
- Wardlaw T, Salama P, Johansson EW, Mason E. Pneumonia: the leading killer of children. Lancet. 2006; 368: 1048–1050. - PubMed
-
- World Health Organization. Pneumococcal conjugate vaccine for childhood immunization-WHO position paper. Wkly Epidemiol Rec. 2007; 82: 93–104. - PubMed
Publication types
MeSH terms
Substances
LinkOut - more resources
Full Text Sources
Other Literature Sources
Research Materials
