. 2015 Aug 3;125(8):3147-62.
doi: 10.1172/JCI81321. Epub 2015 Jul 27.

Macrophages mediate cardioprotective cellular postconditioning in acute myocardial infarction

Macrophages mediate cardioprotective cellular postconditioning in acute myocardial infarction

Geoffrey de Couto et al. J Clin Invest. .

Abstract

Ischemic injury in the heart induces an inflammatory cascade that both repairs damage and exacerbates scar tissue formation. Cardiosphere-derived cells (CDCs) are a stem-like population that is derived ex vivo from cardiac biopsies; they confer both cardioprotection and regeneration in acute myocardial infarction (MI). While the regenerative effects of CDCs in chronic settings have been studied extensively, little is known about how CDCs confer the cardioprotective process known as cellular postconditioning. Here, we used an in vivo rat model of ischemia/reperfusion (IR) injury-induced MI and in vitro coculture assays to investigate how CDCs protect stressed cardiomyocytes. Compared with control animals, animals that received CDCs 20 minutes after IR had reduced infarct size when measured at 48 hours. CDCs modified the myocardial leukocyte population after ischemic injury. Specifically, introduction of CDCs reduced the number of CD68+ macrophages, and these CDCs secreted factors that polarized macrophages toward a distinctive cardioprotective phenotype that was not M1 or M2. Systemic depletion of macrophages with clodronate abolished CDC-mediated cardioprotection. Using both in vitro coculture assays and a rat model of adoptive transfer after IR, we determined that CDC-conditioned macrophages attenuated cardiomyocyte apoptosis and reduced infarct size, thereby recapitulating the beneficial effects of CDC therapy. Together, our data indicate that CDCs limit acute injury by polarizing an effector macrophage population within the heart.


Figures

Figure 10
Figure 10. Adoptive transfer of MCDC macrophages reduces infarct size when administered 20 minutes following reperfusion.
(A) Schematic of infusion protocol. Rats underwent 45 minutes of ischemia, followed by 20 minutes of reperfusion prior to administration of PBS or DiI-labeled M1, M2, or MCDC macrophages. Analyses were performed 48 hours after IR injury. (B) Representative images of TTC-stained hearts treated with PBS or M1, M2, or MCDC macrophages. (C) Pooled data demonstrating percentage of infarct mass and LV viable mass, as assessed from TTC-stained hearts (n = 4–8 rats per group). (D) Representative image of the localization of DiI-labeled macrophages within the infarct border zone; no DiI-labeled macrophages were observed in the noninfarcted region. Scale bar: 50 μm. Graphs depict mean ± SEM. Statistical significance was determined using 1-way ANOVA followed by Tukey’s multiple comparisons test. *P < 0.05.
Figure 9
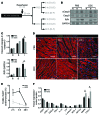
Figure 9. Coculture of MCDC macrophages with oxidatively stressed NRVMs preserves cardiomyocyte viability in vitro.
(A) Schematic of in vitro protocol. NRVMs were stressed with 50 μM H2O2 for 15 minutes, serum-free media was replaced for 20 minutes (to simulate reperfusion), and then DiO-labeled M1, M2, or MCDC macrophages were introduced to the NRVMs. After 6 hours, cells were collected for analyses (n = 3 per group). (B) Immunoblot of cocultured cells (M1, M2, or MCDC macrophages with H2O2-treated NRVMs) and NRVM positive and negative controls (with and without H2O2, respectively) after 6 hours of culture. The lanes for this blot were run on the same gel but were noncontiguous. (C) Representative images of TUNEL-stained (red) cocultures of M1, M2, or MCDC macrophages (green) with NRVMs (white). Scale bar: 50 μm. (D) Pooled quantitative analyses of TUNEL+ cardiomyocytes (CM) and viable nucleated cardiomyocytes from M1, M2, and MCDC cocultures. (E) Pooled data demonstrating increased macrophage numbers in M1 cocultures and increased TUNEL+ macrophages in M2 cocultures. Graphs depict mean ± SEM. Statistical significance was determined using 1-way ANOVA followed by Tukey’s multiple comparisons test. *P < 0.05.
Figure 8
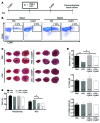
Figure 8. Polarization of BMDMs toward M1, M2, or MCDC phenotypes in vitro confers distinct surface marker expression and phagocytic capacity.
(A and B) Surface markers examined by flow cytometry depict reduced CD68, CD80, and CD86 expression and reduced size (forward scatter) on MCDC macrophages (n = 3 per group). (C and D) Representative flow cytometry histograms and pooled quantitative analysis of FITC fluorescent bead uptake among macrophage populations (n = 3 per group). Graphs depict mean ± SEM. Statistical significance was determined using 1-way ANOVA followed by Tukey’s multiple comparisons test. *P < 0.05.
Figure 7
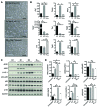
Figure 7. Polarization of BMDMs toward M1, M2, or MCDC phenotypes in vitro confers distinct cytokine gene expression and protein marker expression.
(A) Representative phase-contrast images of macrophages polarized toward M1 (IFN-γ/LPS), M2 (IL-4/IL-13), or MCDC (Transwell) phenotypes. Scale bar: 100 μm. (B) Gene expression profiles of macrophages polarized toward M1, M2, and MCDC phenotypes (n = 3 per group). These data reveal classical upregulation of markers in M1 (Nos2) and M2 (Arg1, Pparg, Nfkb1, and Tgfb1) macrophages, but with a distinct gene expression pattern in MCDC (Il10 and Il4ra) macrophages. (C and D) Protein expression of markers delineating M1 and M2 macrophages vs. MCDC macrophages (n = 3 per group). Graphs depict mean ± SEM. Statistical significance was determined using 1-way ANOVA followed by Tukey’s multiple comparisons test. *P < 0.05.
Figure 6
Figure 6. Cardiac macrophages isolated from CDC-treated animals have a distinct cytokine profile.
(A) Representative images and pooled quantitative analysis of CD68+ macrophages isolated from cardiac tissue of PBS- and CDC-treated animals 48 hours following MI. Immunohistochemistry reveals a purity level of >85% CD68 positivity following cardiac macrophage isolation (n = 3 rats per group). Scale bar: 10 μm. (B) Gene expression profile from cardiac macrophages isolated from infarcted hearts after 48 hours. CDC-treated hearts have cardiac macrophages with reduced M1 (Tnf, Nos2, Il1a, and Il1b), but no change in M2 (Arg1, Tgfb1, Il10, and Pparg), macrophage gene expression. Graphs depict mean ± SEM. Statistical significance was determined using 2-way ANOVA followed by Bonferroni’s or Sidak’s multiple comparisons test. *P < 0.05. Mϕ, macrophage.
Figure 5
Figure 5. Systemic depletion of endogenous macrophages reduces the efficacy of CDC therapy.
(A) Schematic depicting the macrophage depletion protocol using Cl2MDP liposomes. Animals were treated with an intravenous infusion of Cl2MDP 1 day prior to, and one day following, IR and then assessed 48 hours following IR. (B) Representative flow cytometry plots of the CD45+CD68+ population in the spleens and blood from Cl2MDP- and PBS-treated animals (n = 5 rats per group). (C) Representative TTC-stained hearts from Cl2MDP- and PBS-treated animals 48 hours after IR. (D) Clodronate treatment led to trends toward an increase in infarct mass and (E) reduction in cardiac ejection fraction in both PBS- and CDC-treated animals relative to their untreated controls (n = 4–7 rats per group). Preischemia measurements were acquired prior to Cl2MDP treatment. Graphs depict mean ± SEM. Statistical significance was determined using Student’s t test and 1-way ANOVA followed by Bonferroni’s multiple comparisons test. *P < 0.05.
Figure 4
Figure 4. CDC-treated animals have a reduced CD68+ macrophage population 48 hours after IR.
(A) Gating strategy for leukocyte identification within the infarcted myocardium prior to subset analysis. CD45+ cells were first identified (FSC-A/CD45+), and then dead cells were excluded (DAPI). (B) Pooled flow cytometry data from infarcted rat tissue reveal a reduced CD68+ population in CDC- vs. PBS-treated hearts (n = 4 rats per group). (C) Immunohistochemical staining of hearts within the infarct zone from CDC- and PBS-treated animals at 2, 6, and 48 hours after IR (n = 4 rats per group). Scale bar: 50 μm. (D) Pooled data from CD68+ cells within the infarct tissue from C at 2, 6, and 48 hours after IR (n = 4 rats per group). (E) Concentration of cytokines MCP-1 (CCL2) and IL-4 in sera 48 hours after IR (n = 4–8 rats per group). Graphs depict mean ± SEM. Statistical significance was determined using Student’s t test and 2-way ANOVA followed by Bonferroni’s multiple comparisons test. *P < 0.05.
Figure 3
Figure 3. Infusion of CDCs after IR reduces cardiomyocyte death and alters tissue proinflammatory cytokine expression.
(A) Schematic of infusion and tissue harvest protocol. Animals underwent 45 minutes of ischemia, followed by 20 minutes of reperfusion prior to PBS or CDC delivery. Animals were sacrificed for analyses after 2, 6, or 48 hours of IR injury. (B) Representative protein immunoblots of cleaved caspase-3, caspase-3, RIP1, and GAPDH from the normal (N), border (B), and infarct (I) zones of hearts treated with PBS or CDCs. (C) Pooled data from immunoblots, including those in B, reveal a reduction in caspase-3 activation and RIP1 expression levels in the infarct region of CDC-treated hearts (n = 3–4 rats per group). (D) Representative images of TUNEL-stained heart tissue from the infarct zones of PBS- and CDC-treated hearts. Scale bar: 50 μm. (E) Quantitative assessment of cardiomyocytes in D and in similar images reveals reduced TUNEL positivity in CDC-treated hearts at all time points (n = 3–4 rats per group). (F) Protein cytokine expression of MMP8 and CXCL7 is elevated in the infarct zone of hearts treated with CDCs (n = 3–4 rats per group). Graphs depict mean ± SEM. Statistical significance was determined using either 1-way or 2-way ANOVA followed by Bonferroni’s multiple comparisons test. *P < 0.05.
Figure 2
Figure 2. The acute cardioprotective effect of CDCs is sustained for at least 2 weeks following IR.
(A) Schematic of infusion protocol. Rats underwent 45 minutes of ischemia, followed by 20 minutes of reperfusion before infusion of CDCs or PBS control. Animals were followed for 2 weeks. (B) Representative echocardiography long-axis images of the LV cavity during diastole and systole from PBS- and CDC-treated animals. (C) Masson’s trichrome staining of infarcted hearts from PBS- and CDC-treated animals. Scale bar: 2 mm. (D) Pooled data from Masson’s trichrome–stained hearts in C reveal less infarct thinning in CDC-treated animals (n = 4–5 rats per group). (E) Immunohistochemical staining of cardiomyocytes in the contralateral infarct zone. Cell size was determined from cardiomyocytes (α-actinin plus wheat-germ agglutinin [WGA]) with centrally localized nuclei (DAPI). Scale bar: 50 μm. (F) Pooled data from analyses in E depicting a reduction in cardiomyocyte size in CDC-treated animals (n = 5–7 rats per group). Graphs depict mean ± SEM. Statistical significance was determined using Student’s t test and 2-way ANOVA followed by Bonferroni’s multiple comparisons test. *P < 0.05.
Figure 1
Figure 1. CDCs confer cardioprotection to the ischemic myocardium within 20 minutes of reperfusion.
(A) Schematic of infusion protocol. Rats underwent 45 minutes of ischemia, followed by either 20 minutes or 120 minutes (delayed injection) of reperfusion prior to infusion of CDCs (5 × 10⁵ cells per 100 μl) or PBS control (100 μl) into the LV cavity during aortic cross-clamp. Animals were assessed 48 hours later. (B) Ejection fraction, as measured by echocardiography, was significantly preserved in CDC-treated animals at 48 hours with a 20-minute, but not a 120-minute, delay of infusion (n = 4–5 rats per group). FAC, fractional area of change. (C) Representative TTC-stained hearts from animals at 48 hours following IR injury. (D) Quantitative measurements of TTC-stained hearts, depicted as percentage of infarct mass, infarct mass, LV mass, and LV viable mass (n = 5–6 rats per group). (E) Representative images of gentian violet– and TTC-stained hearts isolated from rats 48 hours following treatment with PBS or CDCs (5 × 10⁵) and (F) quantitative analysis of the AAR (black line), infarct area (gray line), and LV area of TTC-stained hearts (n = 6–7 rats per group). (G) Linear regression of percentage of infarct mass vs. AAR shows no significant interaction when analyzed for homogeneity of regressions (F = 0.23, P = 0.64) but a difference between adjusted means of infarct mass (F = 84.5, P < 0.001) by analysis of covariance. Graphs depict mean ± SEM. Statistical significance was determined using 1-way ANOVA followed by Bonferroni’s multiple comparisons test. *P < 0.05.

Comment in

References

    1. Frangogiannis NG. Regulation of the inflammatory response in cardiac repair. Circ Res. 2012;110(1):159–173. doi: 10.1161/CIRCRESAHA.111.243162. - DOI - PMC - PubMed
    1. Frangogiannis NG. The inflammatory response in myocardial injury, repair, and remodelling. Nat Rev Cardiol. 2014;11(5):255–265. doi: 10.1038/nrcardio.2014.28. - DOI - PMC - PubMed
    1. Entman ML, et al. Inflammation in the course of early myocardial ischemia. FASEB J. 1991;5(11):2529–2537. - PubMed
    1. Jordan JE, Zhao ZQ, Vinten-Johansen J. The role of neutrophils in myocardial ischemia-reperfusion injury. Cardiovasc Res. 1999;43(4):860–878. doi: 10.1016/S0008-6363(99)00187-X. - DOI - PubMed
    1. Simpson PJ, Lucchesi BR. Free radicals and myocardial ischemia and reperfusion injury. J Lab Clin Med. 1987;110(1):13–30. - PubMed

Publication types