

Observed emotion frequency versus intensity as predictors of socioemotional maladjustment
- PMID: 26214568
- PMCID: PMC4518545
- DOI: 10.1037/emo0000099
Observed emotion frequency versus intensity as predictors of socioemotional maladjustment
Abstract
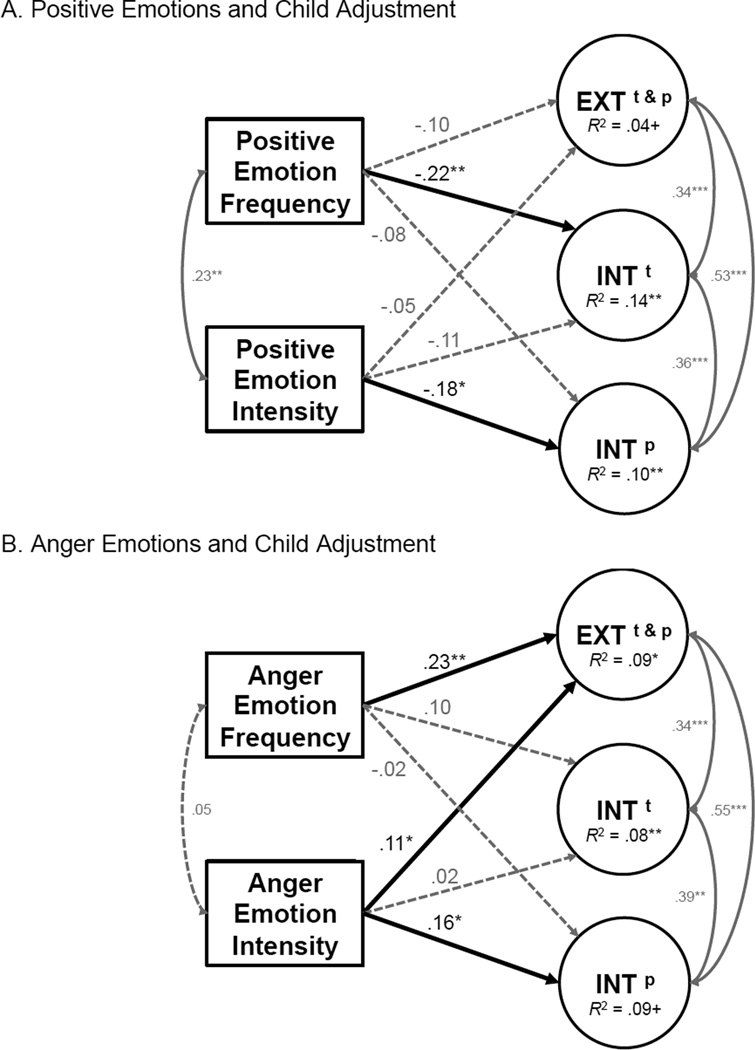
The purpose of this study was to assess whether observed emotional frequency (the proportion of instances an emotion was observed) and intensity (the strength of an emotion when it was observed) uniquely predicted kindergartners' (N = 301) internalizing and externalizing problems. Analyses were tested in a structural equation modeling (SEM) framework with data from multireporters (reports of problem behaviors from teachers and parents) and naturalistic observations of emotion in the fall semester. For observed positive emotion, both frequency and intensity negatively predicted parent- or teacher-reported internalizing symptoms. Anger frequency positively predicted parent- and teacher-reported externalizing symptoms, whereas anger intensity positively predicted parent- and teacher-reported externalizing and parent-reported internalizing symptoms. The findings support the importance of examining both aspects of emotion when predicting maladjustment.
(c) 2015 APA, all rights reserved).
Figures
Similar articles
-
Observed Emotions as Predictors of Quality of Kindergartners' Social Relationships.Soc Dev. 2017 Feb;26(1):21-39. doi: 10.1111/sode.12179. Epub 2016 Feb 16. Soc Dev. 2017. PMID: 29861553 Free PMC article.
-
Language for emotions in adolescents with externalizing and internalizing disorders.Dev Psychopathol. 2005 Spring;17(2):529-48. doi: 10.1017/s095457940505025x. Dev Psychopathol. 2005. PMID: 16761557
-
Psychopathology and short-term emotion: the balance of affects.J Child Psychol Psychiatry. 2000 May;41(4):463-72. J Child Psychol Psychiatry. 2000. PMID: 10836676
-
Internalizing and externalizing problems in adolescence: general and dimension-specific effects of familial loadings and preadolescent temperament traits.Psychol Med. 2005 Dec;35(12):1825-35. doi: 10.1017/S0033291705005829. Psychol Med. 2005. PMID: 16300695
-
Emotion regulation as a transdiagnostic factor in the development of internalizing and externalizing psychopathology: Current and future directions.Dev Psychopathol. 2016 Nov;28(4pt1):927-946. doi: 10.1017/S0954579416000638. Dev Psychopathol. 2016. PMID: 27739387 Review.
Cited by
-
Trait emotional intelligence and emotional experiences during the COVID-19 pandemic outbreak in Poland: A daily diary study.Pers Individ Dif. 2021 Jan 1;168:110348. doi: 10.1016/j.paid.2020.110348. Epub 2020 Aug 20. Pers Individ Dif. 2021. PMID: 32843781 Free PMC article.
-
Observed Emotions as Predictors of Quality of Kindergartners' Social Relationships.Soc Dev. 2017 Feb;26(1):21-39. doi: 10.1111/sode.12179. Epub 2016 Feb 16. Soc Dev. 2017. PMID: 29861553 Free PMC article.
-
Language Proficiency, Parenting Styles, and Socioemotional Adjustment of Young Dual Language Learners.J Cross Cult Psychol. 2019 Aug;50(7):896-914. doi: 10.1177/0022022119867394. Epub 2019 Aug 6. J Cross Cult Psychol. 2019. PMID: 31543546 Free PMC article.
-
Balance in Positive Emotional Expressivity Across School Contexts Relates to Kindergarteners' Adjustment.Early Educ Dev. 2018;29(1):1-13. doi: 10.1080/10409289.2017.1364946. Epub 2017 Sep 6. Early Educ Dev. 2018. PMID: 29795975 Free PMC article.
-
Examining the Impact of Virtual Animal Stimuli on College Students' Affect and Perception of their Academic Advising Experience.Animals (Basel). 2023 May 1;13(9):1522. doi: 10.3390/ani13091522. Animals (Basel). 2023. PMID: 37174559 Free PMC article.
References
-
- American Psychiatric Association. Diagnostic and statistical manual of mental disorders. 5th ed. Arlington, VA: American Psychiatric Association; 2013.
-
- Armstrong JM, Goldstein LH. Manual for the MacArthur health and behavior questionnaire (HBQ 1.0) MacArthur Foundation Research Network on Psychopathology and Development; 2003.
-
- Clark LA, Watson D. Tripartite model of anxiety and depression: Psychometric evidence and taxonomic implications. Journal of Abnormal Psychology. 1991;100:316–336. - PubMed
-
- Cole DA, Truglio R, Peeke L. Relation between symptoms of anxiety and depression in children: A multitrait-multimethod-multigroup assessment. Journal of Consulting and Clinical Psychology. 1997;65:110–119. - PubMed
-
- Denham SA, Bassett HH, Thayer SK, Mincic MS, Sirotkin YS, Zinsser K. Observing preschoolers’ social-emotional behavior: Structure, foundations, and prediction of early school success. The Journal of Genetic Psychology. 2012;173:246–278. - PubMed
Publication types
MeSH terms
Grants and funding
LinkOut - more resources
Full Text Sources
Other Literature Sources
Medical
