. 2015 Sep;47(9):1073-8.
doi: 10.1038/ng.3363. Epub 2015 Jul 27.

Chimeric EWSR1-FLI1 regulates the Ewing sarcoma susceptibility gene EGR2 via a GGAA microsatellite

Affiliations

Chimeric EWSR1-FLI1 regulates the Ewing sarcoma susceptibility gene EGR2 via a GGAA microsatellite

Thomas G P Grünewald et al. Nat Genet. 2015 Sep.

Abstract

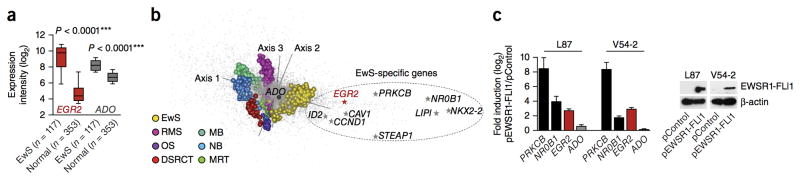
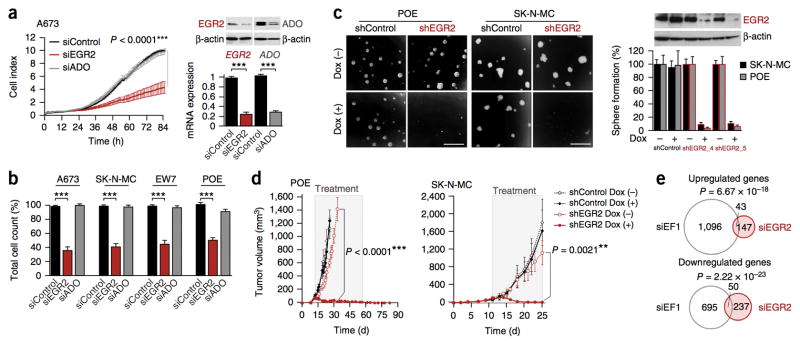
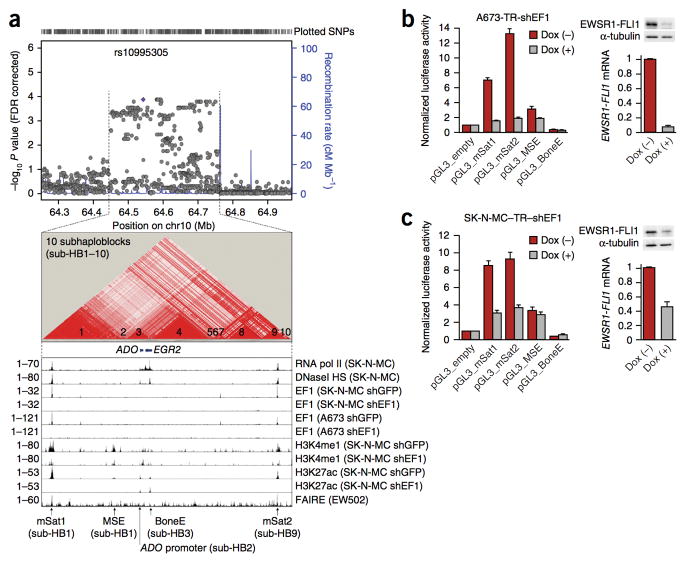
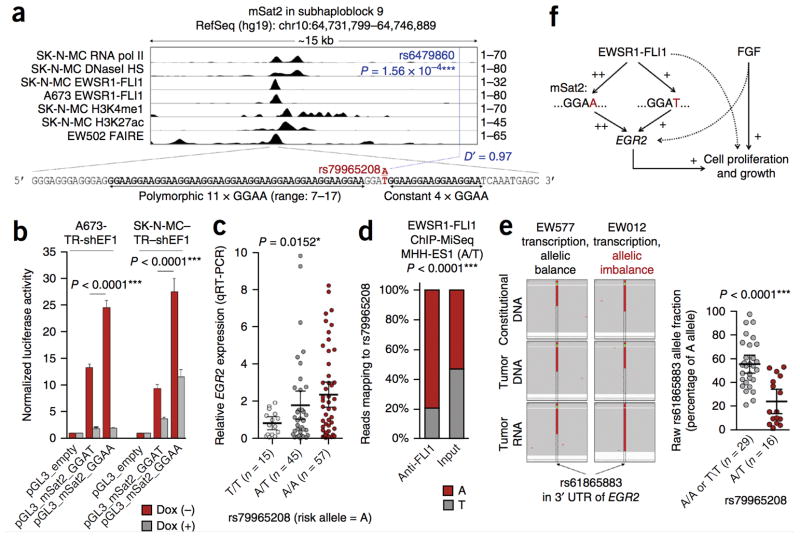
Deciphering the ways in which somatic mutations and germline susceptibility variants cooperate to promote cancer is challenging. Ewing sarcoma is characterized by fusions between EWSR1 and members of the ETS gene family, usually EWSR1-FLI1, leading to the generation of oncogenic transcription factors that bind DNA at GGAA motifs. A recent genome-wide association study identified susceptibility variants near EGR2. Here we found that EGR2 knockdown inhibited proliferation, clonogenicity and spheroidal growth in vitro and induced regression of Ewing sarcoma xenografts. Targeted germline deep sequencing of the EGR2 locus in affected subjects and controls identified 291 Ewing-associated SNPs. At rs79965208, the A risk allele connected adjacent GGAA repeats by converting an interspaced GGAT motif into a GGAA motif, thereby increasing the number of consecutive GGAA motifs and thus the EWSR1-FLI1-dependent enhancer activity of this sequence, with epigenetic characteristics of an active regulatory element. EWSR1-FLI1 preferentially bound to the A risk allele, which increased global and allele-specific EGR2 expression. Collectively, our findings establish cooperation between a dominant oncogene and a susceptibility variant that regulates a major driver of Ewing sarcomagenesis.


Conflict of interest statement

Competing financial interests

The authors declare no competing financial interests.

Figures

Figure 1
Figure 1. EGR2 overexpression is mediated by EWSR1-FLI1
(a) EGR2 and ADO expression levels in Ewing sarcoma (EwS, GSE34620) and normal tissues (GSE3526). The normal-body atlas consists of 353 microarrays representing 63 individual tissue types (Supplementary Fig. 1). Data are shown as medians (horizontal bars) with ranges for the 25th–75th percentile (box) and 10th–90th percentile (whiskers). P values determined via two-tailed unpaired Student’s t-test with Welch’s correction. (b) Between-group analysis. Genes (gray dots) and tumor samples (colored spheres) are separated along three axes. EwS, Ewing sarcoma (n = 279); RMS, rhabdomyosarcoma (n = 121); OS, osteosarcoma (n = 25); DSRCT, desmoplastic small-round-cell tumor (n = 32); MB, medulloblastoma (n = 52); NB, neuroblastoma (n = 64); MRT, malignant rhabdoid tumor (n = 35). The main genes specifically overexpressed in Ewing sarcoma are indicated. (c) Quantitative real-time PCR analysis of EGR2 and ADO expression in human MSC lines L87 and V54-2 after ectopic EWSR1-FLI1 expression (pEWSR1-FLI1) as compared with empty vector (pControl). Data are shown as the mean and s.e.m.; n ≥ 9 independent experiments. The EWSR1-FLI1-targets NR0B1 and PRKCB served as positive controls,. EWSR1-FLI1 expression was confirmed by immunoblot (loading control: β-actin).
Figure 2
Figure 2. EGR2 is critical for the growth and tumorigenicity of Ewing sarcoma
(a) xCELLigence proliferation kinetics of A673 cells. Data shown are the mean ± s.e.m. of results obtained with two different siRNAs against EGR2 and three different siRNAs against ADO; n ≥ 6 technical replicates. EGR2 or ADO knockdown was confirmed at 48 h by quantitative real-time PCR (mean ± s.e.m., n ≥ 4 independent experiments) and immunoblot (loading control: β-actin). (b) Validation of xCELLigence results by cell counting (including supernatant) 96 h after transfection of A673, SK-N-MC, EW7 and POE cells. Data are mean and s.e.m. of results obtained with two different siRNAs against EGR2 and three different siRNAs against ADO; n ≥ 3 independent experiments. (c) Left, phase-contrast images of sphere-formation assays (scale bars, 1 mm). Right, mean and s.e.m. of n ≥ 3 independent experiments performed with SK-N-MC and POE containing a doxycycline-inducible shRNA against EGR2 (shEGR2_4 or shEGR2_5). Also shown is a representative EGR2 immunoblot for POE cells (96-h doxycycline treatment; loading control, β-actin). (d) Growth curves for subcutaneously xenografted POE or SK-N-MC cells (shControl and shEGR2_4). When tumors reached a volume of 75–100 mm3, doxycycline and sucrose (Dox +) or sucrose alone (Dox −) was added to the drinking water (treatment). Mean ± s.e.m.; n ≥ 6 mice per group. P values determined via two-tailed unpaired Student’s t-test. (e) Size-proportional Venn diagrams of up- and downregulated genes 48 h after knockdown of EWSR1-FLI1 (siEF1) or EGR2 (siEGR2) in A673 and SK-N-MC cells (minimum log2 fold change ± 0.5, Benjamini-Hochberg–corrected P < 0.05). Fisher’s exact test.
Figure 3
Figure 3. Fine-mapping and epigenetic profiling revealed candidate EGR2 regulatory elements
(a) Top, Manhattan plot of 1,440 SNPs identified by targeted deep sequencing within the chr10 susceptibility locus and flanking haplotype blocks. rs10995305 was the most significant SNP associated with Ewing sarcoma at this locus (false discovery rate (FDR)-corrected P = 1.27 × 10⁻⁴). The blue lines indicate the recombination-rate estimates from the HapMap project. Middle, LD plot of the chr10 susceptibility locus hotspot (chr10:64,449,549–64,756,872) based on the analysis of 290 significantly Ewing sarcoma–associated SNPs in 343 affected subjects (a subset of the original GWAS cohort) and 251 controls. Bottom, epigenetic profile of the chr10 susceptibility locus hotspot in the Ewing sarcoma cell lines SK-N-MC, A673 and EW502. Displayed are signals from published ChIP-Seq or DNase-Seq data for RNA polymerase II (pol II), DNaseI hypersensitivity (HS), as well as EWSR1-FLI1 (EF1), H3K4me1 and H3K27ac in Ewing sarcoma cells transfected with either a control shRNA (shGFP) or a specific shRNA against EWSR1-FLI1 (shEF1), and FAIRE,,. The read count is given on the left. mSat1 and mSat2 are GGAA microsatellites (Supplementary Fig. 8). (b,c) Normalized luciferase reporter signals in A673-TR-shEF1 and SK-N-MC-TR-shEF1 cells containing a doxycycline-inducible shRNA against EWSR1-FLI1. EWSR1-FLI1 knockdown was confirmed by quantitative real-time PCR and immunoblot (loading control: α-tubulin). Data are shown as means and s.e.m.; n ≥ 5 independent experiments.
Figure 4
Figure 4. Germline variation at mSat2 modulates EWSR1-FLI1-dependent EGR2 expression
(a) Coordinates, epigenetic profile and sequence of the mSat2 locus. Consistent with previous studies, H3K4me1 and H3K27ac signals peaked adjacent to the repetitive GGAA mSat,. The P value reported for rs6479860 reflects the significance of its association with Ewing sarcoma. (b) Luciferase reporter signals of mSat2 with the T or A allele at rs79965208. Data are mean and s.e.m.; n ≥ 6 independent experiments. P values determined via two-tailed unpaired Student’s t-test. (c) EGR2 expression measured by quantitative real-time PCR in 117 Ewing samples (103 primary tumors and 14 cell lines). EGR2 expression was normalized to that of RPLP0 and is displayed as expression relative to that of the median sample (set as 1). Horizontal bars represent means, and whiskers represent the 95% confidence interval boundaries. P value determined via linear regression. (d) Allele fraction of reads mapping to rs79965208 generated in a ChIP-MiSeq experiment in the A/T Ewing cell line MHH-ES1 (Supplementary Fig. 10 and Supplementary Data). (e) Left, representative Integrative Genomics Viewer pile-up of reads covering the EGR2 3′ UTR rs61865883 in matched constitutional or tumor DNA and tumor-derived RNA. The sample EW012 exhibited transcriptional allelic imbalance of EGR2, whereas EW577 did not. Right, raw rs61865883 allele fractions of targeted RNA deep sequencing in 45 Ewing sarcomas heterozygous (A/T) for the transcribed EGR2 3′ UTR allelic marker rs61865883. Horizontal bars represent means, and whiskers show the 95% confidence interval boundaries. P values determined via parametric two-tailed Student’s t-test. (f) Regulatory model of EWSR1-FLI1 and mSat2 controlling EGR2 expression and proliferation of Ewing sarcoma cells in convergence with the FGF pathway.

Comment in

References

    1. Delattre O, et al. Gene fusion with an ETS DNA-binding domain caused by chromosome translocation in human tumors. Nature. 1992;359:162–165. - PubMed
    1. Gangwal K, et al. Microsatellites as EWS/FLI response elements in Ewing’s sarcoma. Proc Natl Acad Sci U S A. 2008;105:10149–10154. - PMC - PubMed
    1. Guillon N, et al. The oncogenic EWS-FLI1 protein binds in vivo GGAA microsatellite sequences with potential transcriptional activation function. PloS One. 2009;4:e4932. - PMC - PubMed
    1. Postel-Vinay S, et al. Common variants near TARDBP and EGR2 are associated with susceptibility to Ewing sarcoma. Nat Genet. 2012;44:323–327. - PubMed
    1. Von Levetzow C, et al. Modeling initiation of Ewing sarcoma in human neural crest cells. PloS One. 2011;6:e19305. - PMC - PubMed

Publication types

MeSH terms