. 2015 Sep;47(9):969-978.
doi: 10.1038/ng.3360. Epub 2015 Jul 27.

Analysis of mammalian gene function through broad-based phenotypic screens across a consortium of mouse clinics

Martin Hrabě de Angelis #  1   2   3 George Nicholson #  4 Mohammed Selloum #  5   6   7   8 Jacqui White #  9 Hugh Morgan #  10 Ramiro Ramirez-Solis #  9 Tania Sorg #  5   6   7   8 Sara Wells #  10 Helmut Fuchs #  1 Martin Fray #  10 David J Adams  9 Niels C Adams  9 Thure Adler  1   11 Antonio Aguilar-Pimentel  1   12 Dalila Ali-Hadji  5   6   7   8 Gregory Amann  5   6   7   8 Philippe André  5   6   7   8 Sarah Atkins  10 Aurelie Auburtin  5   6   7   8 Abdel Ayadi  5   6   7   8 Julien Becker  5   6   7   8 Lore Becker  1   13 Elodie Bedu  5   6   7   8 Raffi Bekeredjian  1   14 Marie-Christine Birling  5   6   7   8 Andrew Blake  10 Joanna Bottomley  9 Mike Bowl  10 Véronique Brault  15   6   7   8 Dirk H Busch  11 James N Bussell  9 Julia Calzada-Wack  16 Heather Cater  10 Marie-France Champy  5   6   7   8 Philippe Charles  5   6   7   8 Claire Chevalier  15   6   7   8 Francesco Chiani  17 Gemma F Codner  10 Roy Combe  5   6   7   8 Roger Cox  10 Emilie Dalloneau  15   6   7   8 André Dierich  5   6   7   8 Armida Di Fenza  10 Brendan Doe  17 Arnaud Duchon  15   6   7   8 Oliver Eickelberg  18 Chris T Esapa  10 Lahcen El Fertak  5   6   7   8 Tanja Feigel  10 Irina Emelyanova  10 Jeanne Estabel  9 Jack Favor  19 Ann Flenniken  20 Alessia Gambadoro  17 Lilian Garrett  21 Hilary Gates  10 Anna-Karin Gerdin  9 George Gkoutos  22 Simon Greenaway  10 Lisa Glasl  21 Patrice Goetz  5   6   7   8 Isabelle Goncalves Da Cruz  5   6   7   8 Alexander Götz  18 Jochen Graw  21 Alain Guimond  5   6   7   8 Wolfgang Hans  1 Geoff Hicks  23 Sabine M Hölter  21 Heinz Höfler  13 John M Hancock  10 Robert Hoehndorf  24 Tertius Hough  10 Richard Houghton  9 Anja Hurt  1 Boris Ivandic  1   14 Hughes Jacobs  5   6   7   8 Sylvie Jacquot  5   6   7   8 Nora Jones  20 Natasha A Karp  9 Hugo A Katus  1   14 Sharon Kitchen  10 Tanja Klein-Rodewald  16 Martin Klingenspor  1   25 Thomas Klopstock  1   13 Valerie Lalanne  5   6   7   8 Sophie Leblanc  5   6   7   8 Christoph Lengger  1 Elise le Marchand  5   6   7   8 Tonia Ludwig  1 Aline Lux  5   6   7   8 Colin McKerlie  26   27 Holger Maier  1 Jean-Louis Mandel  5   15   6   7   8 Susan Marschall  1 Manuel Mark  5   15   6   7   8 David G Melvin  9 Hamid Meziane  5   6   7   8 Kateryna Micklich  1 Christophe Mittelhauser  5   6   7   8 Laurent Monassier  5   6   7   8 David Moulaert  5   6   7   8 Stéphanie Muller  5   6   7   8 Beatrix Naton  1 Frauke Neff  16 Patrick M Nolan  10 Lauryl Mj Nutter  27 Markus Ollert  1   12 Guillaume Pavlovic  5   6   7   8 Natalia S Pellegata  16 Emilie Peter  5   6   7   8 Benoit Petit-Demoulière  5   6   7   8 Amanda Pickard  10 Christine Podrini  9 Paul Potter  10 Laurent Pouilly  5   6   7   8 Oliver Puk  21 David Richardson  9 Stephane Rousseau  5   6   7   8 Leticia Quintanilla-Fend  16 Mohamed M Quwailid  10 Ildiko Racz  1   28 Birgit Rathkolb  1   29 Fabrice Riet  5   6   7   8 Janet Rossant  27 Michel Roux  5   15   6   7   8 Jan Rozman  1   25 Ed Ryder  9 Jennifer Salisbury  9 Luis Santos  10 Karl-Heinz Schäble  1 Evelyn Schiller  1 Anja Schrewe  1 Holger Schulz  18 Ralf Steinkamp  1 Michelle Simon  10 Michelle Stewart  10 Claudia Stöger  1 Tobias Stöger  18 Minxuan Sun  21 David Sunter  9 Lydia Teboul  10 Isabelle Tilly  5   6   7   8 Glauco P Tocchini-Valentini  17 Monica Tost  16 Irina Treise  1 Laurent Vasseur  5   6   7   8 Emilie Velot  15   6   7   8 Daniela Vogt-Weisenhorn  21 Christelle Wagner  5   15   6   7   8 Alison Walling  10 Bruno Weber  5   6   7   8 Olivia Wendling  5   15   6   7   8 Henrik Westerberg  10 Monja Willershäuser  1 Eckhard Wolf  29   1 Anne Wolter  5   6   7   8 Joe Wood  10 Wolfgang Wurst  21   2   30   31 Ali Önder Yildirim  18 Ramona Zeh  1 Andreas Zimmer  1   28 Annemarie Zimprich  21 EUMODIC ConsortiumChris Holmes #  4 Karen P Steel #  9 Yann Herault #  5   15   6   7   8 Valérie Gailus-Durner #  1 Ann-Marie Mallon #  10 Steve Dm Brown #  10
Affiliations

Analysis of mammalian gene function through broad-based phenotypic screens across a consortium of mouse clinics

Martin Hrabě de Angelis et al. Nat Genet. 2015 Sep.

Abstract

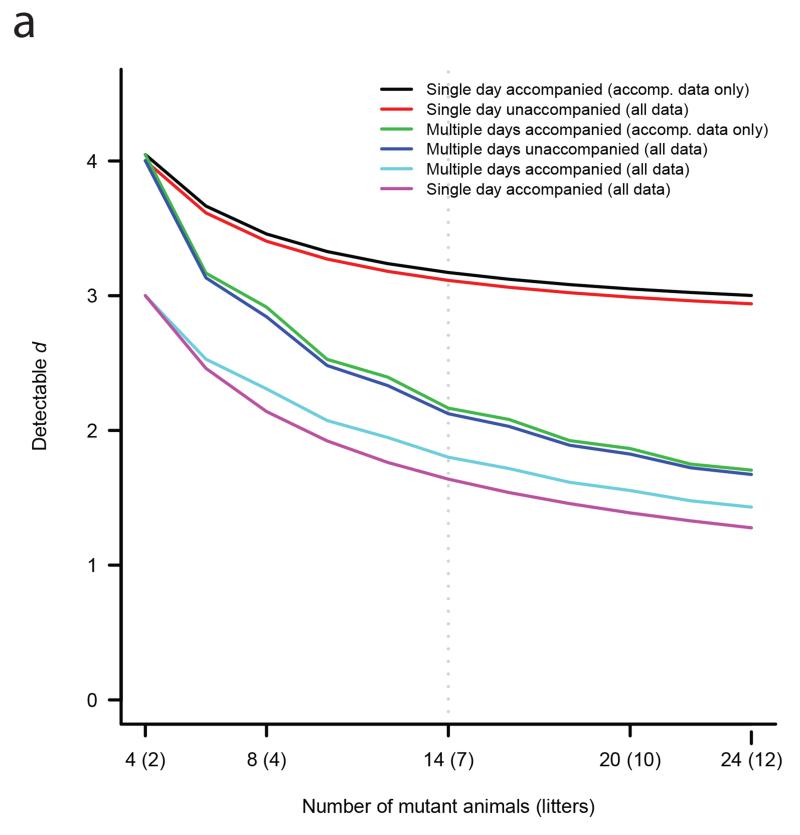
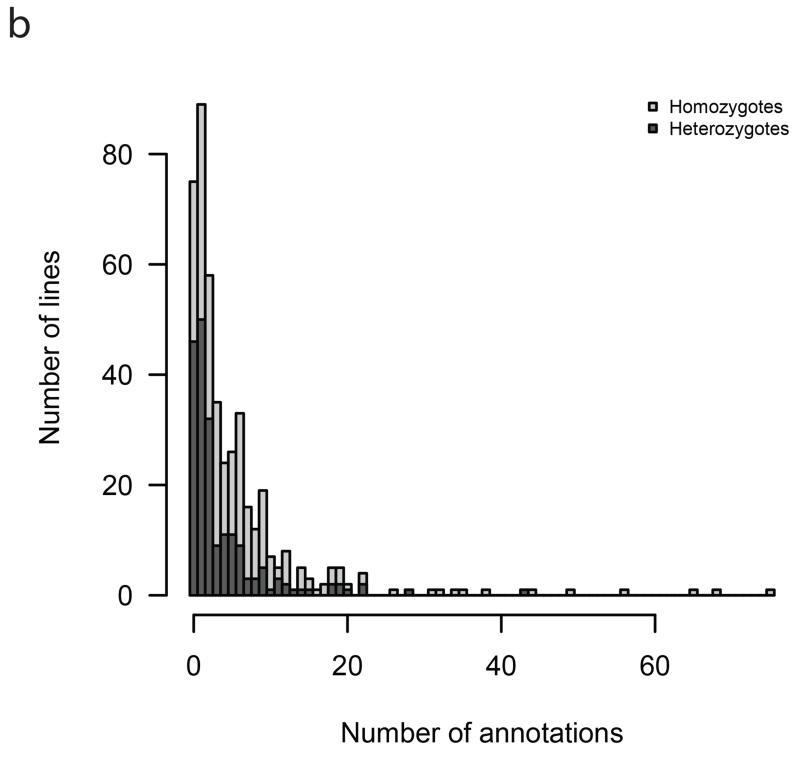
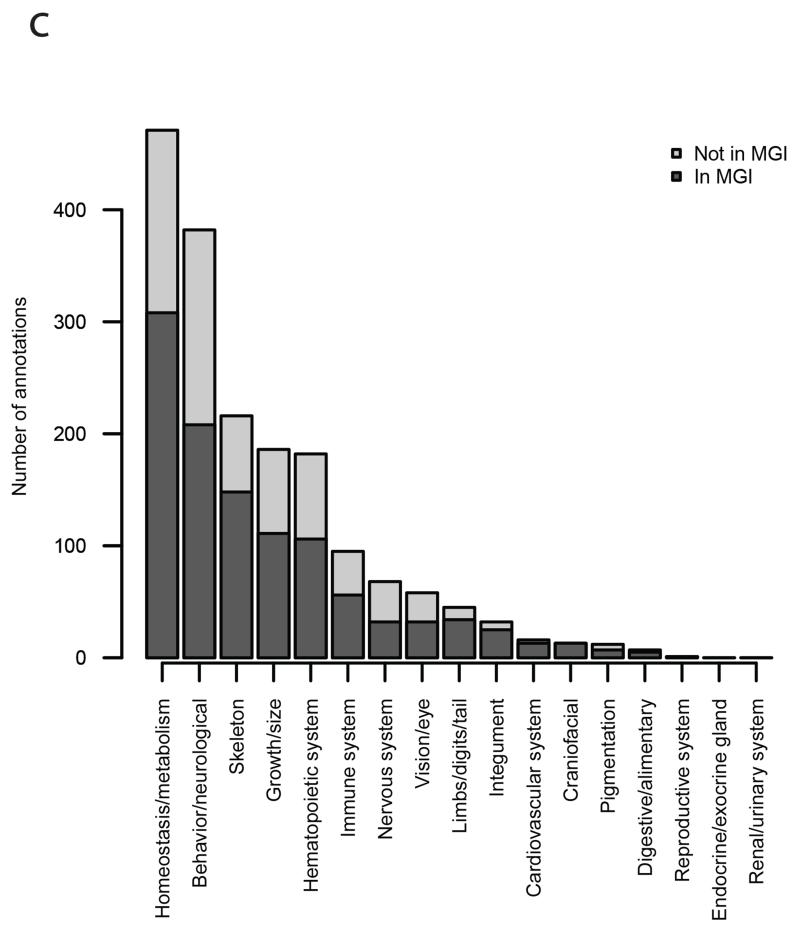
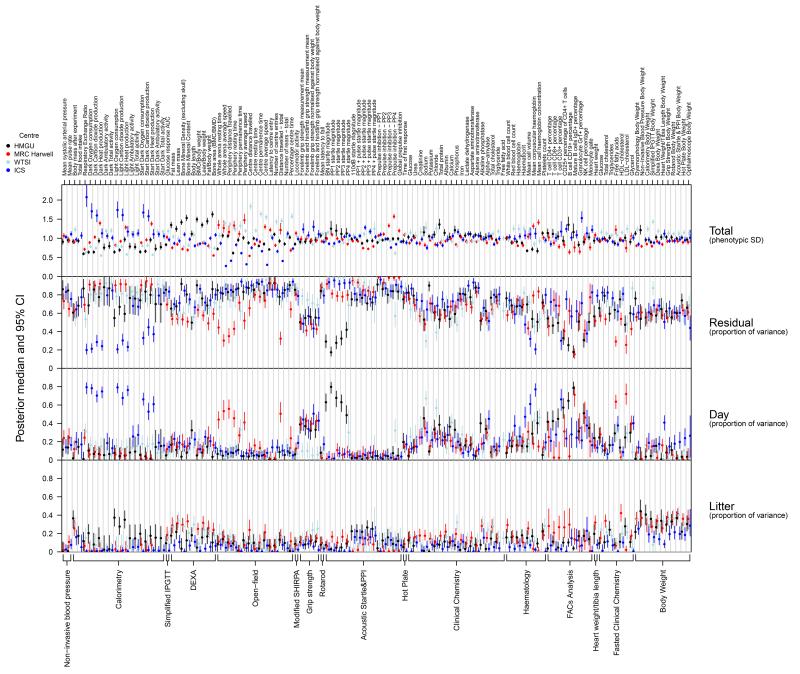
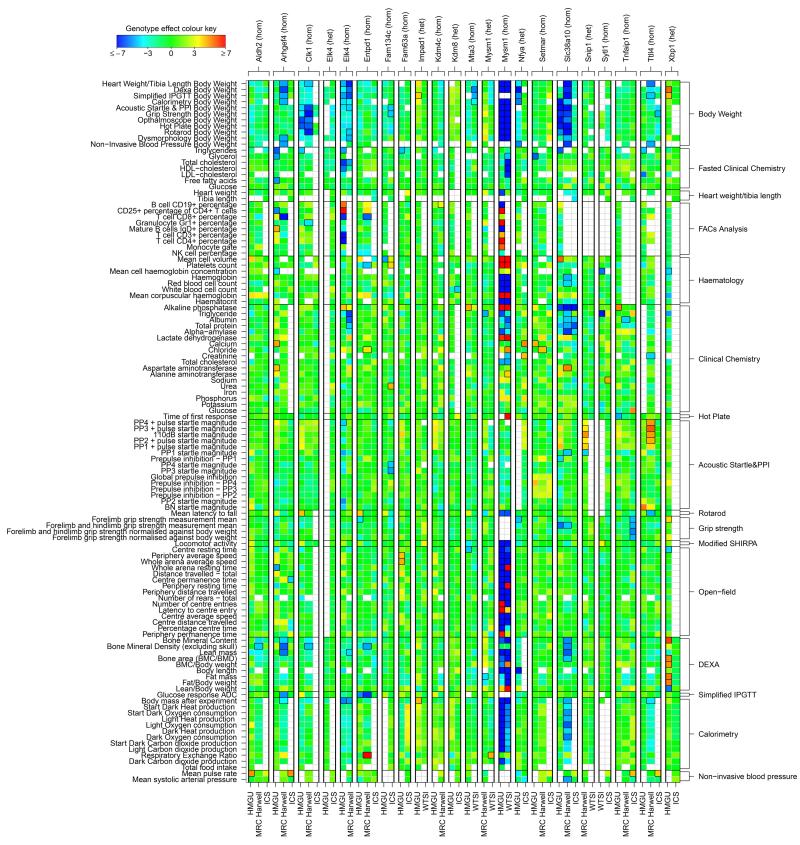
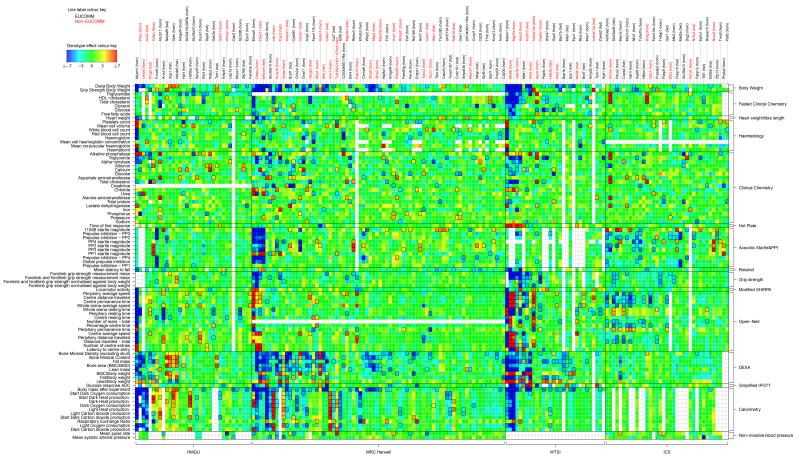
The function of the majority of genes in the mouse and human genomes remains unknown. The mouse embryonic stem cell knockout resource provides a basis for the characterization of relationships between genes and phenotypes. The EUMODIC consortium developed and validated robust methodologies for the broad-based phenotyping of knockouts through a pipeline comprising 20 disease-oriented platforms. We developed new statistical methods for pipeline design and data analysis aimed at detecting reproducible phenotypes with high power. We acquired phenotype data from 449 mutant alleles, representing 320 unique genes, of which half had no previous functional annotation. We captured data from over 27,000 mice, finding that 83% of the mutant lines are phenodeviant, with 65% demonstrating pleiotropy. Surprisingly, we found significant differences in phenotype annotation according to zygosity. New phenotypes were uncovered for many genes with previously unknown function, providing a powerful basis for hypothesis generation and further investigation in diverse systems.


Figures

Figure 1a
Figure 1a. Effect size versus sample size
Detectable standardized effect size, d, as a function of sample size, under a variety of experimental workflows and analysis approaches (identified in legend). The two qualitative design choices under consideration were: whether mutant animals were phenotyped across multiple days with four animals per day, or all on a single day; and whether baseline animals were phenotyped on the same day(s) as mutants (i.e. whether the mutants were accompanied). Two analytical approaches were compared: analysis of all baseline data (all data); versus analysis restricted to baseline data from animals phenotyped on the same day(s) as mutants (accompanying data only). Calculations were based on attaining 80% power while controlling the FDR at 5%. The variance components used in the power calculations were taken as the average estimates across all parameters and procedures: the variance proportion for day effect was 0.18, for the litter effect 0.12 and for the residual effect 0.69 (Supplementary Figure 2 shows similar plots for procedure-specific variance components).
Figure 1b
Figure 1b. Histogram of number of annotations per line
Histogram of number of annotations per line, with each bar split by colour into counts arising from homozygous and heterozygous lines.
Figure 1c
Figure 1c. Histogram of number of annotation in each top level MP term
Histogram of number of annotations within each top-level MP ontology term, with each bar split by colour into numbers arising from mutant lines with or without annotations in MGI.
Figure 2
Figure 2. Phenotyping variance
Comparison of estimated variance components across centres. Posterior median (with error bars indicating 95% credible intervals) of total phenotypic SD (top panel), and proportions of variance (bottom three panels), are shown for each quantitative parameter, labelled top, within each test, labelled bottom. For visual comparison the total phenotypic SDs at each test were scaled multiplicatively to a mean of 1.
Figure 3
Figure 3. Heatmap of annotations of reference lines
Reference line comparison of annotations across centres. Colours represent scaled genotype effect (posterior median / SD), with blue/red indicating a decreased/increased mutant phenotype relative to baseline animals. Significant annotations (FDR < 5%) are indicated by a black outline around the corresponding rectangle.
Figure 4
Figure 4. Heatmap of annotations of complete dataset
Heatmap of annotations. Colours represent scaled genotype effect (posterior median / SD), with blue/red indicating a decreased/increased mutant phenotype relative to baseline animals. Significant annotations (FDR < 5%) are indicated by a black outline around the corresponding rectangle. Labels for non-EUCOMM lines are in red. For legibility, the heatmap only displays a subset of parameters for those lines with at least three annotations.
Figure 5
Figure 5. Phenotyping similarity
Classification of EUMODIC-MGI gene pairs into matched or unmatched on the basis of phenotype similarity. The Receiver Operating Characteristic (ROC) curve plots the proportion of (EUMODIC-MGI) matched gene pairs correctly classified as matched against the proportion of unmatched gene pairs incorrectly classified as matched, as the phenotype-similarity threshold is varied (ROC area under curve 0.674).
Figure 6
Figure 6. Analysis of genes with no prior annotations
The Venn diagrams illustrate the distribution of genes with relevant phenotype hits in three disease areas – (a) bone and skeleton; (b) metabolism; (c) neurological and behaviour. For each area, we identified combinations of tests, where a phenotype hit would be indicative of the relevant disease correlate and assigned genes accordingly. A total of 94 genes were identified across the three disease areas.

Comment in

References

    1. Blake JA, et al. The Mouse Genome Database: integration of and access to knowledge about the laboratory mouse. Nucleic Acids Res. 2014;42:D810–7. - PMC - PubMed
    1. Brown SD, Wurst W, Kuhn R, Hancock JM. The functional annotation of mammalian genomes: the challenge of phenotyping. Annu Rev Genet. 2009;43:305–33. - PubMed
    1. Brown SD, Hancock JM, Gates H. Understanding mammalian genetic systems: the challenge of phenotyping in the mouse. PLoS Genet. 2006;2:e118. - PMC - PubMed
    1. Gailus-Durner V, et al. Introducing the German Mouse Clinic: open access platform for standardized phenotyping. Nat Methods. 2005;2:403–4. - PubMed
    1. Wagner GP, Zhang J. The pleiotropic structure of the genotype-phenotype map: the evolvability of complex organisms. Nat Rev Genet. 2011;12:204–13. - PubMed

Additional References

    1. Pettitt SJ, et al. Agouti C57BL/6N embryonic stem cells for mouse genetic resources. Nat Methods. 2009;6:493–5. - PMC - PubMed
    1. Karp N, et al. Applying the ARRIVE Guidelines to an In Vivo Database. PLoS Biol. 2015;13(5):e1002151. - PMC - PubMed
    1. Hoehndorf R, Schofield PN, Gkoutos GV. PhenomeNET: a whole-phenome approach to disease gene discovery. Nucleic Acids Res. 2011;39:e119. - PMC - PubMed
    1. Cunningham F, et al. Ensembl 2015. Nucleic Acids Res. 2014 - PMC - PubMed
    1. Beck T, Hastings RK, Gollapudi S, Free RC, Brookes AJ. GWAS Central: a comprehensive resource for the comparison and interrogation of genome-wide association studies. Eur J Hum Genet. 2014;22:949–52. - PMC - PubMed

Publication types

LinkOut - more resources