. 2015 Jul 27;10(7):e0133754.
doi: 10.1371/journal.pone.0133754. eCollection 2015.

A Screen for Epigenetically Silenced microRNA Genes in Gastrointestinal Stromal Tumors

Affiliations

A Screen for Epigenetically Silenced microRNA Genes in Gastrointestinal Stromal Tumors

Mai Isosaka et al. PLoS One. .

Abstract

Background: Dysregulation of microRNA (miRNA) has been implicated in gastrointestinal stromal tumors (GISTs) but the mechanism is not fully understood. In this study, we aimed to explore the involvement of epigenetic alteration of miRNA genes in GISTs.

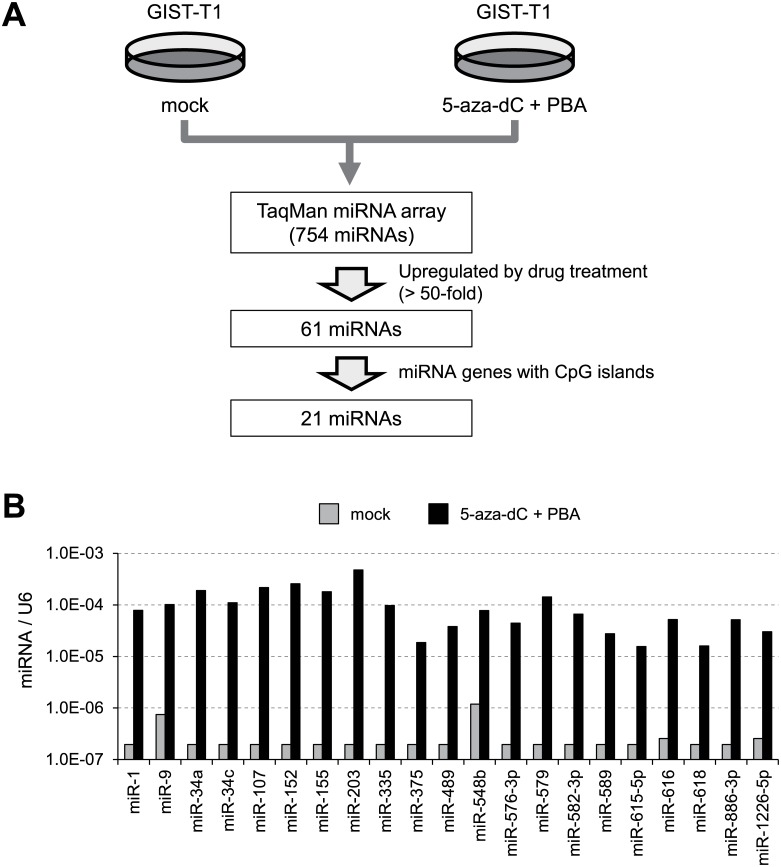
Methods: GIST-T1 cells were treated with 5-aza-2'-deoxycytidine (5-aza-dC) and 4-phenylbutyric acid (PBA), after which miRNA expression profiles were analyzed using TaqMan miRNA arrays. DNA methylation was then analyzed using bisulfite pyrosequencing. The functions of miRNAs were examined using MTT assays, wound-healing assays, Boyden chamber assays and Matrigel invasion assays. Gene expression microarrays were analyzed to assess effect of ectopic miRNA expression in GIST-T1 cells.

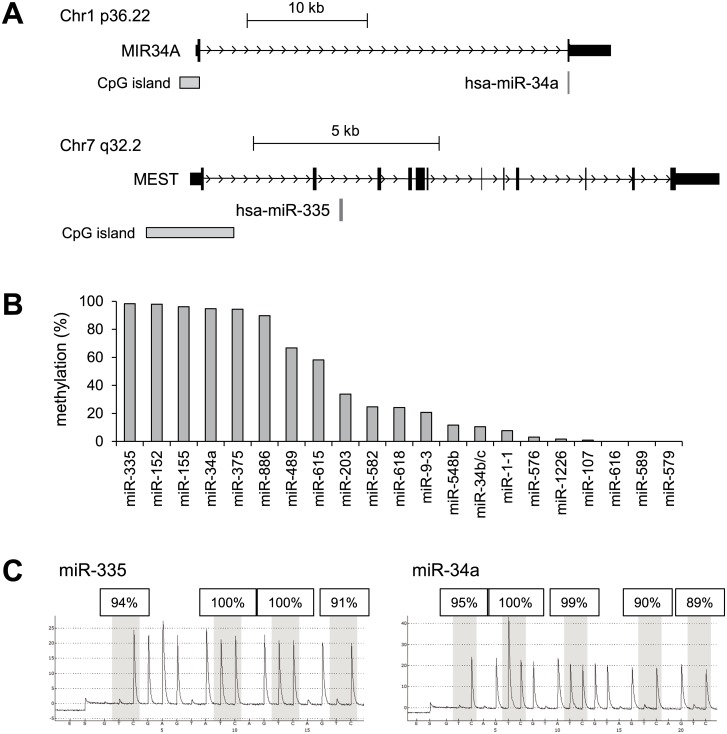
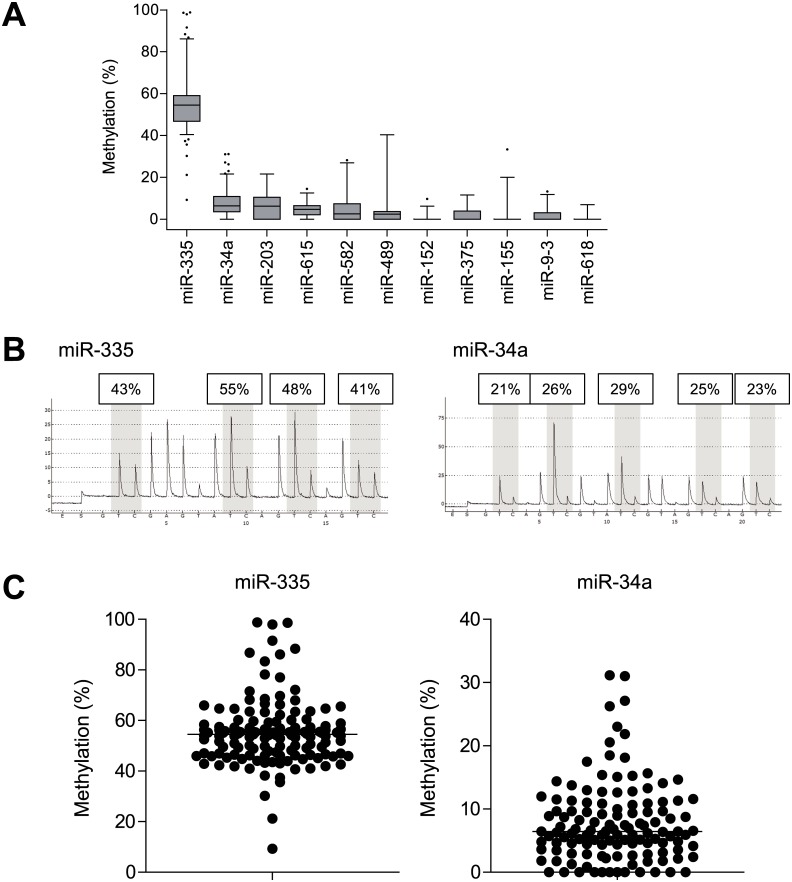
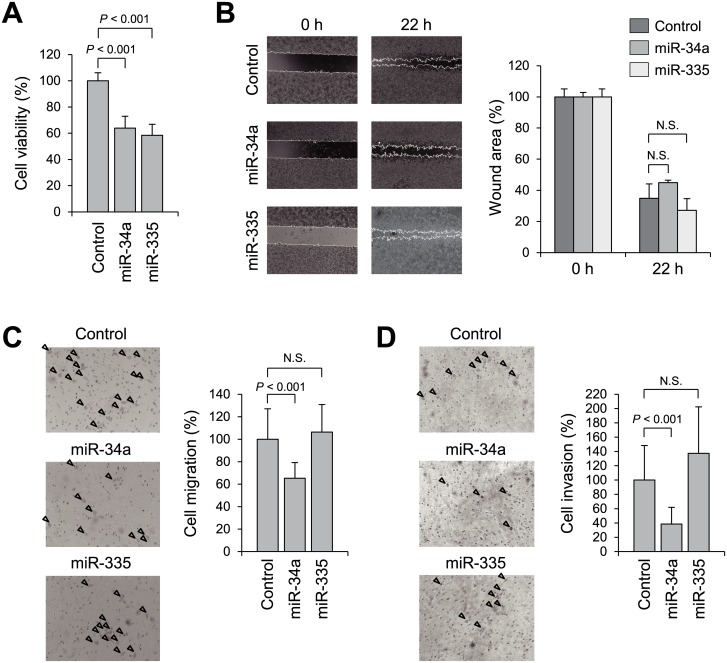
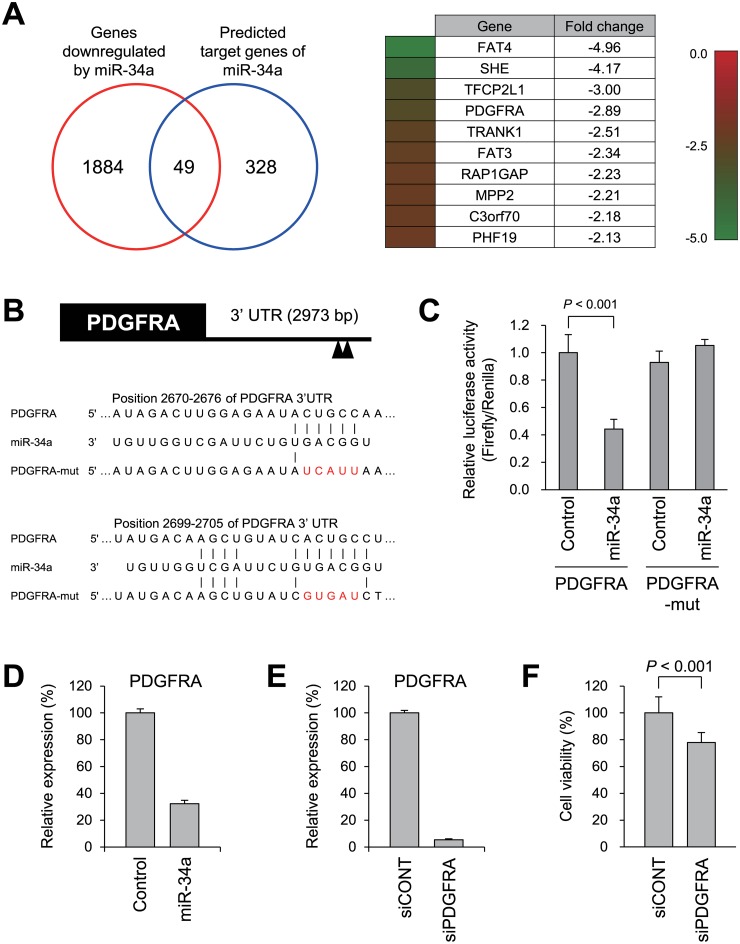
Results: Of the 754 miRNAs analyzed, 61 were significantly upregulated in GIST-T1 cells treated with 5-aza-dC plus PBA. Among those, 21 miRNA genes were associated with an upstream CpG island (CGI), and the CGIs of miR-34a and miR-335 were frequently methylated in GIST-T1 cells and primary GIST specimens. Transfection of miR-34a or miR-335 mimic molecules into GIST-T1 cells suppressed cell proliferation, and miR-34a also inhibited migration and invasion by GIST-T1 cells. Moreover, miR-34a downregulated a number of predicted target genes, including PDGFRA. RNA interference-mediated knockdown of PDGFRA in GIST-T1 cells suppressed cell proliferation, suggesting the tumor suppressive effect of miR-34a is mediated, at least in part, through targeting PDGFRA.

Conclusions: Our results suggest that miR-34a and miR-335 are candidate tumor suppressive miRNAs in GISTs, and that they are frequent targets of epigenetic silencing in GISTs.


Conflict of interest statement

Competing Interests: The authors have declared that no competing interests exist.

Figures

Fig 1
Fig 1. Identification of epigenetically silenced miRNAs in GIST-T1 cells.
(A) Workflow of the screen to identify epigenetically silenced miRNAs. (B) Summarized TaqMan array results for 22 candidate miRNAs in GIST-T1 cells treated with or without 5-aza-dC plus PBA. Expression levels were normalized to that of U6 snRNA expression.
Fig 2
Fig 2. Analysis of CGI methylation at predicted transcription start sites of miRNA genes.
(A) Representative examples of miRNA gene structures. Host genes encoding miR-34a and miR-335 are shown. CGIs and pre-miRNA regions are shown below. (B) Levels of CGI methylation in the selected miRNA genes were analyzed using bisulfite pyrosequencing in GIST-T1 cells. (C) Results of bisulfite pyrosequencing of miR-335 and miR-34a in GIST-T1 cells.
Fig 3
Fig 3. Analysis of miRNA gene methylation in primary GIST specimens.
(A) Summarized results showing the methylation levels of selected miRNAs in primary tumors analyzed using bisulfite pyrosequencing. (B) Representative results of bisulfite pyrosequencing of miR-335 and miR-34a in primary tumors. (C) Summarized results showing bisulfite pyrosequencing of miR-335 and miR-34a in primary GIST specimens.
Fig 4
Fig 4. Functional analysis of miR-34a and miR-335.
(A) Cell viability assays using GIST-T1 cells transfected with miR-34a or miR-335 mimics or a negative control. Cell viabilities were determined 72 h after transfection. Shown are the means of 8 replications; error bars represent standard deviations; P values were determined using Student’s t test. (B) Wound healing assay using GIST-T1 cells transfected with a miRNA mimic or a negative control. Shown on the right are the means of 4 replications; error bars represent standard deviations; P values were determined using Student’s t test. (C,D) Cell migration (C) and Matrigel invasion (D) assays using GIST-T1 cells transfected with a miRNA mimic or a negative control. Arrowheads indicate migrating or invading cells. Shown on the right are the means of 5 random microscopic fields per membrane; error bars represent standard deviations; P values were determined using Student’s t test.
Fig 5
Fig 5. Downregulation of predicted miR-34a target genes in GIST-T1 cells.
(A) Venn diagram for genes downregulated by ectopic miR-34a expression in GIST-T1 cells (>1.5-fold) and predicted miR-34a target genes. Of the 49 downregulated target genes, the top 10 genes are listed on the right. Expression levels and fold-changes are also indicated. (B) Putative miR-34a binding sites in the 3’ untranslated region (UTR) of PDGFRA. Mutant binding sites used for the luciferase assay are shown in red. (C) Reporter assay results using a luciferase vector containing the wild-type PDGFRA 3’ UTR (PDGFRA) or the mutant 3’ UTR (PDGFRA-mut) in GIST-T1 cells cotransfected a miR-34a mimic or a negative control. Shown are means of 4 replications; error bars represent standard deviations; the P value was determined using Student’s t test. (D) Quantitative RT-PCR of PDGFRA in GIST-T1 cells transfected with a miR-34a mimic or a negative control. (E) Quantitative RT-PCR of PDGFRA in GIST-T1 cells transfected with a siRNA targeting PDGFRA (siPDGFRA) or a control siRNA (siCONT). (F) Cell viability assays using GIST-T1 cells transfected with siCONT or siPDGFRA. Cell viabilities were determined 72 h after transfection. Shown are means of 8 replications; error bars represent standard deviations; the P value was determined using Student’s t test.

References

    1. Joensuu H, Hohenberger P, Corless CL. Gastrointestinal stromal tumour. Lancet. 2013;382(9896):973–83. Epub 2013/04/30. 10.1016/S0140-6736(13)60106-3 . - DOI - PubMed
    1. Wozniak A, Sciot R, Guillou L, Pauwels P, Wasag B, Stul M, et al. Array CGH analysis in primary gastrointestinal stromal tumors: cytogenetic profile correlates with anatomic site and tumor aggressiveness, irrespective of mutational status. Genes Chromosomes Cancer. 2007;46(3):261–76. Epub 2006/12/16. 10.1002/gcc.20408 . - DOI - PubMed
    1. Assamaki R, Sarlomo-Rikala M, Lopez-Guerrero JA, Lasota J, Andersson LC, Llombart-Bosch A, et al. Array comparative genomic hybridization analysis of chromosomal imbalances and their target genes in gastrointestinal stromal tumors. Genes Chromosomes Cancer. 2007;46(6):564–76. Epub 2007/03/03. 10.1002/gcc.20439 . - DOI - PubMed
    1. Igarashi S, Suzuki H, Niinuma T, Shimizu H, Nojima M, Iwaki H, et al. A novel correlation between LINE-1 hypomethylation and the malignancy of gastrointestinal stromal tumors. Clin Cancer Res. 2010;16(21):5114–23. Epub 2010/10/28. . - PubMed
    1. Okamoto Y, Sawaki A, Ito S, Nishida T, Takahashi T, Toyota M, et al. Aberrant DNA methylation associated with aggressiveness of gastrointestinal stromal tumour. Gut. 2012;61(3):392–401. Epub 2011/06/29. 10.1136/gut.2011.241034 . - DOI - PubMed

Publication types

MeSH terms