. 2015 Sep;16(9):980-90.
doi: 10.1038/ni.3226. Epub 2015 Jul 27.

LEF-1 and TCF-1 orchestrate T(FH) differentiation by regulating differentiation circuits upstream of the transcriptional repressor Bcl6

Affiliations

LEF-1 and TCF-1 orchestrate T(FH) differentiation by regulating differentiation circuits upstream of the transcriptional repressor Bcl6

Youn Soo Choi et al. Nat Immunol. 2015 Sep.

Abstract

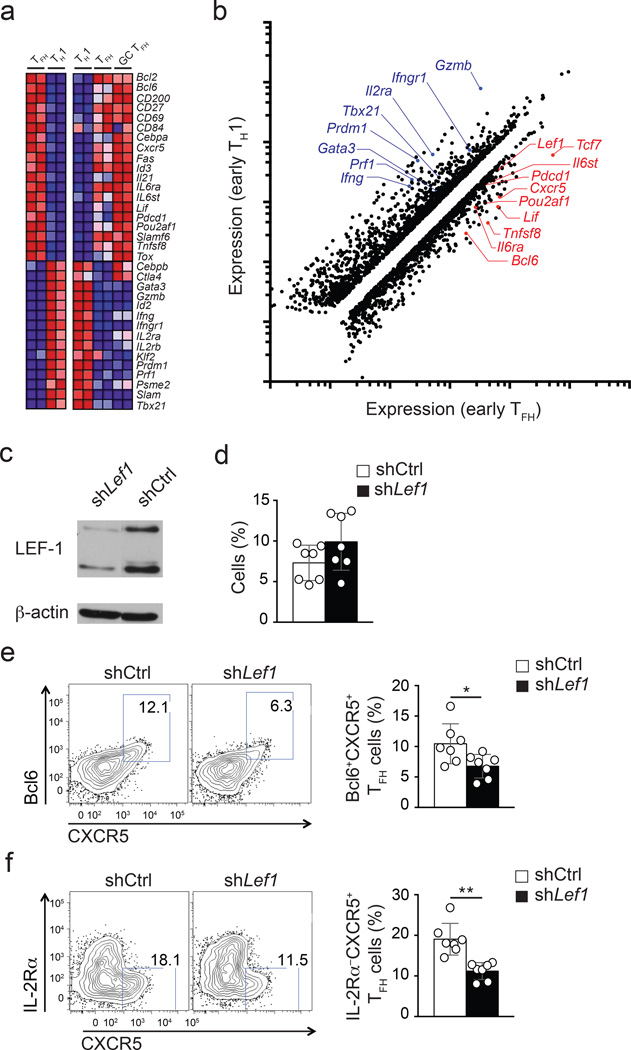
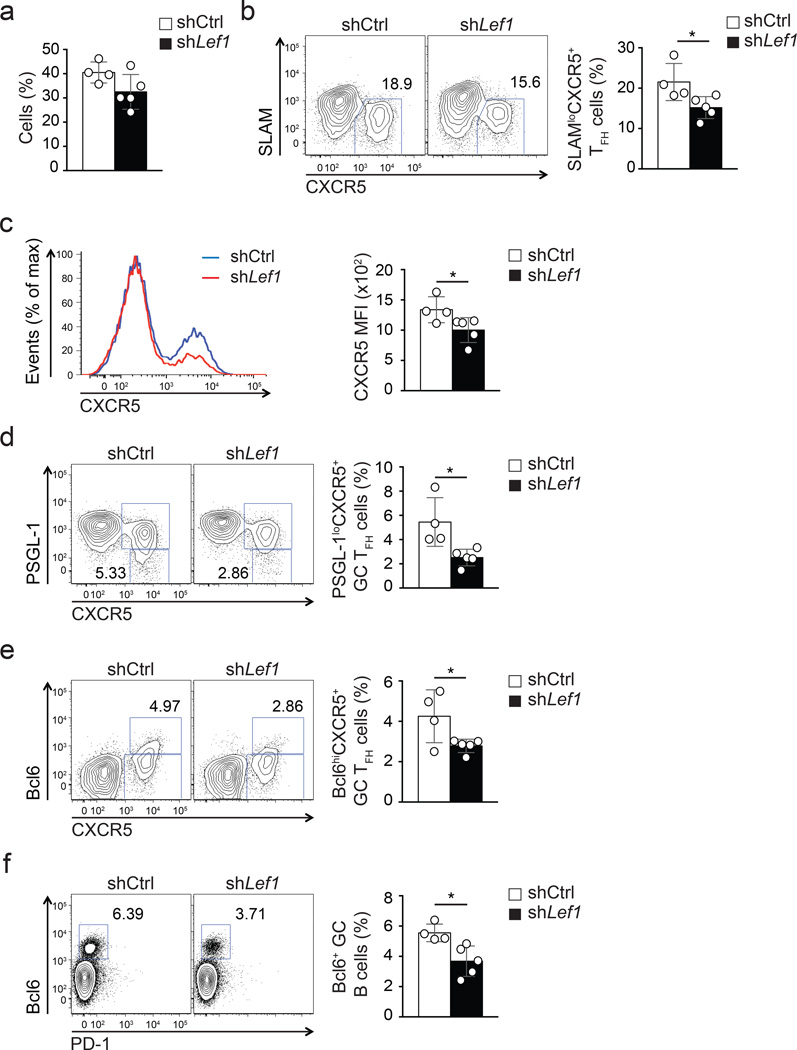
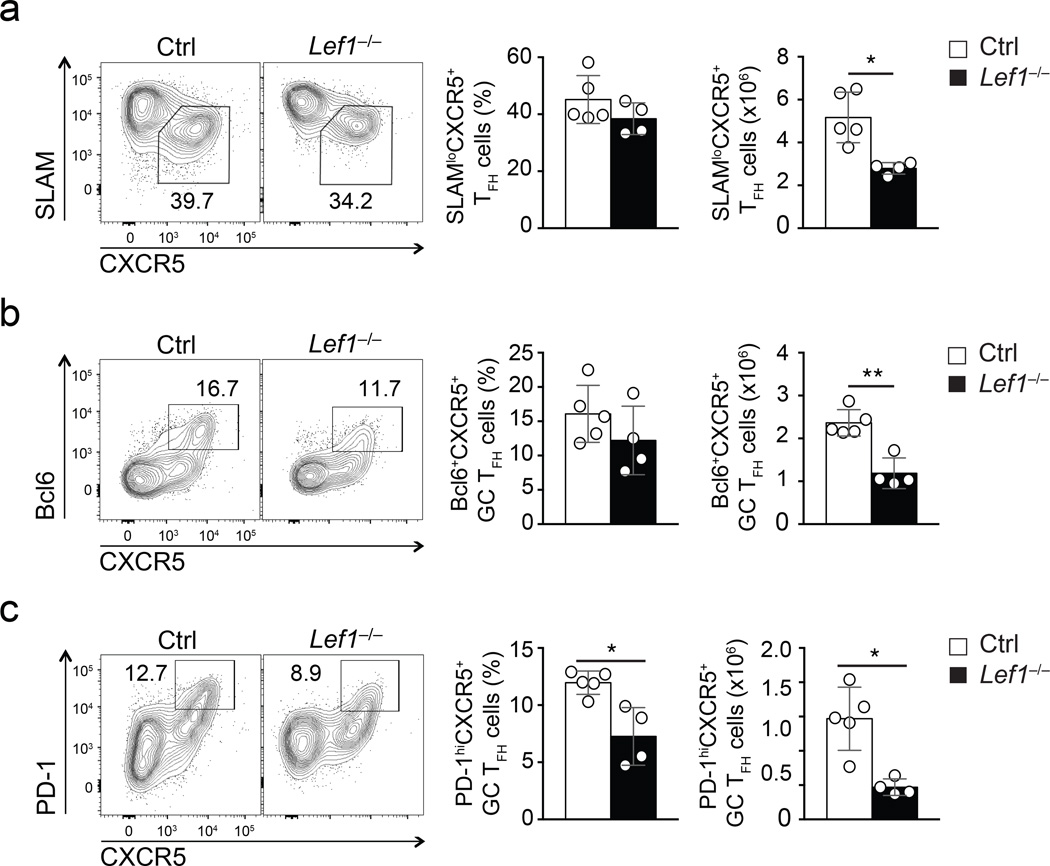
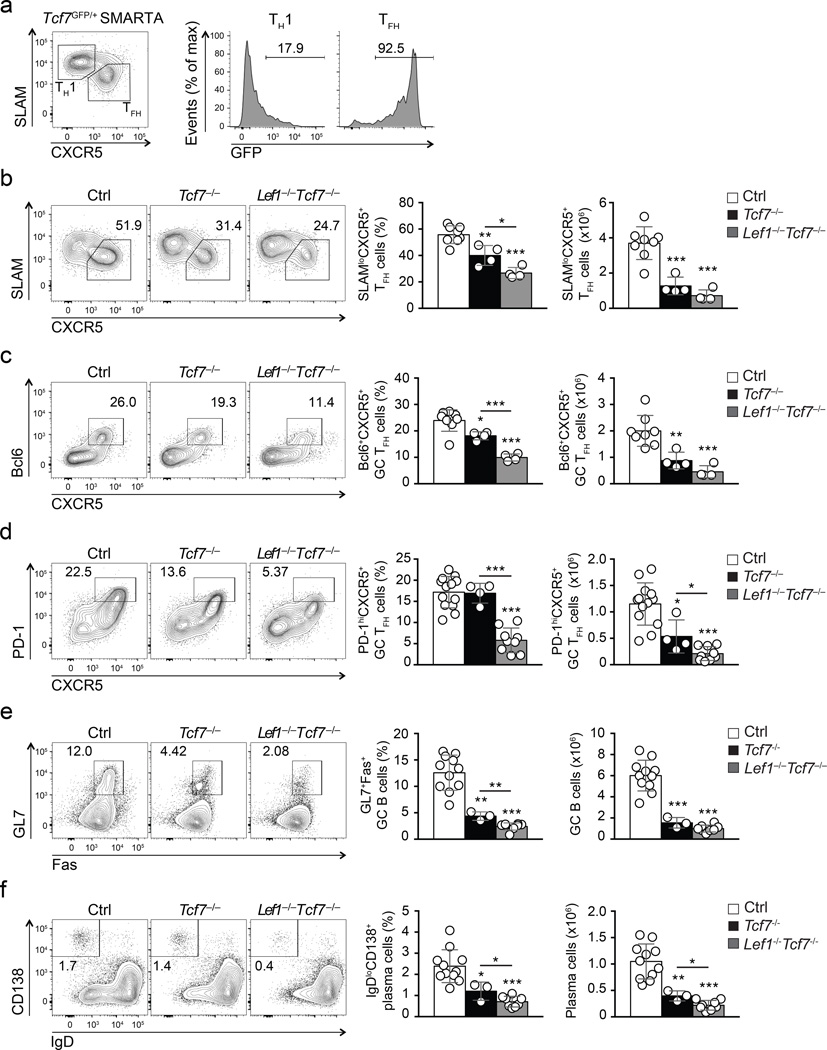
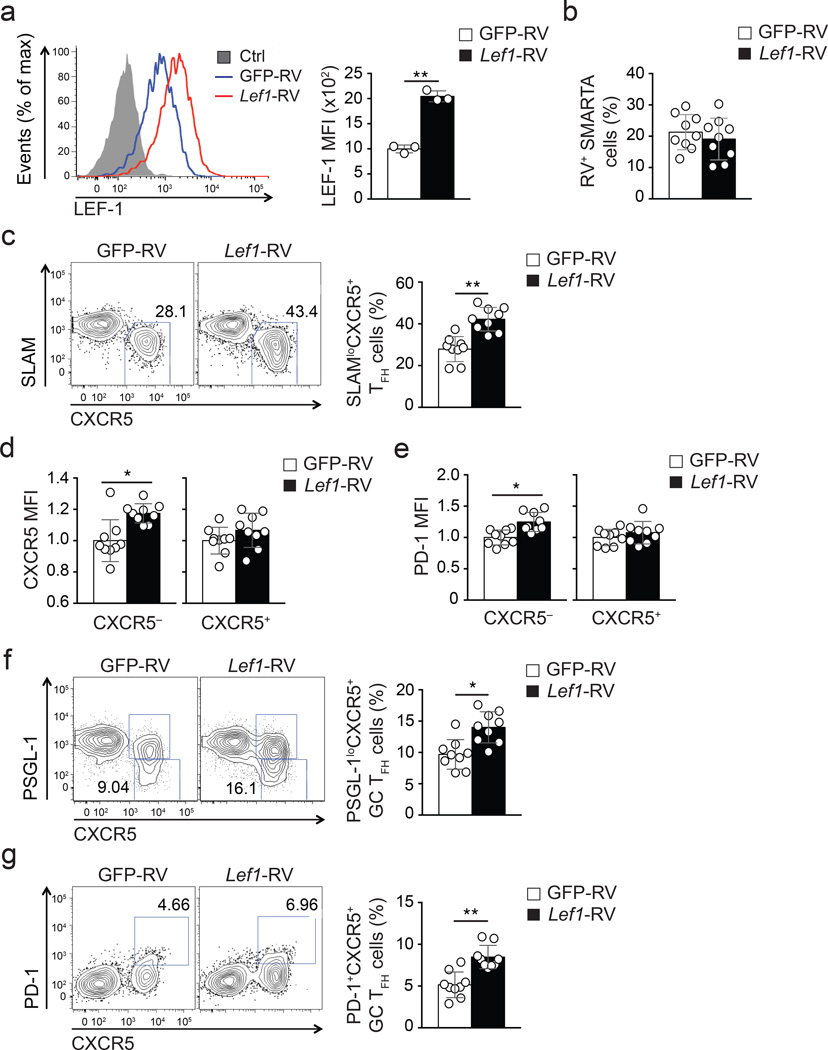
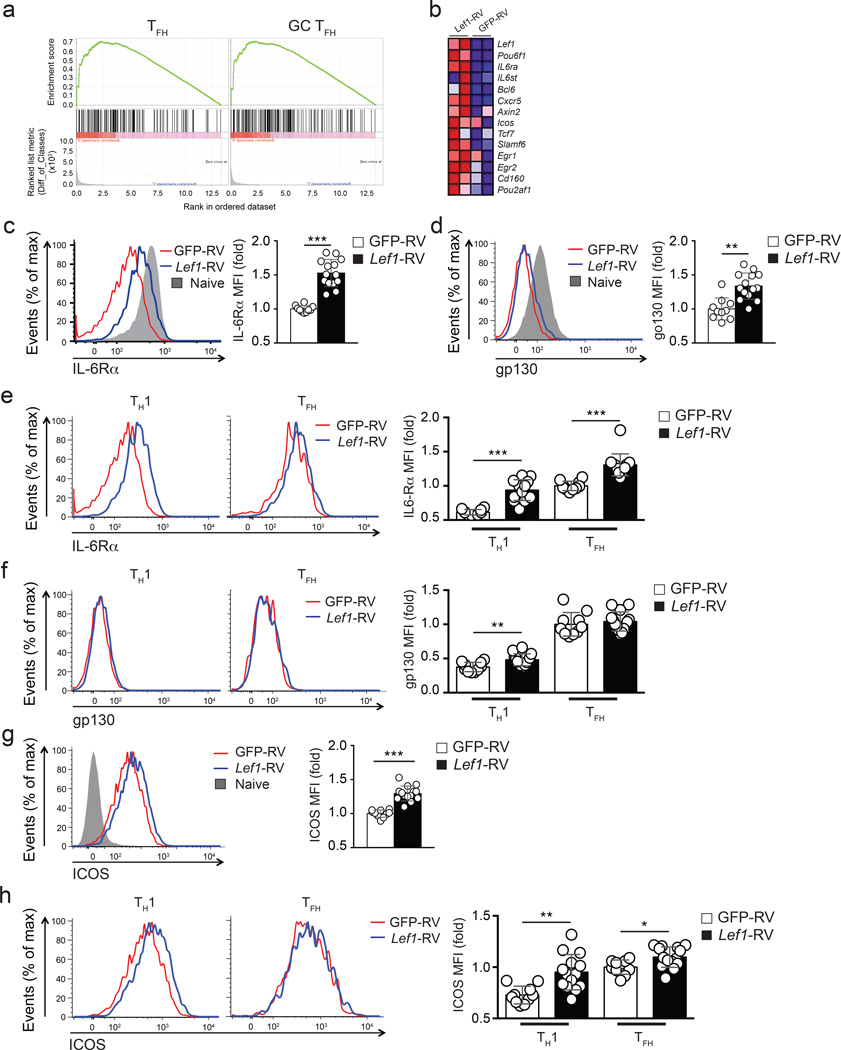
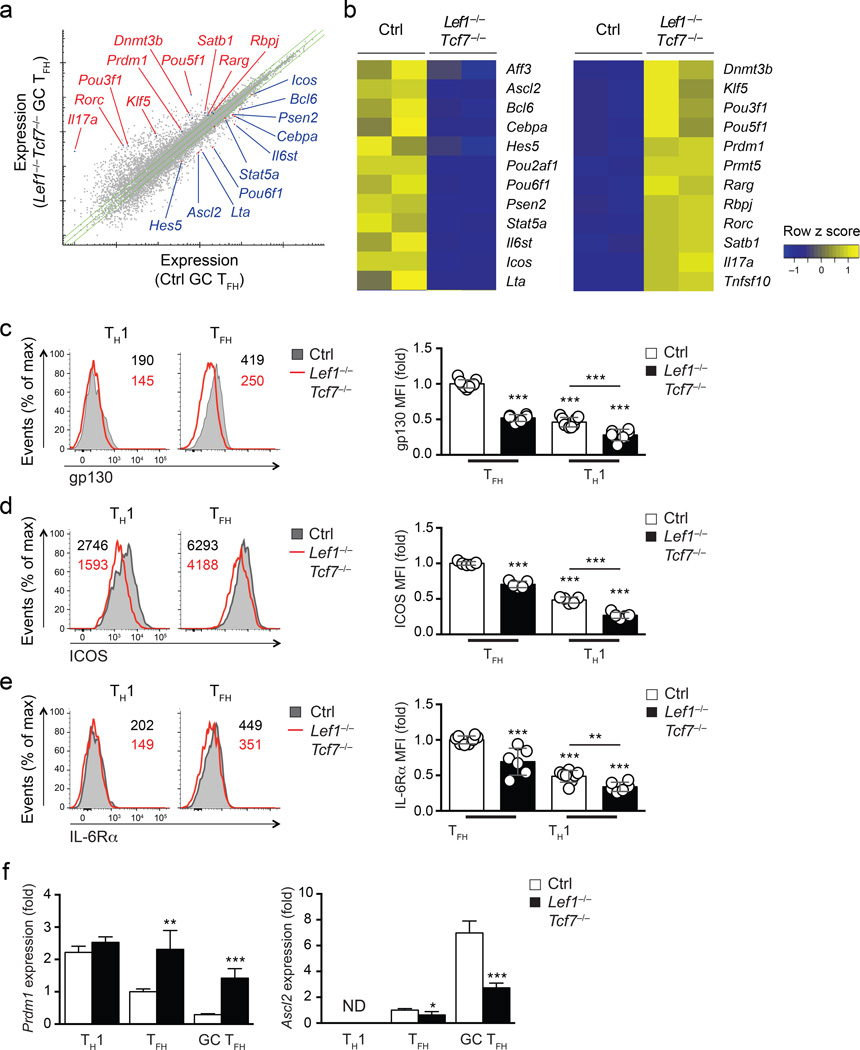
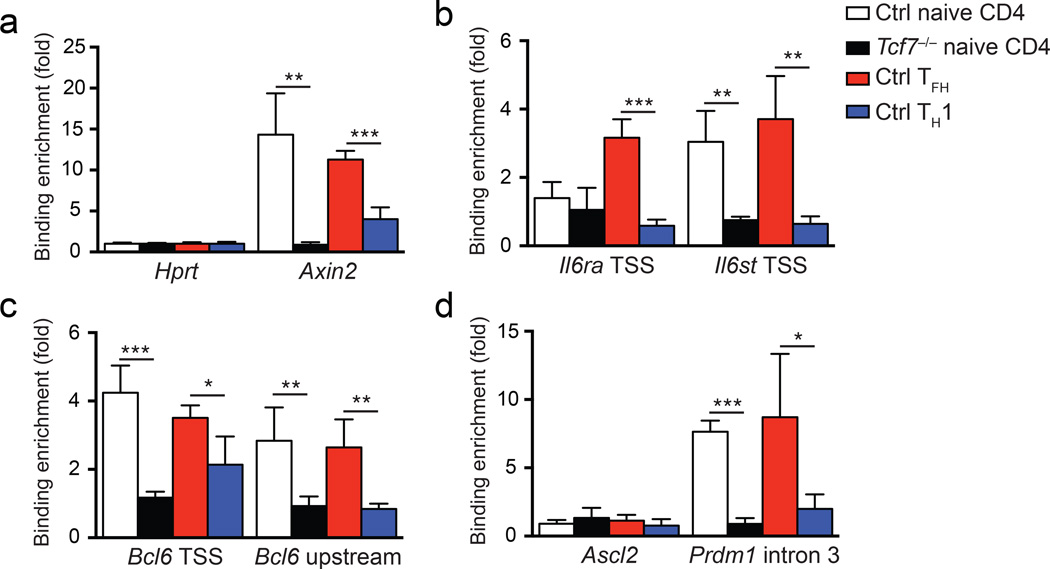
Follicular helper T cells (T(FH) cells) are specialized effector CD4(+) T cells that help B cells develop germinal centers (GCs) and memory. However, the transcription factors that regulate the differentiation of T(FH) cells remain incompletely understood. Here we report that selective loss of Lef1 or Tcf7 (which encode the transcription factor LEF-1 or TCF-1, respectively) resulted in T(FH) cell defects, while deletion of both Lef1 and Tcf7 severely impaired the differentiation of T(FH) cells and the formation of GCs. Forced expression of LEF-1 enhanced T(FH) differentiation. LEF-1 and TCF-1 coordinated such differentiation by two general mechanisms. First, they established the responsiveness of naive CD4(+) T cells to T(FH) cell signals. Second, they promoted early T(FH) differentiation via the multipronged approach of sustaining expression of the cytokine receptors IL-6Rα and gp130, enhancing expression of the costimulatory receptor ICOS and promoting expression of the transcriptional repressor Bcl6.


Conflict of interest statement

The authors declare no conflicts of interest.

Figures

Figure 1
Figure 1. Lef1 expression is associated with TFH cells and regulates early TFH differentiation
(a) RNA-seq analysis of early TFH (IL-2RαBlimp1-YFP) versus TH1 (IL-2Rα+Blimp1-YFP+) CD45.1+ Blimp1-YFP SMARTA cells isolated from B6 mice 3 d after SMARTA cell transfer and LCMV infection (left panels), and that of TH1 (CXCR5), TFH (PD-1loCXCR5+), and GC TFH (PD-1hiCXCR5+) sorted 8 d after LCMV from CD45.2+ B6 mice (right panels). Heatmaps of selected genes of interest are shown. (b) Scatter plot of genes showing ≥ |1.5 fold| differential expression in early TFH in comparison to TH1 cells. Select genes of interest are marked. (c) Immunoblot of LEF-1 (two isoforms) and β-actin from shCtrl+ and shLef1+ SMARTA cells. (d-f) Analysis of shCtrl+ or shLef1+ CD45.1+ SMARTA cells (Ametrine+CD45.1+CD4+CD19), three days after transfer of shRNA-RV-infected SMARTA cells into B6 mice and LCMV infection. (d) shRNA+ SMARTA cell frequency among total CD4+ T cells. (e-f) Phenotyping of shCtrl+ and shLef1+ SMARTA cells. (e) Bcl6+CXCR5+ TFH cells. (f) IL-2RαCXCR5+ TFH cells. Quantitation shown as % of SMARTA cells (mean ± s.e.m.). Data are a composite of two independent experiments (n = 7 per group). * P < 0.05, ** P < 0.001 (Student’s t-test).
Figure 2
Figure 2. LEF-1-dependent TFH differentiation supports germinal center responses
(a-e) Frequencies and phenotypes of shCtrl+ or shLef1+ CD45.1+ SMARTA cells assessed by flow cytometry at 8 d after SMARTA cell transfer into B6 mice and LCMV infection. (a) Abundance of shRNA+ SMARTA cells (Ametrine+CD45.1+CD4+CD19) among total CD4+ T cells. (b) Frequency of SLAMloCXCR5+ TFH cells. Quantitation shown as % of SMARTA cells. (c) Expression of CXCR5 on shCtrl+ (blue) and shLef1+ (red) SMARTA cells. (d-e) Frequencies of shCtrl+ and shLef1+ SMARTA GC TFH cells among SMARTA cells phenotyped as PSGL-1loCXCR5+(d) and Bcl6hiCXCR5+ (e). (f) Abundance of GC B cells (Bcl6+CD19+) among total B cells. Data are representative of two independent experiments (n = 4–5 per group, mean ± s.e.m.). * P < 0.05 (Student’s t-test).
Figure 3
Figure 3. Genetic ablation of LEF-1 impairs GC TFH differentiation
(a-c) Flow cytometry of TFH and GC TFH cells in spleens of Lef1−/− mice and littermate controls infected with vaccinia virus for 8 days. Plots are gated on CD44hiCD62LloGFP+CD4+ T cells. (a) SLAMloCXCR5+ TFH cells. (b-c) Abundance of GC TFH cells phenotyped as Bcl6+CXCR5+ (b) and PD-1hiCXCR5+(c). Cumulative data from four independent experiments are shown (mean ± s.d.). * P < 0.01, ** P < 0.001 (Student’s t-test).
Figure 4
Figure 4. Both TCF-1 and LEF-1 contribute to regulation of TFH differentiation and B cell responses
(a) Flow cytometry of Tcf7-GFP expression in SMARTA CD4+ T cells (CD45.2+CD4+) at 8 d after Tcf7GFP/+ SMARTA cell transfer into CD45.1+ recipients and LCMV infection. Gated populations of TH1 (CXCR5SLAMhi) and TFH (CXCR5+SLAMlo) cells were analyzed for Tcf7-GFP expression. Numbers indicate percent Tcf7-GFP+ cells. Data are representative of ≥ 2 experiments. (b-f) Flow cytometry of Tcf7−/−Lef1−/−Tcf7−/−, and littermate controls 8 d after infection i.v. with vaccinia virus. (b-d) Abundance of SLAMloCXCR5+ TFH cells (b), Bcl6+CXCR5+ GC TFH cells (c), and PD-1hiCXCR5+ GC TFH cells (d) gated on CD44hiCD62LGFP+CD4+ T cells in spleen. (e-f) Abundance of GL7+Fas+ GC B cells (e) and IgDloCD138+ plasma cells (f) in the same animals (mean ± s.d.). Cumulative data from ≥ 3 experiments are shown. * P < 0.05, ** P < 0.01, *** P < 0.001 (Student’s t-test).
Figure 5
Figure 5. Enhanced Lef1 expression leads to augmented TFH differentiation
(a) Expression of LEF-1 in GFP-RV+ (blue) and Lef1-RV+ (red) SMARTA cells assessed by flow cytometry. (b-g) Frequencies and phenotypes of GFP-RV+ or Lef1-RV+ SMARTA cells (CD45.1+CD4+CD19) assessed by flow cytometry at 8 d after SMARTA cell transfer into B6 mice (CD45.2+) and LCMV infection. (b) Abundance of RV+ SMARTA cell (GFP+CD45.1+CD4+CD19) among total CD4+ T cells. (c) Abundance of SLAMloCXCR5+ TFH cells among RV+ SMARTA cells. (d-e) Expression of canonical TFH markers CXCR5 (d) and PD-1 (e) on CXCR5 TH1 and CXCR5+ TFH cells by Lef1-RV+ and GFP-RV+ cells, normalized to the mean MFI per group (mean ± s.e.m.). (f-g) Abundance of GC TFH cells phenotyped as PSGL-1loCXCR5+(f) and PD-1hiCXCR5+(e) of RV+ SMARTA cells. Data are a composite of two independent experiments (n = 9 per group). * P < 0.01, ** P < 0.001 (Student’s t-test).
Figure 6
Figure 6. LEF-1 regulates expression of IL-6 receptor chains and ICOS
(a-b) RNA-seq analysis of GFP-RV+ and Lef1-RV+ SMARTA cells (CD45.1+CD4+CD19) sorted into CXCR5+ TFH or CXCR5 TH1 populations isolated from B6 mice 4 d after SMARTA cell transfer and LCMV infection. (a) GSEA enrichment analysis showing enrichment of TFH and GC TFH gene signatures in Lef1-RV+ TH1 cells compared to GFP-RV+ TH1 cells. (b) Heat map of selected genes upregulated in Lef1-RV+ TH1 cells compared to GFP-RV+ TH1 cells. (c-h) Flow cytometry of GFP-RV+ or Lef1-RV+ SMARTA cells (CD45.1+CD4+CD19) assessed at 3 d after SMARTA cell transfer into B6 mice (CD45.2+) and LCMV infection. (c-d) Expression of IL6Rα(c) and gp130 (d) on RV+ SMARTA cells. (e-f) Comparative expression of IL-6Rα (e) and gp130 (f) GFP-RV+ (red) and Lef1-RV+ (blue) TH1 and TFH cells. (g-h) Abundance of ICOS on total RV+ SMARTA cells (g), CXCR5+ TFH and CXCR5 TH1 cell subpopulations (h) in the same animal (mean ± s.e.m.). Data are a composite of three independent experiments (n = 10–14 per group). * P < 0.05, ** P < 0.01, *** P < 0.001 (Student’s t-test).
Figure 7
Figure 7. LEF-1 and TCF-1-dependent transcriptional regulation of TFH-related genes
(a) RNA-seq analysis of PD-1hiCXCR5+ GC TFH cells sorted from spleens of Lef1−/−Tcf7−/− and littermate controls 8 d after vaccinia virus infection. Green lines mark mean gene expression of ≥ |1.5 fold| differences. Select genes of interest are marked. (b) Heatmap of selected differentially regulated genes between control and Lef1−/−Tcf7−/− GC TFH cells. (c-e) Flow cytometry of Lef1−/−Tcf7−/− and littermate controls 8 d after infection i.v. with vaccinia virus. CXCR5+ TFH and CXCR5 TH1 cells were analyzed for gp130 (c), ICOS (d), and IL-6Rα (e) expression (mean ± s.d.). Bar graphs are normalized to the mean MFI on control TFH cells. Data are a composite of 4 independent experiments (n = 5–9 per group). (f) Gene expression of Ascl2 and Prdm1 was determined by quantitative RT-PCR in CXCR5 TH1, PD-1loCXCR5+ TFH, and PD-1hiCXCR5+ GC TFH cells sorted from Lef1−/−Tcf7−/− and littermate controls 8 d after infection i.v. with vaccinia virus. Data are from 2 experiments with each sample measured in duplicate and normalized to control TFH cells. ND, not reliably detected. * P < 0.05, ** P < 0.01, *** P < 0.001 (Student’s t-test).
Figure 8
Figure 8. TCF-1 binds to key TFH-associated genes in TFH cells
(a-d) ChIP assays using anti-TCF-1 antibody or control IgG were performed on naive control CD4+ T cells (CD44loCD62L+CD4+); naive Tcf7−/− CD4+ T cells (GFP+CD44loCD62L+CD4+); WT TFH cells (CXCR5+CD44hiCD62LCD4+); and WT TH1 cells (CXCR5CD44hiCD62LCD4+). TFH and TH1 cells were sorted from B6 mice 8 d after vaccinia virus infection. Quantitation of enriched TCF-1 binding was done at the positive control Axin2 gene (a), the TSS of the Il6ra and Il6st genes (b), the TSS and a −2.8 kb upstream regulatory region of the Bcl6 gene (c), and the TSS of Ascl2 and intron 3 of Prdm1 (d), and data are means ± s.d. from 3 independent experiments. * P < 0.05, ** P < 0.01, *** P < 0.001 (Student’s t-test).

References

    1. Crotty S. A brief history of T cell help to B cells. Nature reviews Immunology. 2015;15(3):185–189. - PMC - PubMed
    1. Ueno H, Banchereau J, Vinuesa CG. Pathophysiology of T follicular helper cells in humans and mice. Nature Immunology. 2015;16(2):142–152. - PMC - PubMed
    1. Crotty S. T follicular helper cell differentiation, function, and roles in disease. Immunity. 2014;41(4):529–542. - PMC - PubMed
    1. Shlomchik MJ, Weisel F. Germinal center selection and the development of memory B and plasma cells. Immunological reviews. 2012;247(1):52–63. - PubMed
    1. Victora GD, Nussenzweig MC. Germinal centers. Annu Rev Immunol. 2012;30:429–457. - PubMed

Publication types

MeSH terms