Automated Peritoneal Dialysis Is Associated with Better Survival Rates Compared to Continuous Ambulatory Peritoneal Dialysis: A Propensity Score Matching Analysis
- PMID: 26214801
- PMCID: PMC4516259
- DOI: 10.1371/journal.pone.0134047
Automated Peritoneal Dialysis Is Associated with Better Survival Rates Compared to Continuous Ambulatory Peritoneal Dialysis: A Propensity Score Matching Analysis
Erratum in
-
Correction: Automated Peritoneal Dialysis Is Associated with Better Survival Rates Compared to Continuous Ambulatory Peritoneal Dialysis: A Propensity Score Matching Analysis.PLoS One. 2015 Sep 14;10(9):e0138382. doi: 10.1371/journal.pone.0138382. eCollection 2015. PLoS One. 2015. PMID: 26368122 Free PMC article. No abstract available.
Abstract
Introduction: The impact of peritoneal dialysis modality on patient survival and peritonitis rates is not fully understood, and no large-scale randomized clinical trial (RCT) is available. In the absence of a RCT, the use of an advanced matching procedure to reduce selection bias in large cohort studies may be the best approach. The aim of this study is to compare automated peritoneal dialysis (APD) and continuous ambulatory peritoneal dialysis (CAPD) according to peritonitis risk, technique failure and patient survival in a large nation-wide PD cohort.
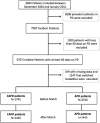
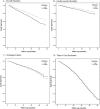
Methods: This is a prospective cohort study that included all incident PD patients with at least 90 days of PD recruited in the BRAZPD study. All patients who were treated exclusively with either APD or CAPD were matched for 15 different covariates using a propensity score calculated with the nearest neighbor method. Clinical outcomes analyzed were overall mortality, technique failure and time to first peritonitis. For all analysis we also adjusted the curves for the presence of competing risks with the Fine and Gray analysis.
Results: After the matching procedure, 2,890 patients were included in the analysis (1,445 in each group). Baseline characteristics were similar for all covariates including: age, diabetes, BMI, Center-experience, coronary artery disease, cancer, literacy, hypertension, race, previous HD, gender, pre-dialysis care, family income, peripheral artery disease and year of starting PD. Mortality rate was higher in CAPD patients (SHR1.44 CI95%1.21-1.71) compared to APD, but no difference was observed for technique failure (SHR0.83 CI95%0.69-1.02) nor for time till the first peritonitis episode (SHR0.96 CI95%0.93-1.11).
Conclusion: In the first large PD cohort study with groups balanced for several covariates using propensity score matching, PD modality was not associated with differences in neither time to first peritonitis nor in technique failure. Nevertheless, patient survival was significantly better in APD patients.
Conflict of interest statement
Figures


References
-
- Oo TN, Roberts TL, Collins AJ (2005) A comparison of peritonitis rates from the United States Renal Data System database: CAPD versus continuous cycling peritoneal dialysis patients. Am J Kidney Dis 45: 372–380. - PubMed
-
- Mujais S, Story K (2006) Patient and technique survival on peritoneal dialysis in patients with failed renal allograft: a case-control study. Kidney Int Suppl: S133–137. - PubMed
Publication types
MeSH terms
LinkOut - more resources
Full Text Sources
Other Literature Sources
Medical

