. 2015 Oct:139:22-36.
doi: 10.1016/j.exer.2015.07.014. Epub 2015 Jul 26.

Loss of DJ-1 elicits retinal abnormalities, visual dysfunction, and increased oxidative stress in mice

Affiliations

Loss of DJ-1 elicits retinal abnormalities, visual dysfunction, and increased oxidative stress in mice

Vera L Bonilha et al. Exp Eye Res. 2015 Oct.

Abstract

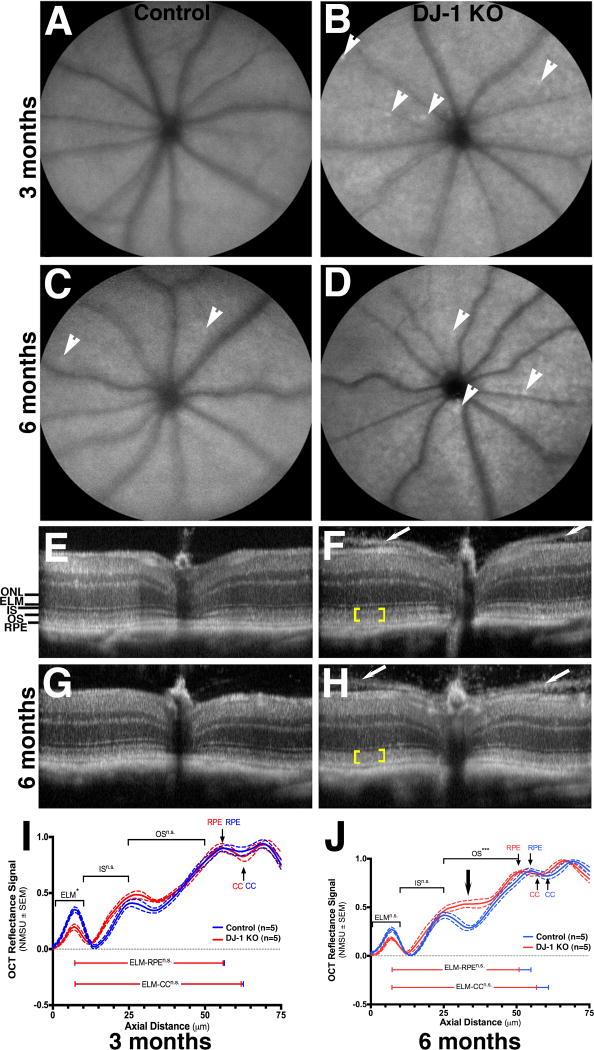
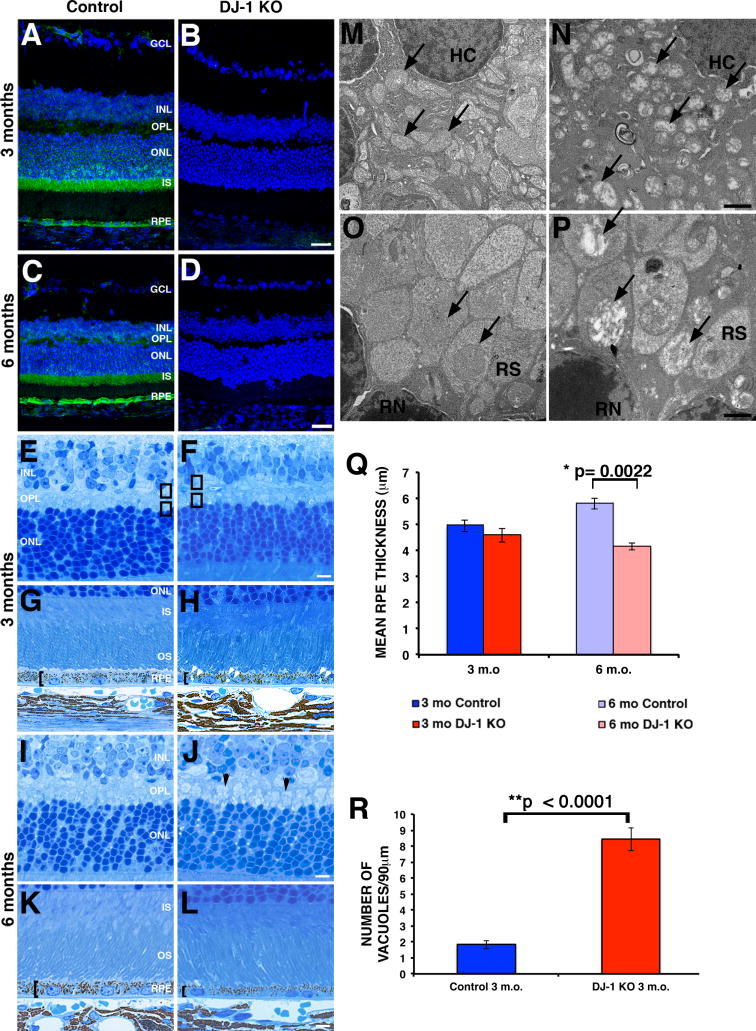
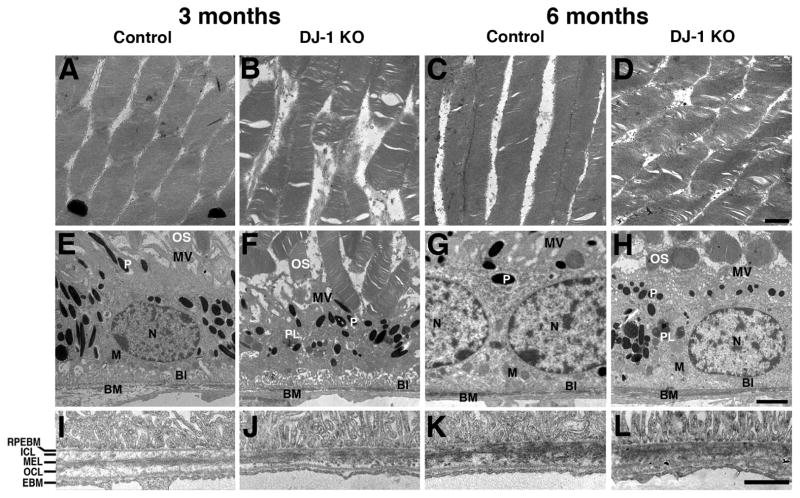
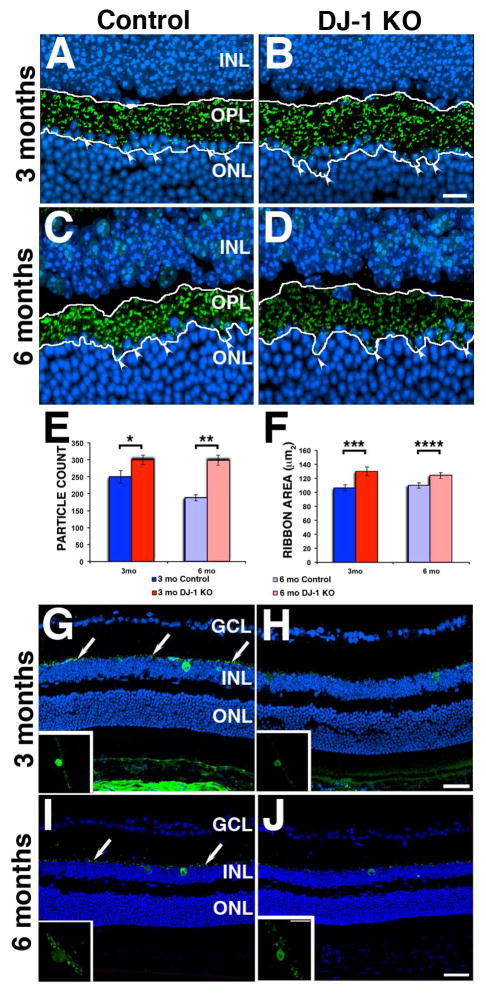
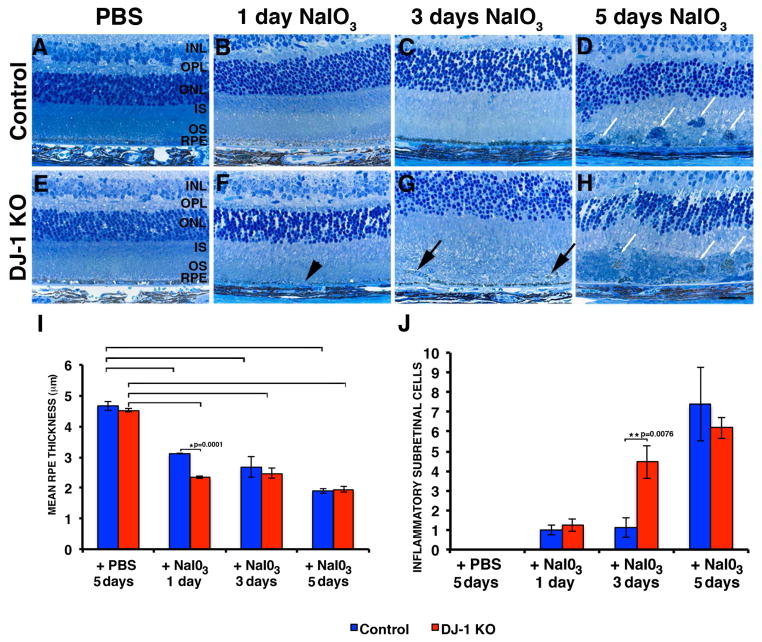
DJ-1/PARK7 mutations or deletions cause autosomal recessive early onset Parkinson's disease (PD). Thus, DJ-1 protein has been extensively studied in brain and neurons. PD patients display visual symptoms; however, the visual symptoms specifically attributed to PD patients carrying DJ-1/PARK7 mutations are not known. In this study, we analyzed the structure and physiology of retinas of 3- and 6-month-old DJ-1 knockout (KO) mice to determine how loss of function of DJ-1 specifically contributes to the phenotypes observed in PD patients. As compared to controls, the DJ-1 KO mice displayed an increase in the amplitude of the scotopic ERG b-wave and cone ERG, while the amplitude of a subset of the dc-ERG components was decreased. The main structural changes in the DJ-1 KO retinas were found in the outer plexiform layer (OPL), photoreceptors and retinal pigment epithelium (RPE), which were observed at 3 months and progressively increased at 6 months. RPE thinning and structural changes within the OPL were observed in the retinas in DJ-1 KO mice. DJ-1 KO retinas also exhibited disorganized outer segments, central decrease in red/green cone opsin staining, decreased labeling of ezrin, broader distribution of ribeye labeling, decreased tyrosine hydroxylase in dopaminergic neurons, and increased 7,8-dihydro-8-oxoguanine-labeled DNA oxidation. Accelerated outer retinal atrophy was observed in DJ-1 KO mice after selective oxidative damage induced by a single tail vein injection of NaIO3, exposing increased susceptibility to oxidative stress. Our data indicate that DJ-1-deficient retinas exhibit signs of morphological abnormalities and physiological dysfunction in association with increased oxidative stress. Degeneration of RPE cells in association with oxidative stress is a key hallmark of age-related macular degeneration (AMD). Therefore, in addition to detailing the visual defects that occur as a result of the absence of DJ-1, our data is also relevant to AMD pathogenesis.

Keywords: Biochemistry; DJ-1 knockout; Histology; Immunohistology; Morphology; Oxidation; Physiology; Retina.


Figures

Fig. 1
Fig. 1. Mild morphological changes in the retinas of DJ-1 KO mice through in vivo structural analysis
A–D: Representative scanning laser ophthalmoscopy (SLO) autofluorescence of the retina of 3-month- (A) and 6-month-old (C) control mice compared to 3-month- (B) and 6-month-old (D) DJ-1 KO mice. White arrowheads show the presence of autofluorescent foci. E–H: Spectral-domain optical coherence tomography (SD-OCT) of the retina of 3 month- (E) and 6 month-old (G) control mice compared to 3-month- (F) and 6-month-old (H) DJ-1 KO mice. Yellow brackets indicate loss of laminar delineation between photoreceptor inner (IS) and outer segments (OS); white arrows indicate the pre-retinal membrane seen on both sides of the optic nerve. I–J: Analysis of a representative normalized OCT mean reflectance signal of photoreceptor (nasal quadrant) vs. axial tissue depth in 3-month- (I) and 6-month-old (J) mice. The photoreceptor signal was subdivided as follows: ELM= external limiting membrane; IS= inner segments; OS= outer segments; RPE= retinal pigment epithelium; CC= choriocapillaris; ONL= outer nuclei layer. Blue line = control mice, red lines = DJ-1 KO mice. P-values= 3 m.o. ELM (0.0197); 6 m.o. ELM (ns); 3 m.o. OS (n.s.); 6 m.o. OS (0.0004). J: black arrow denotes the region of relative change in PL signal, which corresponds to the proximal OS region that is immediately adjacent to the IS/OS junction.
Fig. 2
Fig. 2. Increase in scotopic ERG b-wave and in cone ERG amplitudes of DJ-1 KO mice
Averaged strobe-flash ERG tracings were measured at 3-month- (A) and 6-month-old (B) mice. Dark blue tracing depicts response from 3-month-old control mice, light blue tracing depicts response from 6-month-old control mice, dark red tracing depicts response from 3-month-old DJ-1 KO mice, and light red tracing is the response from 6-month-old DJ-1 KO mice. Plotted ERG a-wave (C) and b-wave (D) amplitudes from control and DJ-1 KO mice in both ages at all of the stimuli analyzed. Representative (E) and plotted (F) light-adapted responses; p<0.004 for the b-wave of 3 month-old DJ-1 KO mice and p<0.0001 for 6 month-old DJ-1 KO mice, p<0.01 for the cone ERG of 3-month-old DJ-1 KO mice in response to 1.4 and 1.9 log cd s/m2 stimuli, p<0.05 for the cone ERG of 6-month-old mice in response to 0.4, 0.9, and 1.9 log cd s/m2 flash stimuli. Dark blue columns = control 3 month-old mice, dark red columns = DJ-1 KO 3 month-old mice; light blue columns = control 6 month-old mice, light red columns = DJ-1 KO 6 month-old mice.
Fig. 3
Fig. 3. Decrease in dc-ERG in the retinas of DJ-1 KO mice
dc-ERG tracings were measured at 3 (A) and 6 (B) months. Dark blue tracing depicts a representative response from 3-month-old control mice, light blue tracing depicts response from 6-month-old control mice, dark red tracing depicts response from 3-month-old DJ-1 KO mice, and light red tracing is the response from 6-month-old DJ-1 KO mice. Plotted ERG c-wave (C), light peak (D), fast oscillation (E) and off-response (F) signals in both control and DJ-1 KO retinas in both ages, *p=0.0039; #p=0.0120. Dark blue columns = control 3 month-old mice, dark red columns = DJ-1 KO 3 month-old mice; light blue columns = control 6 month-old mice, light red columns = DJ-1 KO 6 month-old mice.
Fig. 4
Fig. 4. Morphological abnormalities in the retinas of DJ-1 KO mice
A–D: Confocal microcopy analysis of double immunofluorescent staining of DJ-1 (green) and nuclei (blue) in retina sections from 3- (A) and 6-month-old (C) control, and 3- (B) and 6-month-old (D) DJ-1 KO mice. E–L: Toluidine blue staining of 1 μm plastic sections of retinas from 3-month- (E, G) and 6-month-old (I, K) control mice compared to 3-month- (F, H) and 6-month-old (J, L) DJ-1 KO mice analyzed by bright-field microscopy. M, N, O, P: Representative electron micrographs of the OPL of 3-month-old control (M, O) and DJ-1 KO (N, P) retinas. Q: Plotted data representing the mean RPE thickness ± SEM (n=4). Dark blue columns = control 3 month-old mice, dark red columns = DJ-1 KO 3 month-old mice; light blue columns = control 6 month-old mice, light red columns = DJ-1 KO 6 month-old mice. Asterisks denote statistical significance with respect to control mice (*p=0.0022). R: Plotted data representing the mean number of cytoplasmic vacuoles in the RPE ± SEM (n=3). Asterisks denote statistical significance with respect to control mice calculated by a two-way repeated-measures ANOVA with an alpha of 0.05 (**p<0.0001). Black brackets show RPE thinning; black arrowheads show cone pedicles within the OPL; white double arrowheads show accumulation of vacuoles within the RPE cytoplasm; black arrows show mitochondria in the OPL; black boxes represent areas in the OPL analyzed by electron microscopy. OS, photoreceptor outer segments; IS, photoreceptor inner segments; ONL, outer nuclear layer; OPL, outer plexiform layer; INL, inner nuclear layer; GCL, ganglion cell layer, HC, horizontal cell, RS, rod spherules, RN, rod nuclei. Scale bars A–D: 40μm; E–L: 5 μm; M, N, O, P: 1 μm.
Fig. 5
Fig. 5. Ultrastructural abnormalities in the retinas of DJ-1 KO mice
Representative electron micrographs of the photoreceptor outer segments from 3-month- (A) and 6-month-old (C) control, and 3-month- (B) and 6-month-old (D) DJ-1 KO mice. Representative electron micrographs of RPE from 3-month- (E) and 6-month-old (G) control, and 3-month- (F) and 6-month-old (H) DJ-1 KO mice. I–L: High magnification of retinas of 3-month- (E) and 6-month-old (G) control mice compared to 3-month- (F) and 6-month-old (H) DJ-1 KO mice. P, pigment granules; BI, basal infoldings; BM, Bruch’s membrane; N, nuclei; PL, phagolysosomes; M, mitochondria; RPEBM, RPE basement membrane; ICL, inner collagenous layer; MEL, middle elastic layer; OCL, outer collagenous layer; EBM, choroidal cell basement membrane. Scale bars A–D: 1 μm; E–H: 2 μm; I–L: 1 μm.
Fig. 6
Fig. 6. Abnormalities in RPE and red/green cones in the retinas of DJ-1 KO mice
Representative confocal microscopy images of immunofluorescent staining of cryosections (A–D) and whole-mount (E–F) retinas. Retina sections were labeled with ezrin (RPE marker, green), red/green cone opsin (red), and nuclei (blue) from 3-month- (A) and 6-month-old (C) control, and 3-month- (B) and 6-month-old (D) DJ-1 KO mice. Whole-mounted retinas of 6 month-old control (E) and DJ-1 KO (F) mice were also labeled with red/green cone opsin antibodies. INL, inner nuclear layer; ONL, outer nuclear layer; OS, photoreceptor outer segments. Scale bars: 20 μm.
Fig. 7
Fig. 7. Photoreceptor synaptic terminals and dopaminergic neurons abnormalities in the retinas of DJ-1 KO mice
Representative confocal microscopy images of immunofluorescent staining of ribeye (synaptic ribbon marker, green) and nuclei (blue) in retina sections from 3-month- (A) and 6-month-old (C) control, and 3-month- (B) and 6-month-old (D) DJ-1 KO mice. White arrowheads show ribeye staining in the ONL of the DJ-1 KO mice; white tracing delineates the area of ribeye staining. E: count of ribeye-stained particles in retinas from the samples described above. F: area covered by the ribeye-stained particles in DJ-1 KO mice, dark and light red bars; 3- and 6 month-old control mice, dark and light blue bars, respectively. Data are expressed as the mean ± SEM; n = 4 eyes per group (A–D). p-values obtained using a t-test, *p = 0.0431, ** p = 0.0036, ***p = 0.0145, ****p = 0.0384. G–J: Representative confocal microscopy images of immunofluorescent staining of tyrosine hydroxylase (TH, dopaminergic neurons marker, green) and nuclei (blue) in retina sections from 3-month- (G) and 6-month-old (I) control, and 3-month- (H) and 6-month-old (J) DJ-1 KO mice. Insets represent TH staining in a 35°-view angle. White arrows show axonal TH labeling. INL, inner nuclear layer; OPL, outer plexiform layer; ONL, outer nuclear layer. Scale bars A–D: 10 μm; G–J: 40 μm; insets: 10 μm.
Fig. 8
Fig. 8. Increased oxidative stress and inflammation in the retinas of DJ-1 KO mice
A–D: Representative confocal microscopy images of immunofluorescent staining of Nrf2 (oxidative stress regulator, green), and nuclei (blue) in retina sections from 3-month- (A) and 6-month-old (C) control, and 3-month- (B) and 6-month-old (D) DJ-1 KO mice. E–H: Representative confocal microscopy images of immunofluorescent staining for 8-oxoG (DNA oxidation marker, green), and nuclei (blue) in retina sections from 3-month- (E) and 6-month-old (G) control, and 3-month- (F) and 6-month-old (H) DJ-1 KO analyzed by confocal microscopy. I: Representative immunoblots of 6 month-old retina/RPE lysates from control and DJ-1 KO mice reacted with antibodies to red/green opsin (R/G), TH, Nrf2, ezrin (EZR) and DJ-1. J: Quantification of immunoblots of retina/RPE lysates from control (light blue columns) and DJ-1 KO mice (light red columns). Data expressed as mean relative signal intensity ± SEM (n=3), p-values obtained using a t-test. GCL, ganglion cell layer; IPL, inner plexiform layer; INL, inner nuclear layer; OPL, outer plexiform layer; ONL, outer nuclear layer; IS, photoreceptor inner segments; R/G opsin, red/green cone opsin; TH, tyrosine hydroxylase. Scale bars: 40 μm.
Fig. 9
Fig. 9. Accelerated retinal atrophy after a single tail vein injection of NaIO3 in DJ-1 KO mice
Representative images of toluidine blue staining of 1 μm plastic sections of retinas of both control (E–H) and DJ-1 KO (A–D) mouse retinas shown at 1 (B, F), 3 (C, G), and 5 (D, H) days after injection. Both DJ-1 KO (E) and control (A) mice were also injected with PBS. Black arrowhead indicates area without RPE; black arrows show the presence of cells located in the subretinal space; white arrows indicate immune cells filling extensive areas in the subretinal space. INL, inner nuclear layer; OPL, outer plexiform layer; ONL, outer nuclear layer; IS, photoreceptor inner segments. Scale bars: 10 μm. I: Plotted data representing the mean RPE thickness ± SEM (n=7). Red columns = DJ-1 KO; blue columns = control mice. Asterisks denote statistical significance with respect to control mice (*p=0.0001); brackets denote that mice injected with NaIO3 display statistical difference from mice injected with PBS for both control (p= 0.0001 in mice injected with NaIO3 for 1 day, p=0.0201 in mice injected with NaIO3 for 3 days and p= 0.0001 in mice injected with NaIO3 for 5 days) and DJ-1 KO (p= 0.0001 in mice injected with NaIO3 for 1 day, p=0.0004 in mice injected with NaIO3 for 3 days and p= 0.0001 in mice injected with NaIO3 for 5 days) mice. J: Plotted data depicting the mean number of inflammatory cells in the subretinal space ± SEM (n=7). Asterisks denote statistical significance with respect to control mice (**p=0.0076).

Similar articles

Cited by

References

    1. Abou-Sleiman PM, Healy DG, Quinn N, Lees AJ, Wood NW. The role of pathogenic DJ-1 mutations in Parkinson’s disease. Ann Neurol. 2003;54:283–286. - PubMed
    1. Awatramani G, Wang J, Slaughter MM. Amacrine and ganglion cell contributions to the electroretinogram in amphibian retina. Vis Neurosci. 2001;18:147–156. - PubMed
    1. Beatty S, Koh H, Phil M, Henson D, Boulton M. The role of oxidative stress in the pathogenesis of age-related macular degeneration. Surv Ophthalmol. 2000;45:115–134. - PubMed
    1. Bell BA, Kaul C, Hollyfield JG. A protective eye shield for prevention of media opacities during small animal ocular imaging. Exp Eye Res. 2014;127:280–287. - PMC - PubMed
    1. Bell BA, Kaul C, Rayborn ME, Hollyfield JG. Baseline imaging reveals preexisting retinal abnormalities in mice. Adv Exp Med Biol. 2012;723:459–469. - PubMed

Publication types

MeSH terms