. 2015 Aug 1;29(15):1587-92.
doi: 10.1101/gad.262998.115. Epub 2015 Jul 27.

Paracrine signaling between tumor subclones of mouse SCLC: a critical role of ETS transcription factor Pea3 in facilitating metastasis

Affiliations

Paracrine signaling between tumor subclones of mouse SCLC: a critical role of ETS transcription factor Pea3 in facilitating metastasis

Min-chul Kwon et al. Genes Dev. .

Abstract

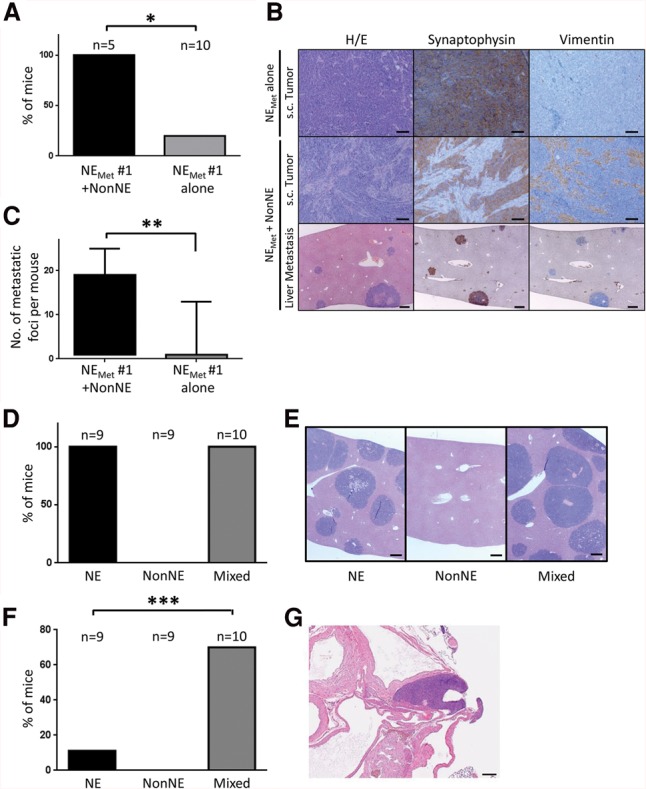
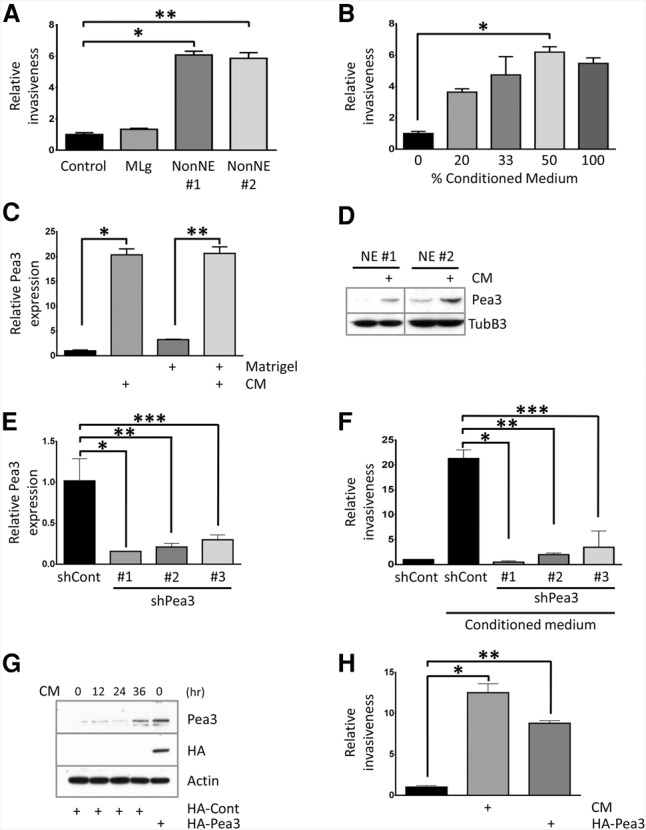
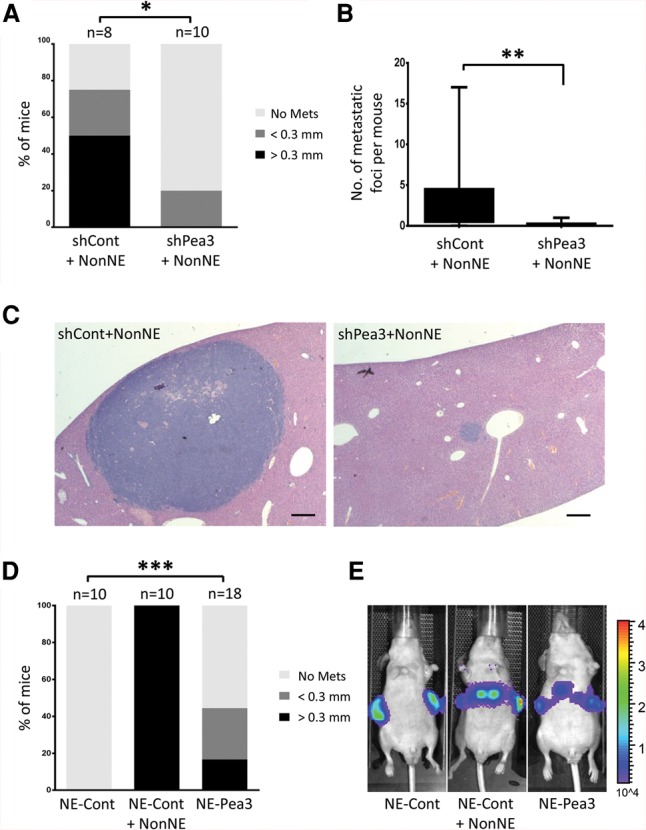
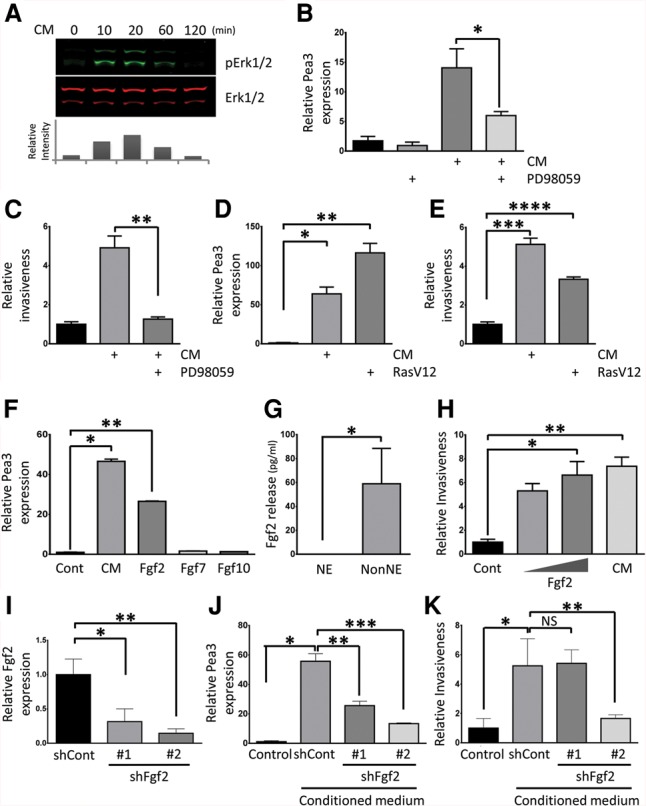
Tumor heterogeneity can create a unique symbiotic tumor microenvironment. Earlier, we showed that clonal evolution in mouse small cell lung cancer (SCLC) can result in subclones that, upon cografting, endow the neuroendocrine tumor cells with metastatic potential. We now show that paracrine signaling between SCLC subclones is a critical requirement in the early steps of the metastatic process, such as local invasion and intravasation. We further show evidence that paracrine signaling via fibroblast growth factor 2 (Fgf2) and Mapk between these diverged tumor subclones causes enhanced expression of the Pea3 (polyomavirus enhancer activator 3) transcription factor, resulting in metastatic dissemination of the neuroendocrine tumor subclones. Our data reveal for the first time paracrine signaling between tumor cell subclones in SCLC that results in metastatic spread of SCLC.

Keywords: Fgf2; Pea3; metastasis; small cell lung cancer; tumor heterogeneity.


Figures

Figure 1.
Figure 1.
Contribution of NonNE cells to metastasis of NE cells in graft experiments. (AC) To determine the autonomous metastatic potential of NE cells from metastases, NE cells were established from liver metastases (NEMET cells). NEMET cells were injected subcutaneously into the flank of Balb/c nude mice either as a pure NE cell population or mixed with NonNE cells. (A) The occurrence of metastasis is expressed as the percentage of the number of mice with liver metastases/number of mice in that group. (B) Photomicrographs showing the morphology (H&E staining) and expression of Synaptophysin and Vimentin of transplanted tumors obtained by subcutaneous injection of NEMET cells alone (top panels) and NEMET + NonNE cells (middle panels). The bottom panels show multiple metastatic tumor nodules in the livers of mice injected subcutaneously with NEMET + NonNE cells. Bars: top, middle, 50 µm; bottom, 200 µm. (C) The number of metastatic foci per mouse from each group of mice. Error bars indicate standard deviation (SD). (*) P < 0.005; (**) P < 0.05. (D,E) The supportive role of NonNE cells in metastasis. (D) NE cells and/or NonNE cells were intravenously injected, and liver metastases were evaluated from three independent experiments. (E) Representative micrographs of H&E-stained liver sections. Bars, 200 µm. (F,G) NonNE cells strongly enhance the formation of mediastinal tumors of NE cells. (F) The number of mice showing the mediastinal tumor formation by intravenous injection of both NE and NonNE cells in comparison with injection of only NE cells. (G) Representative micrographs of H&E-stained mediastinal tumor sections. Error bars indicate SD. Bar, 200 µm. (***) P < 0.02.
Figure 2.
Figure 2.
Conditioned medium from NonNE cells enhances NE cell invasion through the induction of Pea3 expression. (A) Quantification of the relative invasiveness of NE cells upon coculture of NonNE cell clones in the lower compartments of Matrigel-coated modified Boyden chambers compared with complete medium-treated control and coculture of MLg. Shown is a representative experiment from five independent experiments. (*) P < 0.0001; (**) P < 0.0001. (B) Quantification of the relative invasion achieved by different dilutions of conditioned medium from NonNE cells with complete culture medium. Error bars represent the SD. (*) P < 0.0001. (C) Quantitative RT–PCR (qRT–PCR) of Pea3 mRNA expression from NE cells either as a floating suspension cells or in Matrigel. NE cells were cultured with conditioned medium from NonNE cells for 12 h. Pea3 levels are presented relative to β-actin mRNA and compared with their expression levels in complete medium-treated NE cells (onefold). Shown is a representative experiment of five independent experiments using both TaqMan and SYBR Green detection methods. (*) P < 0.005; (**) P < 0.005. (D) Western blotting for Pea3 in conditioned medium-treated NE cell clones. Tubulin β-3 was used for the loading control. A similar result was obtained from two independent experiments. (E) Inhibition of Pea3 expression by three individual shRNA lentiviral constructs targeting Pea3 mRNA in conditioned medium-treated NE cells for 12 h. Data are representative of three independent experiments. (*) P < 0.01; (**) P < 0.01; (***) P < 0.02. (F) Matrigel invasion assay of NE cells expressing shRNA targeting Pea3. Data are representative of three independent experiments. (*) P < 0.005; (**) P < 0.005; (***) P < 0.05. (G,H) Constitutive Pea3 overexpression mediates invasiveness of NE cells. (G) Expression of Pea3 was confirmed by Western blot for Pea3 and tagged HA, and the expression level of Pea3 was compared with endogenously induced Pea3. Actin was used as the loading control. Constitutive overexpression of Pea3 increases the invasion activity of NE cells in the absence of conditioned medium. (H) Data are representative of two independent experiments. (*) P < 0.0001; (**) P < 0.0001.
Figure 3.
Figure 3.
Knockdown of Pea3 in NE cells strongly impairs tumor cell metastasis, and Pea3 overexpression boosts metastasis of NE cells in vivo. (A) The percentage of mice with liver metastases was analyzed by histology. The liver metastases were divided into two sizes: <0.3 mm and >0.3 mm. (*) P < 0.02. (B) The total number of liver metastases was quantified. Statistical significance was determined by Student's t-test. (**) P < 0.01. (C) Representative H&E-stained images of liver sections. Bars, 200 µm. (D,E) A constitutively Pea3- and luciferase-overexpressing NE cell clone was injected subcutaneously into the flanks of Balb/c nude mice. Either control plasmid-overexpressing NE (NE-Cont) cells or mixed NE-Cont and NonNE cells were transplanted as a control group. (D) Statistical significance was determined by Student's t-test. (***) P < 0.01. (E) Representative bioluminescence images for in vivo detection of liver metastasis.
Figure 4.
Figure 4.
Pea3 expression and invasiveness are induced by fibroblast growth factor (Fgf)/Ras/Mapk pathway activation in NE cells. (A) Erk1/2 activation in NE cells measured after treatment with serum-free conditioned medium from NonNE cells. Samples were immunoblotted with the antibodies against phospho-Erk1/2 (pErk1/2) and total Erk (Erk1/2). The relative intensity of pErk1/2 was normalized to total Erk1/2 using Odyssey software (LI-COR) and is plotted as the fold increase of Erk1/2 phosphorylation as compared with unstimulated NE cells. A similar result was obtained in two independent experiments. (B,C) The effect of MEK1 inhibitor PD98059 on Pea3 expression and invasion of NE cells. (B) NE cells were treated with 50 µM PD98059 and/or conditioned medium from NonNE cells for 12 h, and Pea3 expression was determined by qPCR analysis. (C) NE cells were assayed for their ability to invade Matrigel in the presence of 50 µM PD98059 and conditioned medium from NonNE cells. Data are representative of three independent experiments. (*) P < 0.02; (**) P < 0.02. (D,E) Constitutive Ras activation induces Pea3 expression and invasiveness of NE cells. (D) Lentivirus-mediated overexpression of RasV12 in NE cells induced expression of Pea3 by qPCR in the absence of conditioned medium. (E) Matrigel invasion of constitutive RasV12-expressing NE cells in the absence of conditioned medium treatment. Data are representative of three independent experiments. (*) P < 0.005; (**) P < 0.005; (***) P < 0.01; (****) P < 0.01. (F) Fgf2 induces the expression of Pea3 in NE cells. qRT–PCR was performed to detect the amount of induced Pea3 mRNA in NE cells after treatment with Fgf2, Fgf7, or Fgf10 for 12 h. Data are representative of three independent experiments. (*) P < 0.001; (**) P < 0.0001. (G) Levels of mouse Fgf2 were measured using ELISAs in conditioned medium harvested from NE and NonNE cell clones. Data represent mean ± SEM. Data are representative of three independent experiments. (*) P < 0.01. (H) Effect of Fgf2 (low amount, 1 ng/mL; high amount, 10 ng/mL) on invasion of NE cells in Matrigel. Conditioned medium from NonNE cells was used as a positive control. Data are representative of three independent experiments. (*) P < 0.005; (**) P < 0.001. (I) Inhibition of Fgf2 expression by two distinct shRNA lentiviral constructs in NonNE cells. Data are representative of three independent experiments. (*) P < 0.05; (**) P < 0.005. (J) Conditioned medium from Fgf2 knockdown NonNE cells were used to treat NE cells for 12 h, and Pea3 mRNA expression was measured by qPCR. Data are representative of three independent experiments. (*) P < 0.0001; (**) P < 0.001; (***) P < 0.0001. (K) Quantification of relative invasion of NE cells achieved by conditioned medium from Fgf2 knockdown NonNE cells. Data are representative of two independent experiments. (NS) Not significant. (*) P < 0.005; (**) P < 0.01.

Comment in

References

    1. Anderson K, Lutz C, van Delft FW, Bateman CM, Guo Y, Colman SM, Kempski H, Moorman AV, Titley I, Swansbury J, et al. 2011. Genetic variegation of clonal architecture and propagating cells in leukaemia. Nature 469: 356–361. - PubMed
    1. Aytes A, Mitrofanova A, Kinkade CW, Lefebvre C, Lei M, Phelan V, LeKaye HC, Koutcher JA, Cardiff RD, Califano A, et al. 2013. ETV4 promotes metastasis in response to activation of PI3-kinase and Ras signaling in a mouse model of advanced prostate cancer. Proc Natl Acad Sci 110: E3506–E3515. - PMC - PubMed
    1. Brent AE, Tabin CJ. 2004. FGF acts directly on the somitic tendon progenitors through the Ets transcription factors Pea3 and Erm to regulate scleraxis expression. Development 131: 3885–3896. - PubMed
    1. Burrell RA, Swanton C. 2014. Tumour heterogeneity and the evolution of polyclonal drug resistance. Mol Oncol 8: 1095–1111. - PMC - PubMed
    1. Calbo J, van Montfort E, Proost N, van Drunen E, Beverloo HB, Meuwissen R, Berns A. 2011. A functional role for tumor cell heterogeneity in a mouse model of small cell lung cancer. Cancer Cell 19: 244–256. - PubMed

Publication types

MeSH terms

Substances

LinkOut - more resources