. 2015 Jul 29:14:138.
doi: 10.1186/s12943-015-0408-z.

Epiregulin contributes to breast tumorigenesis through regulating matrix metalloproteinase 1 and promoting cell survival

Affiliations

Epiregulin contributes to breast tumorigenesis through regulating matrix metalloproteinase 1 and promoting cell survival

Mariya Farooqui et al. Mol Cancer. .

Abstract

Background: The epidermal growth factor (EGF) family of ligands has been implicated in promoting breast cancer initiation, growth and progression. The contributions of EGF family ligands and their receptors to breast cancer are complex, and the specific mechanisms through which different ligands regulate breast tumor initiation and growth are not well-defined. These studies focus on the EGF family member epiregulin (EREG) as a mediator of early stage breast tumorigenesis.

Methods: EREG expression levels were assessed in both cell lines and human samples of ductal carcinoma in situ (DCIS) using quantitative RT-PCR, ELISA and immunohistochemistry. Gene knock-down approaches using shRNA-based strategies were used to determine the requirement of EREG for growth of MCF10DCIS cells in vivo, and for identifying mechanisms through which EREG promotes tumor cell survival. Experiments were performed using a combination of two-dimensional culture, three-dimensional culture and tumor growth in vivo.

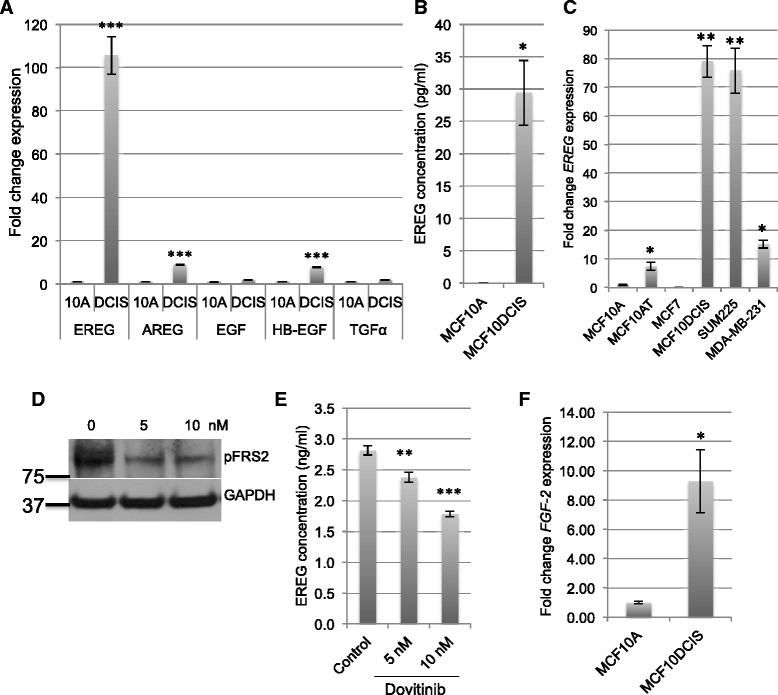
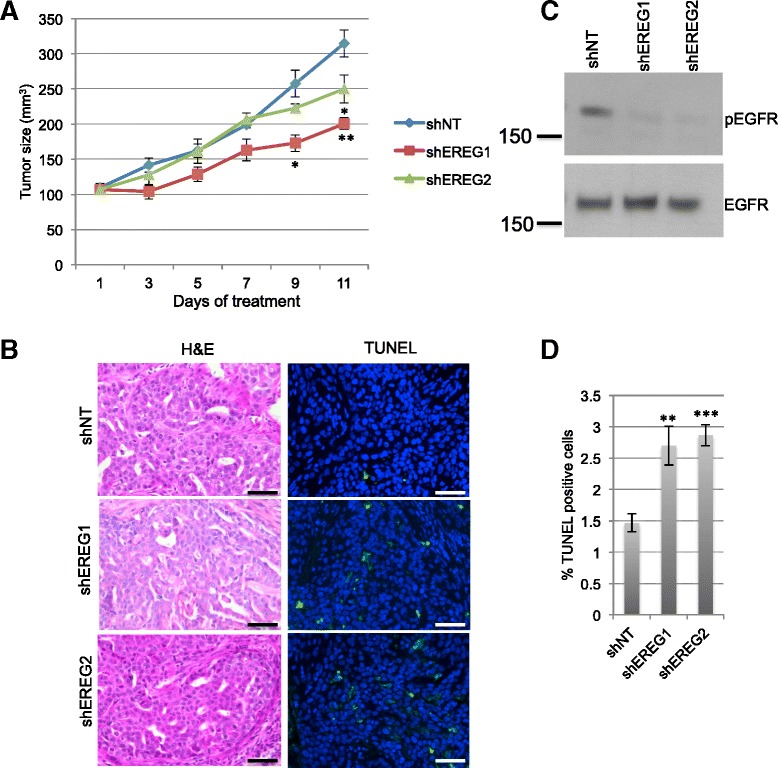
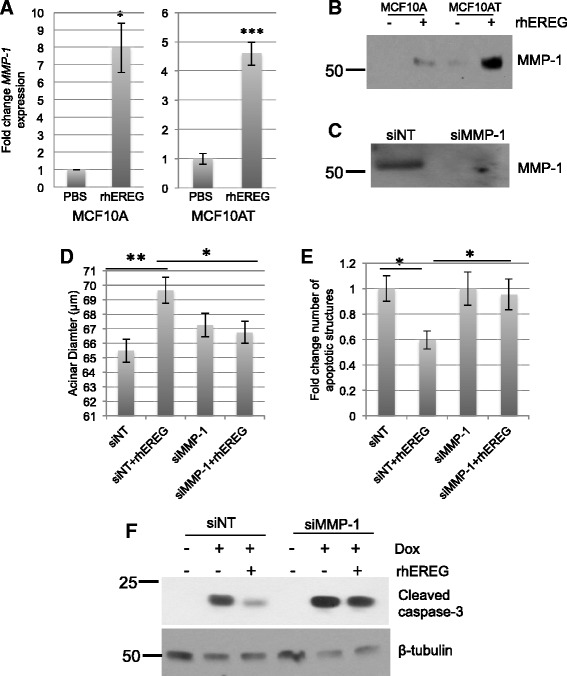
Results: In comparison with other EGF family members, EREG was induced in MCF10DCIS cells compared with MCF10A and MCF10AT cells and its expression was partially regulated by fibroblast growth factor receptor (FGFR) activity. Reduced EREG expression in MCF10DCIS cells led to decreased tumor growth in vivo, which was associated with reduced cell survival. Furthermore, treatment of MCF10A cells with exogenous EREG enhanced cell survival both in three-dimensional culture and in response to chemotherapeutic agents. Examination of EREG-induced signaling pathways demonstrated that EREG promoted survival of MCF10A cells through regulating expression of matrix metalloproteinase-1 (MMP-1). To determine the relevance of these findings in human tumors, samples of DCIS were analyzed for EREG and MMP-1 expression. EREG was induced in DCIS lesions compared to normal breast epithelium, and EREG and MMP-1 were correlated in a subset of DCIS samples.

Conclusions: Together, these studies lead to identification of a novel pathway involving EREG and MMP-1 that contributes to the formation of early stage breast cancer. Understanding these complex pathways could ultimately lead to the development of novel biomarkers of neoplastic progression and/or new therapeutic strategies for patients with early stage cancer.


Figures

Fig. 1
Fig. 1
Regulation of EREG expression in MCF10DCIS cells by FGFR activity. a qRT-PCR of the indicated EGF ligands was performed on RNA isolated from MCF10A cells and MCF10DCIS cells. Expression levels were normalized to levels of CYBP. b Soluble levels of EREG in conditioned media obtained from MCF10A and MCF10DCIS cells as determined by ELISA. c qRT-PCR of the EREG expression was performed on RNA isolated from the indicated cell lines. d Immunoblot analysis was performed to examine the effects of the indicated amounts of dovitinib on phosphorylation of FRS-2 in MCF10DCIS cells. e Concentration of EREG in conditioned media, as determined by ELISA, from MCF10DCIS cells treated with the indicated amounts of dovitinib for 18 h. f qRT-PCR analysis of FGF-2 expression in MCF10A and MCF10DCIS cells. Levels normalized to CYBP. *p < 0.05, **p < 0.001, ***p < 0.0001
Fig. 2
Fig. 2
Decreased expression of EREG leads to reduced acinar growth in vitro. a MCF10DCIS cells were transduced with either non-targeting (NT) or two different EREG shRNA constructs. Expression levels of EREG were determined by qRT-PCR and normalized to levels of CYBP. b Quantification of acinar size. c Quantification of apoptotic structures. d MCF10DCIS cells expressing either NT shRNA or shEREG were plated in Matrigel and allowed to establish for 4 days followed by treatment with 1 μg/ml doxycycline for an additional 4 days. Upper panels show images obtained by light microscopy. Lower panels show apoptotic cells within structures visualized by TUNEL staining. Scale bars represent 200 μm. *p < 0.01, **p < 0.005
Fig. 3
Fig. 3
Decreased expression of EREG leads to reduced tumor growth in vivo. a 50,000 MCF10DCIS-shNT, MCF10DCIS-shEREG1 or MCF10DCIS-shEREG1 cells were injected subcutaneously into nude mice. Once tumors reached 100 mm3, mice were provided doxycycline. Tumors were measured every other day. b Tumors harvested, sectioned and stained with hematoxylin and eosin (H&E). TUNEL analysis was performed to identify apoptotic cells (green). Scale bars represent 50 μm. c Immunoblot analysis was performed on protein samples isolated from pooled tumors to detect pEGFR. Immunoblotting of total EGFR was performed to assess equal loading. d Quantification of TUNEL-positive cells in tumors from (a). n = 4 tumors per construct. *p < 0.05, **p < 0.005, ***p < 0.0001
Fig. 4
Fig. 4
EREG promotes survival of MCF10A cells in 3D culture and in response to chemotherapeutic agents. a MCF10A and MCF10AT cells were plated in recombinant basement membrane in the presence of either 10 ng/ml rhEREG or solvent control (PBS). Light microscopy was used to examine effects of EREG on acinar morphology. Structures were stained for cleaved caspase-3 (green) and DAPI (blue) and analyzed by confocal microscopy. Scale bars represent 100 μm (MCF10A) and 200 μm (MCF10AT). b Quantification of acinar diameter of MCF10A structures. c Quantification of MCF10A structures with at least one cleaved caspase-3 positive cell. d Quantification of acinar diameter of MCF10AT structures. e Quantification of MCF10AT structures with at least one cleaved caspase-3 positive cell. *p < 0.05, **p < 0.001
Fig. 5
Fig. 5
MMP-1 contributes to EREG-induced survival of MCF10A cells. a qRT-PCR analysis of MMP-1 gene expression in MCF10A and MCF10AT cells treated with either solvent (PBS) or 10 ng/ml rhEREG. Expression levels of MMP-1 were normalized to levels of CYBP. b Immunoblot analysis of MMP-1 protein in conditioned media obtained from MCF10A and MCF10AT cells following 24 h of rhEREG treatment. Loading was assessed by Coomassie staining (Additional file 1: Figure S1A). c Immunoblot analysis of MMP-1 protein in conditioned media obtained from MCF10A cells treated with either non-targeting (NT) or MMP-1 siRNA following 24 h of rhEREG treatment. Loading was assessed by Coomassie staining (Additional file 1: Figure S1B). d Quantification of acinar diameter of structures. MCF10A cells were transfected with either NT or MMP-1 siRNA prior to plating in recombinant basement membrane with either solvent (PBS) or 10 ng/ml rhEREG. e Quantification of apoptotic structures. Structures that were positive for at least one cleaved caspase-3 positive cell were counted. f MCF10A cells were treated with non-targeting (NT) or MMP-1 siRNA, serum starved and treated with solvent control (PBS) or with 10 ng/ml rhEREG in the presence or absence of 2 μM doxorubicin (Dox). Effects on apoptosis were assessed by immunoblot analysis for cleaved caspase-3. β-tubulin is shown as a loading control. *p < 0.05, **p < 0.001, ***p < 0.0001
Fig. 6
Fig. 6
EREG expression correlates with MMP-1 levels in human DCIS lesions. a qRT-PCR analysis of MMP-1 gene expression in MCF10A and MCF10DCIS cells. Expression levels of MMP-1 are normalized to CYBP. b Immunoblot analysis of MMP-1 in conditioned media obtained from MCF10A and MCF10DCIS cells. Loading was assessed by Coomassie staining (Additional file 1: Figure S1C). c qRT-PCR analysis of MMP-1 gene expression in MCF10DCIS cells expressing either NT or EREG shRNA constructs. Expression levels of MMP-1 are normalized to CYBP. d Immunohistochemistry of normal breast tissue and DCIS stained with an anti-EREG antibody. Scale bars represent 50 μm. e Normal and DCIS human samples were stained with an anti-MMP-1 antibody. Representative images of normal and varying levels of MMP-1 staining in DCIS lesions are shown. f Quantification of the percent of samples staining positive for EREG. g Quantification of the percent of samples staining positive for MMP-1. Scale bars represent 50 μm. *p < 0.05. ***p < 0.0001

References

    1. Hanahan D, Weinberg RA. Hallmarks of cancer: the next generation. Cell. 2011;144(5):646–74. doi: 10.1016/j.cell.2011.02.013. - DOI - PubMed
    1. Boyle DP, Mullan P, Salto-Tellez M. Molecular mapping the presence of druggable targets in preinvasive and precursor breast lesions: a comprehensive review of biomarkers related to therapeutic interventions. Biochim Biophys Acta. 2013;1835(2):230–42. - PubMed
    1. Arteaga CL, Engelman JA. ERBB receptors: from oncogene discovery to basic science to mechanism-based cancer therapeutics. Cancer Cell. 2014;25(3):282–303. doi: 10.1016/j.ccr.2014.02.025. - DOI - PMC - PubMed
    1. Hynes NE, Lane HA. ERBB receptors and cancer: the complexity of targeted inhibitors. Nat Rev Cancer. 2005;5(5):341–54. doi: 10.1038/nrc1609. - DOI - PubMed
    1. Hynes NE, MacDonald G. ErbB receptors and signaling pathways in cancer. Curr Opin Cell Biol. 2009;21(2):177–84. doi: 10.1016/j.ceb.2008.12.010. - DOI - PubMed

Publication types

MeSH terms