. 2016 Jan:76:42-52.
doi: 10.1016/j.vph.2015.07.011. Epub 2015 Jul 26.

Pharmacological evidence for a role of the transient receptor potential canonical 3 (TRPC3) channel in endoplasmic reticulum stress-induced apoptosis of human coronary artery endothelial cells

Affiliations

Pharmacological evidence for a role of the transient receptor potential canonical 3 (TRPC3) channel in endoplasmic reticulum stress-induced apoptosis of human coronary artery endothelial cells

Prince T Ampem et al. Vascul Pharmacol. 2016 Jan.

Abstract

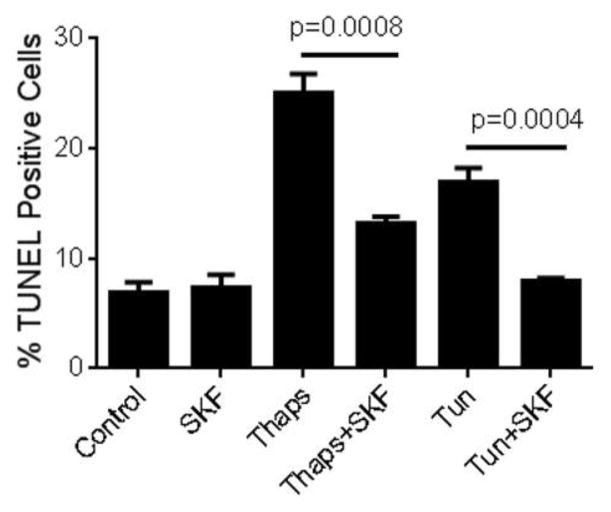
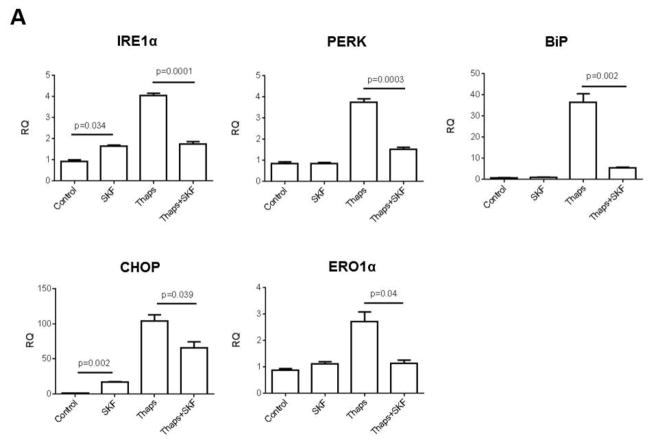
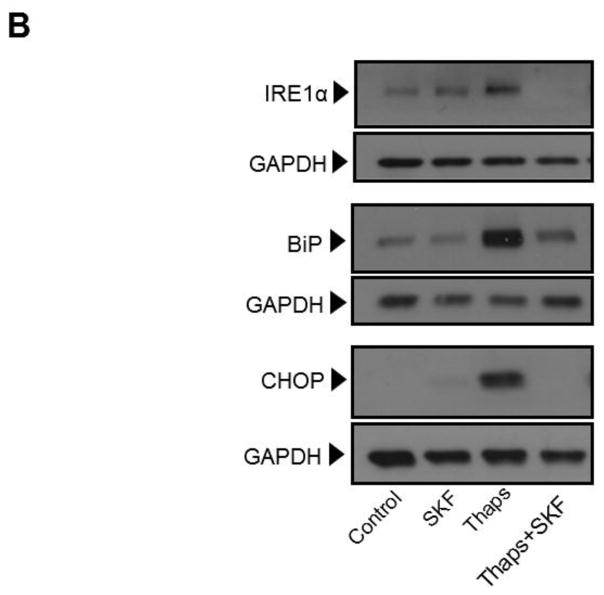
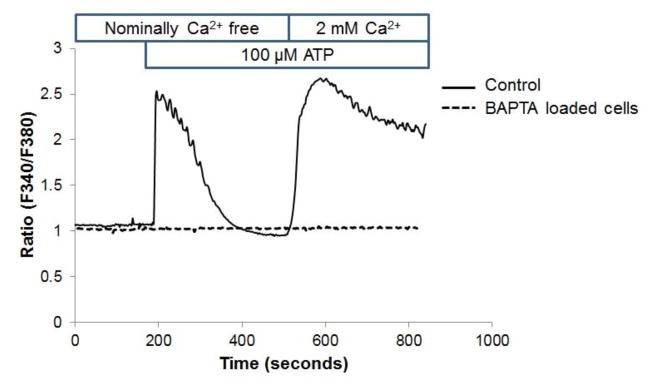
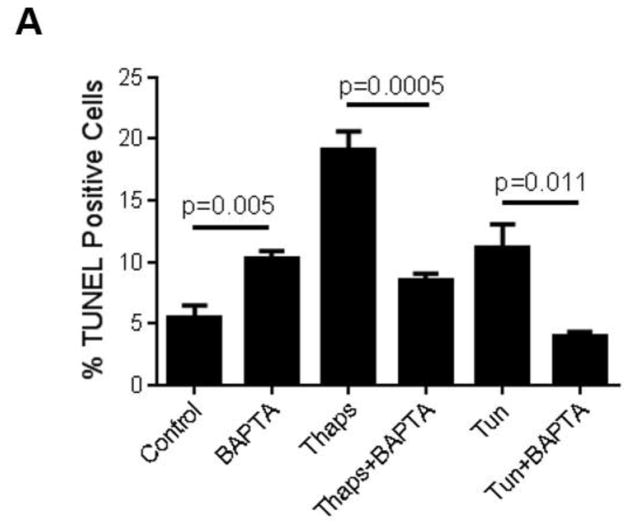
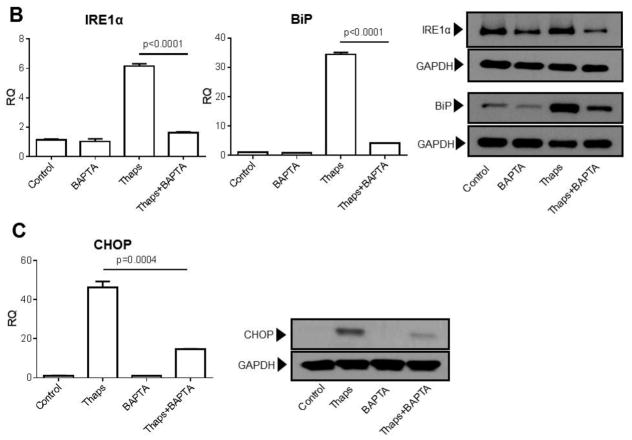
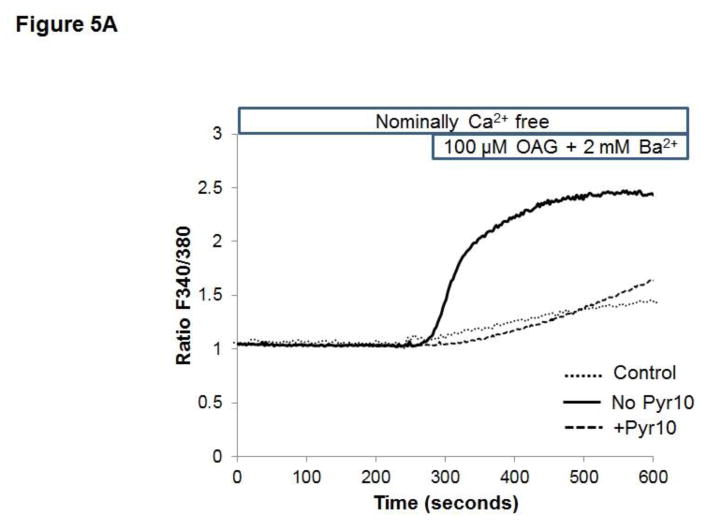
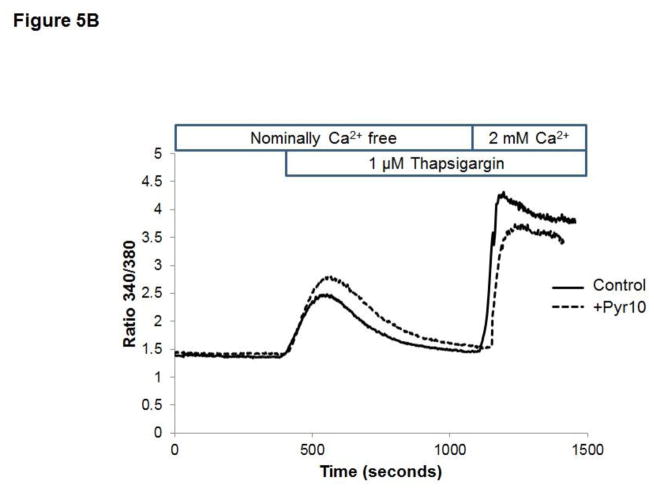
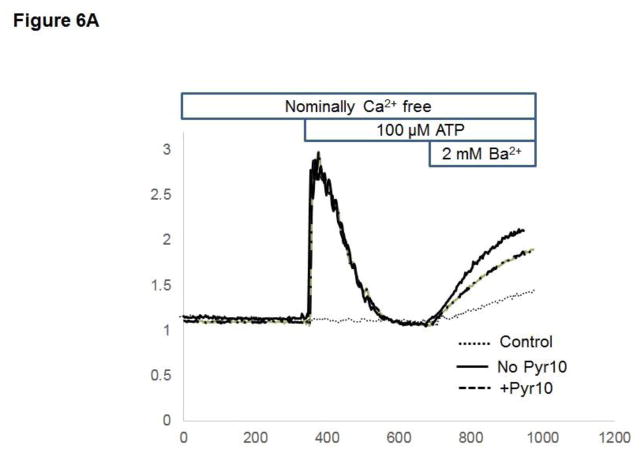
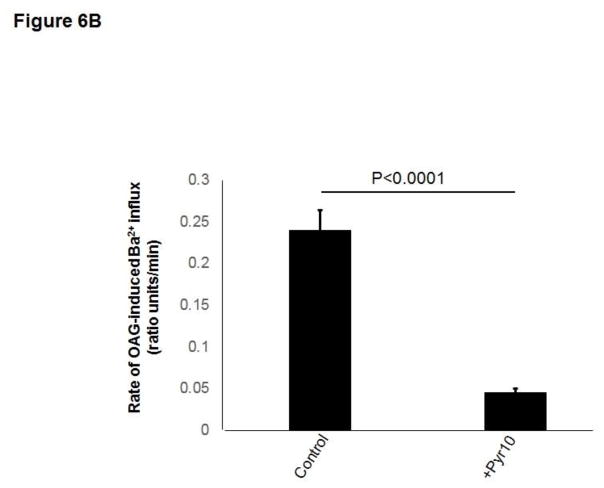
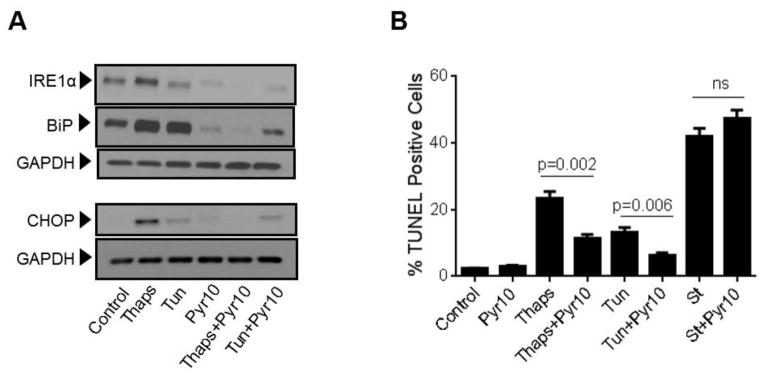
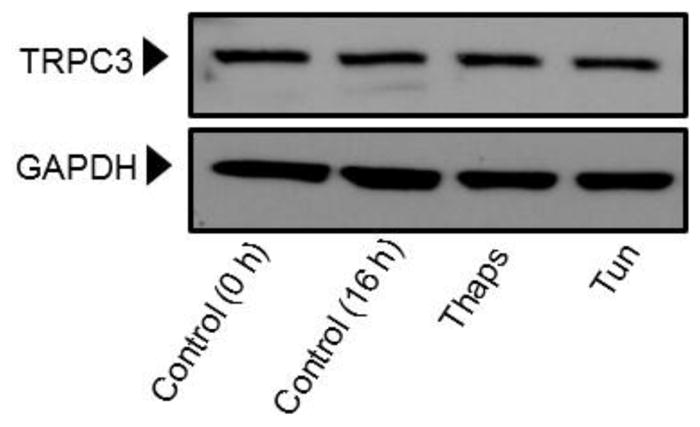
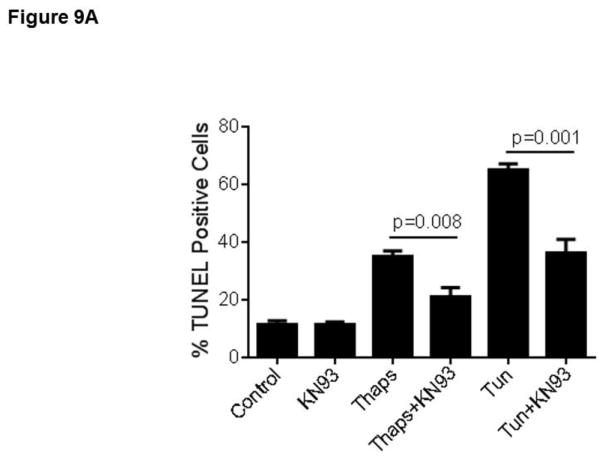
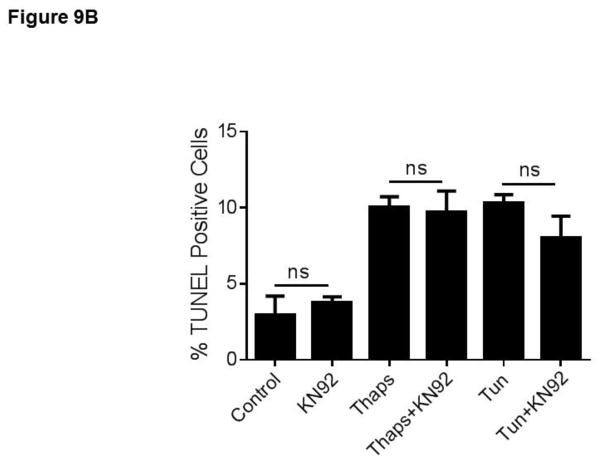
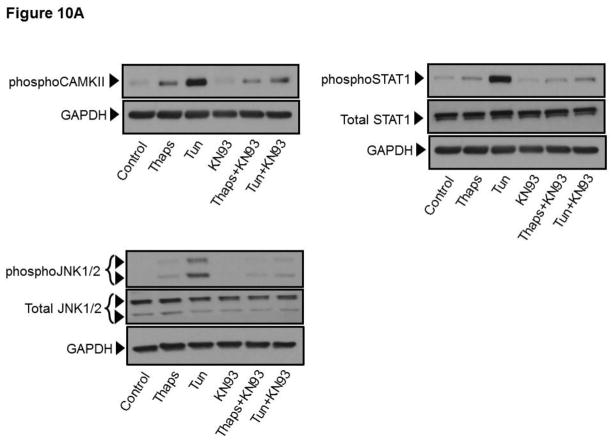
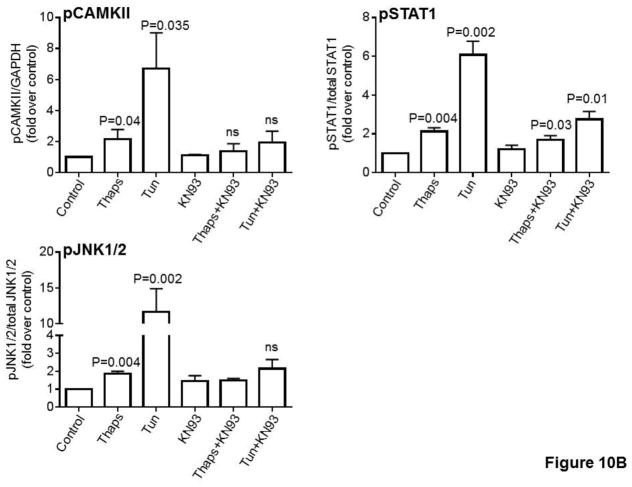
Unresolved endoplasmic reticulum (ER) stress, with the subsequent persistent activation of the unfolded protein response (UPR) is a well-recognized mechanism of endothelial cell apoptosis with a major impact on the integrity of the endothelium during the course of cardiovascular diseases. As in other cell types, Ca(2+) influx into endothelial cells can promote ER stress and/or contribute to mechanisms associated with it. In previous work we showed that in human coronary artery endothelial cells (HCAECs) the Ca(2+)-permeable non-selective cation channel Transient Receptor Potential Canonical 3 (TRPC3) mediates constitutive Ca(2+) influx which is critical for operation of inflammatory signaling in these cells, through a mechanism that entails coupling of TRPC3 constitutive function to activation of Ca(2+)/calmodulin-dependent protein kinase II (CAMKII). TRPC3 has been linked to UPR signaling and apoptosis in cells other than endothelial, and CAMKII is a mediator of ER stress-induced apoptosis in various cell types, including endothelial cells. In the present work we used a pharmacological approach to examine whether in HCAECs TRPC3 and CAMKII also contribute to mechanisms of ER stress-induced apoptosis. The findings show for the first time that in HCAECs activation of the UPR and the subsequent ER stress-induced apoptosis exhibit a strong requirement for constitutive Ca(2+) influx and that TRPC3 contributes to this process. In addition, we obtained evidence indicating that, similar to its roles in non-endothelial cells, CAMKII participates in ER stress-induced apoptosis in HCAECs.

Keywords: Endoplasmic reticulum stress; Endothelial cell apoptosis; TRPC3 channels.


Figures

Figure 1
Figure 1
Human coronary artery endothelial cells (HCAECs) were maintained in endothelial basal medium (EBM-2) alone (Control) or EBM-2 containing thapsigargin (“Thaps”, 1 μM) or tunicamycin (“Tun”, 10 μg/ml) for 24 hours in the presence or absence of the non-selective channel blocker SKF96,365 (“SKF”, 30 μM), and then processed for in vitro TUNEL assay. Treatment with SKF alone was included as a control. P values for the differences between treatments with and without SKF are shown. Differences between treatments with thapsigargin or tunicamycin and the control had P <0.0001. All values are mean ± SEM (n=3–5).
Figure 2
Figure 2
HCAECs were maintained in EBM-2 alone (Control) or EBM-2 containing the ER stressor thapsigargin (“Thaps”, 1 μM) for 24 hours in the presence or absence of SKF96,365 (“SKF”, 30 μM); treatment with SKF alone was included as a control. In A), following treatments total RNA and cDNA were prepared as described in Methods. Expression levels of the UPR components IRE1α, PERK, BiP, CHOP and ERO1α were examined by qRT-PCR. Graphs represent mean ± SEM of at least three independent experiments performed in triplicates. B) After the treatments described above, cells were processed for immunodetection of IRE1α (~130 kDa), BiP (~75 kDa) or CHOP (~27 kDa) in whole cell lysates. Membranes were reprobed for GAPDH (~37 kDa) to control for protein loading. Blots are representative of three independent experiments.
Figure 2
Figure 2
HCAECs were maintained in EBM-2 alone (Control) or EBM-2 containing the ER stressor thapsigargin (“Thaps”, 1 μM) for 24 hours in the presence or absence of SKF96,365 (“SKF”, 30 μM); treatment with SKF alone was included as a control. In A), following treatments total RNA and cDNA were prepared as described in Methods. Expression levels of the UPR components IRE1α, PERK, BiP, CHOP and ERO1α were examined by qRT-PCR. Graphs represent mean ± SEM of at least three independent experiments performed in triplicates. B) After the treatments described above, cells were processed for immunodetection of IRE1α (~130 kDa), BiP (~75 kDa) or CHOP (~27 kDa) in whole cell lysates. Membranes were reprobed for GAPDH (~37 kDa) to control for protein loading. Blots are representative of three independent experiments.
Figure 3
Figure 3
In HCAECs stimulation of P2Y2 receptors with ATP induces a typical biphasic Ca2+ response consisting of a transient phospholipase C-dependent IP3-mediated release of Ca2+ from internal Ca2+ stores (first phase) followed by Ca2+ influx (second phase) across the plasma membrane (Smedlund and Vazquez, 2008). This response is illustrated in this figure. Fura-2 loaded HCAECs were challenged with ATP (100 μM) in nominally Ca2+-free medium to induce the first phase of the Ca2+ response; once the Ca2+ transient was over, Ca2+ (2 mM) was added to the bath to make evident the second, Ca2+ influx phase. Alternatively, the cells were loaded with 10 μM BAPTA/AM (as described in Methods) before being loaded with Fura-2 and subjected to the protocol described above (discontinuous trace). Traces are averages of 18–21 cells and are representative of 3 independent experiments.
Figure 4
Figure 4
HCAECs were maintained during 16 h in EBM-2 alone (Control) or EBM-2 containing thapsigargin (“Thaps”, 1 μM) or tunicamycin (“Tun”, 10 μg/ml), as indicated; alternatively, the cells were loaded with 10 μM BAPTA/AM (as described in Methods), washed and then kept for 16 h in EBM-2 alone (“BAPTA” control) or EBM-2 containing thapsigargin (“Thaps+BAPTA”) or tunicamycin (“Tun+BAPTA) at the concentrations indicated above. In A), the cells were processed for in vitro TUNEL assay. Differences between “Thaps” and “Tun” treatments and their corresponding control (“Control”) had P <0.0001. All values are mean ± SEM (n=3–5). In B) and C), following treatments expression levels of the UPR components IRE1α and BiP (B), or of the UPR-induced transcriptional factor CHOP (C), were examined by qRT-PCR and by immunoblotting. Bar graphs represent data (mean ± SEM) of at least three independent experiments, each performed in triplicates. Apparent molecular weights are as follows: IRE1α (~130 kDa), BiP (~75 kDa) and CHOP (~27 kDa). Membranes were reprobed for GAPDH (~37 kDa) to control for protein loading. Blots are representative of three independent experiments.
Figure 4
Figure 4
HCAECs were maintained during 16 h in EBM-2 alone (Control) or EBM-2 containing thapsigargin (“Thaps”, 1 μM) or tunicamycin (“Tun”, 10 μg/ml), as indicated; alternatively, the cells were loaded with 10 μM BAPTA/AM (as described in Methods), washed and then kept for 16 h in EBM-2 alone (“BAPTA” control) or EBM-2 containing thapsigargin (“Thaps+BAPTA”) or tunicamycin (“Tun+BAPTA) at the concentrations indicated above. In A), the cells were processed for in vitro TUNEL assay. Differences between “Thaps” and “Tun” treatments and their corresponding control (“Control”) had P <0.0001. All values are mean ± SEM (n=3–5). In B) and C), following treatments expression levels of the UPR components IRE1α and BiP (B), or of the UPR-induced transcriptional factor CHOP (C), were examined by qRT-PCR and by immunoblotting. Bar graphs represent data (mean ± SEM) of at least three independent experiments, each performed in triplicates. Apparent molecular weights are as follows: IRE1α (~130 kDa), BiP (~75 kDa) and CHOP (~27 kDa). Membranes were reprobed for GAPDH (~37 kDa) to control for protein loading. Blots are representative of three independent experiments.
Figure 5
Figure 5
A) Fura-2 loaded HEK293 cells stably overexpressing the human TRPC3 (Vazquez et al., 2004b) were maintained in nominally Ca2+-free medium and, when indicated, OAG (100 μM) and Ba2+ (2 mM) were added to the bath to evidence OAG-induced TRPC3-mediated Ba2+ influx. Alternatively, cells were subjected to the same protocol but in the presence of the TRPC3 selective blocker Pyr10 (2 μM) as indicated. Traces are averages of 10–20 cells and are representative of 3 independent experiments. Values for rates of Ba2+ influx are provided in the text. B) Fura-2 loaded HCAECs were exposed to the SERCA inhibitor thapsigargin (1 μM) in nominally Ca2+-free medium to deplete intracellular Ca2+ stores. Once the Ca2+ transient was over, Ca2+ (2 mM) was added to the bath to evidence the store-operated Ca2+ influx. Alternatively, cells were subjected to the same protocol but in the presence of the TRPC3 selective blocker Pyr10 (2 μM) as indicated. Traces are averages of 18–22 cells and are representative of 3 independent experiments.
Figure 5
Figure 5
A) Fura-2 loaded HEK293 cells stably overexpressing the human TRPC3 (Vazquez et al., 2004b) were maintained in nominally Ca2+-free medium and, when indicated, OAG (100 μM) and Ba2+ (2 mM) were added to the bath to evidence OAG-induced TRPC3-mediated Ba2+ influx. Alternatively, cells were subjected to the same protocol but in the presence of the TRPC3 selective blocker Pyr10 (2 μM) as indicated. Traces are averages of 10–20 cells and are representative of 3 independent experiments. Values for rates of Ba2+ influx are provided in the text. B) Fura-2 loaded HCAECs were exposed to the SERCA inhibitor thapsigargin (1 μM) in nominally Ca2+-free medium to deplete intracellular Ca2+ stores. Once the Ca2+ transient was over, Ca2+ (2 mM) was added to the bath to evidence the store-operated Ca2+ influx. Alternatively, cells were subjected to the same protocol but in the presence of the TRPC3 selective blocker Pyr10 (2 μM) as indicated. Traces are averages of 18–22 cells and are representative of 3 independent experiments.
Figure 6
Figure 6
A) Fura-2 loaded HCAECs were challenged with ATP (100 μM) in nominally Ca2+-free medium in the absence or presence of the TRPC3 selective blocker Pyr10 (2 μM) as indicated. Once the Ca2+ transient (IP3-mediated Ca2+ release) was over, Ba2+ (2 mM) was added to the bath to evaluate unidirectional cation (Ba2+) influx. “Control” cells represent Fura-2 loaded HCAECs that were maintained in nominally Ca2+-free medium –no ATP stimulation- and at the indicated time, exposed to Ba2+ (2 mM) to evaluate constitutive Ba2+ influx. Traces are averages of 19–21 cells and are representative of 3 independent experiments. B) HCAECs were maintained in nominally Ca2+-free medium and in the presence of the protein kinase C inhibitor Go6976 (5 μM) to minimize the protein kinase Cα-dependent inhibition of native TRPC3 induced by exogenous synthetic diacylglycerols (Lievremont et al., 2005; Trebak et al., 2004; Trebak et al., 2003a; Vazquez and Putney, 2006). After 5 min, OAG (100 μM) and Ba2+ (2 mM) were added to the bath to trigger OAG-induced TRPC3-mediated Ba2+ influx. Alternatively, cells were subjected to the same protocol but in the presence of the TRPC3 selective blocker Pyr10 (2 μM). Shown are values for rates of Ba2+ influx (ratio units/min) expressed as mean ± SEM. n=20–22 cells.
Figure 6
Figure 6
A) Fura-2 loaded HCAECs were challenged with ATP (100 μM) in nominally Ca2+-free medium in the absence or presence of the TRPC3 selective blocker Pyr10 (2 μM) as indicated. Once the Ca2+ transient (IP3-mediated Ca2+ release) was over, Ba2+ (2 mM) was added to the bath to evaluate unidirectional cation (Ba2+) influx. “Control” cells represent Fura-2 loaded HCAECs that were maintained in nominally Ca2+-free medium –no ATP stimulation- and at the indicated time, exposed to Ba2+ (2 mM) to evaluate constitutive Ba2+ influx. Traces are averages of 19–21 cells and are representative of 3 independent experiments. B) HCAECs were maintained in nominally Ca2+-free medium and in the presence of the protein kinase C inhibitor Go6976 (5 μM) to minimize the protein kinase Cα-dependent inhibition of native TRPC3 induced by exogenous synthetic diacylglycerols (Lievremont et al., 2005; Trebak et al., 2004; Trebak et al., 2003a; Vazquez and Putney, 2006). After 5 min, OAG (100 μM) and Ba2+ (2 mM) were added to the bath to trigger OAG-induced TRPC3-mediated Ba2+ influx. Alternatively, cells were subjected to the same protocol but in the presence of the TRPC3 selective blocker Pyr10 (2 μM). Shown are values for rates of Ba2+ influx (ratio units/min) expressed as mean ± SEM. n=20–22 cells.
Figure 7
Figure 7
HCAECs were maintained in EBM-2 alone (Control) or EBM-2 containing the ER stressors thapsigargin (“Thaps”, 1 μM) or tunicamycin (“Tun”, 10 μg/ml) for 16 hours, in the presence or absence of the selective TRPC3 blocker pyrazole-10 (Pyr10, 2 μM) as indicated; treatment with Pyr10 alone was included as a control. In A), following treatments the cells were processed for immunodetection of IRE1α (~130 kDa), BiP (~75 kDa) or CHOP (~27 kDa) in whole cell lysates. Membranes were reprobed for GAPDH (~37 kDa) to control for protein loading. Blots are representative of three independent experiments. In B) the cells were processed for in vitro TUNEL assay. Where indicated HCAECs were incubated in EBM-2 containing staurosporine (“St”, 1 μM) for 16 hours, in the presence or absence of Pyr10 (2 μM). Differences between “Thaps” and “Tun” treatments and their corresponding control (“Control”) had P<0.001. Differences between staurosporine treatments and the control had P<0.001. All values are mean ± SEM (n=3–5). “ns”: not statistically significant.
Figure 8
Figure 8
HCAECs were maintained in EBM-2 alone (Control) or EBM-2 containing the ER stressors thapsigargin (“Thaps”, 1 μM) or tunicamycin (“Tun”, 10 μg/ml) for 16 hours. Following treatments the cells were processed for immunodetection of TRPC3 (~100 kDa) in whole cell lysates. Membranes were reprobed for GAPDH (~37 kDa) to control for protein loading. Blots are representative of three independent experiments.
Figure 9
Figure 9
HCAECs were maintained in EBM-2 alone (Control) or EBM-2 containing thapsigargin (“Thaps”, 1 μM) or tunicamycin (“Tun”, 10 μg/ml) in the presence or absence of the selective CAMKII inhibitor KN93 (“KN93”, 10 μM, panel A) or its inactive analogue KN92 (“KN92”, 10 μM, panel B) and then processed for in vitro TUNEL assay. P values for the differences between treatments with and without KN93 are shown. Differences between treatments with thapsigargin or tunicamycin and the control had P <0.001. All values are mean ± SEM (n=3). ns: not statistically significant. *P=0.011, **P=0.03, for the differences between thapsigargin vs. control and tunicamycin vs. control, respectively.
Figure 9
Figure 9
HCAECs were maintained in EBM-2 alone (Control) or EBM-2 containing thapsigargin (“Thaps”, 1 μM) or tunicamycin (“Tun”, 10 μg/ml) in the presence or absence of the selective CAMKII inhibitor KN93 (“KN93”, 10 μM, panel A) or its inactive analogue KN92 (“KN92”, 10 μM, panel B) and then processed for in vitro TUNEL assay. P values for the differences between treatments with and without KN93 are shown. Differences between treatments with thapsigargin or tunicamycin and the control had P <0.001. All values are mean ± SEM (n=3). ns: not statistically significant. *P=0.011, **P=0.03, for the differences between thapsigargin vs. control and tunicamycin vs. control, respectively.
Figure 10
Figure 10
A) HCAECs were maintained in EBM-2 alone (Control) or EBM-2 containing thapsigargin (“Thaps”, 1 μM, 10 min) or tunicamycin (“Tun”, 10 μg/ml, 30 min) in the presence or absence of the selective CAMKII inhibitor KN93 (“KN93”, 10 μM), and then processed for immunodetection of phospho-CAMKII (Thr286; ~50 kDa), phospho-STAT1 (Ser727; ~91 kDa) or phospho-JNK1/2 (Thr-183/Tyr-185; ~46/54 kDa) in whole cell lysates, as indicated. Membranes were reprobed for GAPDH (~37 kDa) or total STAT1 (~91 kDa) or total JNK1/2 (~46/54 kDa), as indicated, to control for protein loading. Immunodetection of CAMKII and STAT1 was always performed on the same blot, and thus the same GAPDH blot applies as a loading control for both proteins. Blots are representative of three independent experiments. B) Bar graphs show normalized densitometry values for three independent experiments. P values for the difference respect to the control are shown on top of the bars. ns: not statistically significant.
Figure 10
Figure 10
A) HCAECs were maintained in EBM-2 alone (Control) or EBM-2 containing thapsigargin (“Thaps”, 1 μM, 10 min) or tunicamycin (“Tun”, 10 μg/ml, 30 min) in the presence or absence of the selective CAMKII inhibitor KN93 (“KN93”, 10 μM), and then processed for immunodetection of phospho-CAMKII (Thr286; ~50 kDa), phospho-STAT1 (Ser727; ~91 kDa) or phospho-JNK1/2 (Thr-183/Tyr-185; ~46/54 kDa) in whole cell lysates, as indicated. Membranes were reprobed for GAPDH (~37 kDa) or total STAT1 (~91 kDa) or total JNK1/2 (~46/54 kDa), as indicated, to control for protein loading. Immunodetection of CAMKII and STAT1 was always performed on the same blot, and thus the same GAPDH blot applies as a loading control for both proteins. Blots are representative of three independent experiments. B) Bar graphs show normalized densitometry values for three independent experiments. P values for the difference respect to the control are shown on top of the bars. ns: not statistically significant.
Figure 11
Figure 11
HCAECs were maintained in EBM-2 alone (Control) or EBM-2 containing tunicamycin (“Tun”, 10 μg/ml, 30 min) or thapsigargin (“Thaps”, 1 μM, 10 min) and in the presence or absence of the TRPC3 selective blocker Pyr10 (2 μM), as indicated. Following treatments, cells were processed for immunodetection of phospho-CAMKII (Thr286; ~50 kDa) in whole cell lysates. Membranes were reprobed for GAPDH (~37 kDa) to control for protein loading.

Similar articles

Cited by

References

    1. Alkhani H, Ase AR, Grant R, O’Donnell D, Groschner K, Seguela P. Contribution of TRPC3 to store-operated calcium entry and inflammatory transductions in primary nociceptors. Mol Pain. 2014;10:43. - PMC - PubMed
    1. Baldi CVG, Boland R. Capacitative calcium influx in human epithelial breast cancer and non-tumorigenic cells occurs through Ca2+ entry pathways with different permeabilities to divalent cations. Journal of cellular biochemistry. 2003;88:1265–1272. - PubMed
    1. Chen S, He FF, Wang H, Fang Z, Shao N, Tian XJ, Liu JS, Zhu ZH, Wang YM, Wang S, Huang K, Zhang C. Calcium entry via TRPC6 mediates albumin overload-induced endoplasmic reticulum stress and apoptosis in podocytes. Cell calcium. 2011;50:523–529. - PubMed
    1. Hecquet CM, Zhang M, Mittal M, Vogel SM, Di A, Gao X, Bonini MG, Malik AB. Cooperative interaction of trp melastatin channel transient receptor potential (TRPM2) with its splice variant TRPM2 short variant is essential for endothelial cell apoptosis. Circ Res. 2014;114:469–479. - PMC - PubMed
    1. Hollien J. Evolution of the unfolded protein response. Biochimica et Biophysica Acta (BBA) - Molecular Cell Research. 2013;1833:2458–2463. - PubMed

MeSH terms

Substances