. 2015 Dec;3(1):39.
doi: 10.1186/s40635-015-0039-0. Epub 2015 Feb 24.

Shape descriptors of the "never resting" microglia in three different acute brain injury models in mice

Affiliations

Shape descriptors of the "never resting" microglia in three different acute brain injury models in mice

Elisa R Zanier et al. Intensive Care Med Exp. 2015 Dec.

Abstract

Background: The study of microglia and macrophage (M/M) morphology represents a key tool to understand the functional activation state and the pattern of distribution of these cells in acute brain injury. The identification of reliable quantitative morphological parameters is urgently needed to understand these cell roles in brain injury and to explore strategies aimed at therapeutically manipulating the inflammatory response.

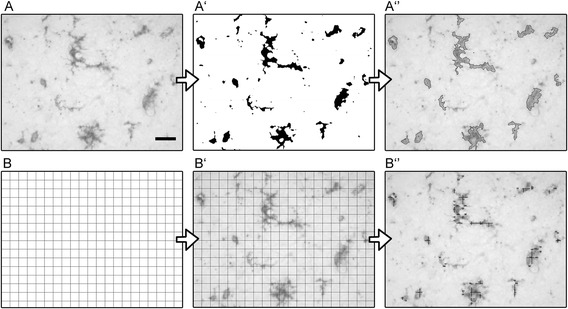
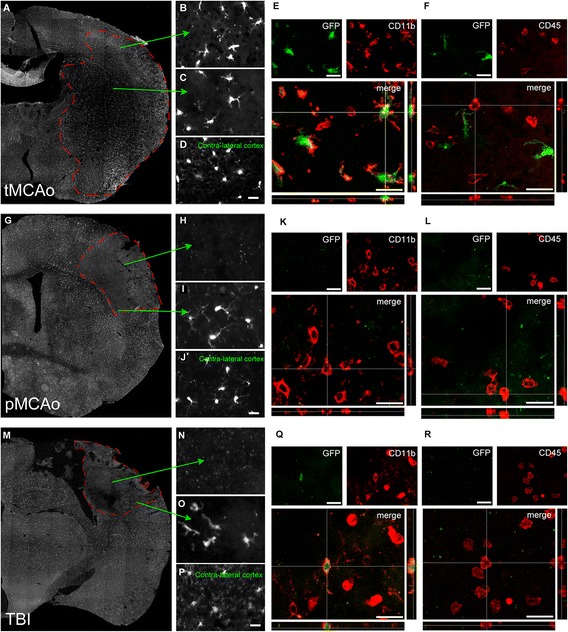
Methods: We used three different clinically relevant murine models of focal injury, namely, controlled cortical impact brain injury (traumatic brain injury (TBI)) and transient and permanent occlusion of middle cerebral artery (tMCAo and pMCAo, respectively). Twenty-four hours after injury, M/M cells were labeled by CD11b, and ×40 photomicrographs were acquired by unbiased sampling of the lesion core using a motorized stage microscope. Images were processed with Fiji software to obtain shape descriptors.

Results: We validated several parameters, including area, perimeter, Feret's diameter (caliper), circularity, aspect ratio, and solidity, providing quantitative information on M/M morphology over wide tissue portions. We showed that the shape descriptors that best represent M/M ramification/elongation are area and perimeter, while circularity and solidity provide information on the ameboid shape. We also provide evidence of the involvement of different populations in local inflammatory events, with macrophages replacing microglia into the lesion core when reperfusion does not occur. Analysis of CD45(high)+ cell morphology, whose shape does not change, did not yield any difference, thus confirming the reliability of the approach.

Conclusions: We have defined specific morphological features that M/M acquire in response to different acute insults by applying a sensitive and readily applicable approach to cell morphological analysis in the brain tissue. Potential application of this method can be extended to all cell types able to change shape following activation, e.g., astrocytes, or to different disease states, including chronic pathologies.


Figures

Figure 1
Figure 1
Lesion characteristics at 24 h after tMCAo, pMCAo, or TBI and placement of acquisition fields. Lesion size distribution is shown at different anteroposterior (AP) coordinates relative to the bregma for tMCAo, pMCAo, or TBI (n = 6) (A). The maximum lesion size for tMCAo is at −0.88 mm from the bregma, for pMCAo at +0.08 mm, and for TBI at −1.84 mm from the bregma. For each injury model, representative sections stained by cresyl violet are shown. The lesion has been sampled by distributing ×40 acquisition fields over the region of interest as depicted in the figure (B) (scale bar = 1 mm). The frame centers at ×40 were distanced 532 μm (tMCAo and pMCAo) or 358 μm (TBI) for horizontally aligned frames and 266 μm for vertically aligned frames, covering 0.2 mm2 total area. For tMCAo and pMCAo, acquisition fields were placed within the lesion core, while for TBI, since part of the lesion core tissue is lost, acquisition fields were positioned at the contusion edge.
Figure 2
Figure 2
Shape descriptor and grid crossing protocols. Shape descriptors (area, perimeter, circularity, Feret’s diameter, aspect ratio, and solidity) were quantified on 179 × 133 μm fields (A). The original image was scaled to microns and segmented by applying the Max function on Fiji (A’, see methods). Objects with > 25 μm2 area were selected and analyzed (A’’, outlines of selected objects for analysis). For the grid crossing counts, a grid with 9 × 9 μm spaced lines was used (B). This was overimposed to the image (B’) and intersections between > 25 μm2 objects (previously segmented), and the grid were quantified (B’’). Scale bar = 20 μm.
Figure 3
Figure 3
GFP+ microglia distribution over the lesion area at 24 h after tMCAo, pMCAo, or TBI. GFP+ microglia showed homogenous distribution over the lesioned hemisphere after tMCAo (A). Microglial hypertrophic morphology was evident both in the cortex (B) and the striatum (lesion core, C). On the contralateral side GFP+ cells displayed the typical ramified morphology with thin branches (D). Within the lesion core, GFP (green) co-localized with CD11b (red, pan-marker of microglia/macrophages, E) only in ramified CD11b+ cells. No co-localization was observed between GFP and round-shaped CD11b+ (E) or CD45high+ cells (infiltrating leukocytes, F). After pMCAo (G) GFP+ microglia were not present in the lesion core (H). Hypertrophic GFP+ cells surrounded the lesion and placed at lesion border (I). Normal ramified morphology was observed in contra-lateral side (J). The lesion core was populated by round-shaped GFP-/CD11b+ and GFP- /CD45high+ cells (K, L). After TBI (M) GFP+ microglia had similar appearance as to pMCAo: absent in the lesion core (N), hypertrophic at lesion border (O) and ramified with thin branches in contra-lateral side (P). The lesion core was populated by round-shaped GFP-/CD11b+ and GFP- /CD45high+ cells (Q, R). Data are representative of 3 independent experiments. Scale bars= 20 μm.
Figure 4
Figure 4
GFP+ (green) co-localization with CD11b or CD45 high (both red) in the lesion border area at 24h after tMCAo, pMCAO, or TBI. In all tMCAo (A), pMCAo (C) and TBI (E), lesion borders were populated by ramified GFP+/CD11b+ microglia. Notably, neither round-shaped CD11b+ nor CD45high+ cells (B, D, F) expressed GFP. Data are representative of 3 independent experiments. Scale bars = 20 μm.
Figure 5
Figure 5
Quantitative analysis of CD11b+ cells 24 h after acute brain injury. Area (A), perimeter (B), circularity (C), Feret’s diameter (D), aspect ratio (E), and solidity (F) calculated for naïve (striatum and cortex), tMCAo, pMCAo, or TBI mice are shown as box and whiskers with line at mean and min-to-max values. One-way ANOVA followed by Tukey’s multiple comparison test, *p < 0.05, **p < 0.01, and ***p < 0.001, n = 6. The drawings beside the y-axis indicate expected values for each parameter depending on cell shape (ramified vs. ameboid) (A, B, C, D, F) or cell symmetry (E). Frequency distribution plots for individual cells are shown. Dotted lines correspond to the value indicated below each line.
Figure 6
Figure 6
Grid crossings by CD11b stained cells 24h after acute brain injury. CD11b+ cells in the lesion core displayed significantly increased grid crossings after tMCAo compared to either pMCAo or TBI (A). This indicates an increased presence of ramified microglia in tMCAo, since ramified cells are expected to have more frequent crossings with the grid compared to round-shaped cells (B). Data are shown as box and whiskers with line at mean and min-to-max values. One-way ANOVA followed by Tukey’s multiple comparison test, **p<0.01, ***p<0.001, n=6.
Figure 7
Figure 7
Quantitative analysis of CD45 high + cells 24 h after acute brain injury. Area (A), perimeter (B), circularity (C), Feret’s diameter (D), aspect ratio (E), solidity (F), and grid crossings (G) calculated for naïve (striatum and cortex), tMCAo, pMCAo, or TBI mice are shown as box and whiskers with line at mean and min-to-max values. None of these parameters changed across models, in line with the unvaried round-shaped morphology of CD45high+ cells. CD45high+ cell density (H) in the lesion core after pMCAo and TBI was higher compared to tMCAo. One-way ANOVA followed by Tukey’s multiple comparison test, *p < 0.05, ***p < 0.001, n = 6 (n.d. = not detectable).

References

    1. Ransohoff RM, Perry VH. Microglial physiology: unique stimuli, specialized responses. Annu Rev Immunol. 2009;27:119–145. doi: 10.1146/annurev.immunol.021908.132528. - DOI - PubMed
    1. Hanisch U-K, Kettenmann H. Microglia: active sensor and versatile effector cells in the normal and pathologic brain. Nat Neurosci. 2007;10:1387–1394. doi: 10.1038/nn1997. - DOI - PubMed
    1. Ransohoff RM, Cardona AE. The myeloid cells of the central nervous system parenchyma. Nature. 2010;468:253–262. doi: 10.1038/nature09615. - DOI - PubMed
    1. McWhorter FY, Wang T, Nguyen P, et al. Modulation of macrophage phenotype by cell shape. Proc Natl Acad Sci U S A. 2013;110:17253–17258. doi: 10.1073/pnas.1308887110. - DOI - PMC - PubMed
    1. Ajami B, Bennett JL, Krieger C, et al. Local self-renewal can sustain CNS microglia maintenance and function throughout adult life. Nat Neurosci. 2007;10:1538–1543. doi: 10.1038/nn2014. - DOI - PubMed

LinkOut - more resources