

Why do they die? Comparison of selected aspects of organ injury and dysfunction in mice surviving and dying in acute abdominal sepsis
- PMID: 26215812
- PMCID: PMC4513036
- DOI: 10.1186/s40635-015-0048-z
Why do they die? Comparison of selected aspects of organ injury and dysfunction in mice surviving and dying in acute abdominal sepsis
Abstract
Background: The mechanisms of sepsis mortality remain undefined. While there is some evidence of organ damage, it is not clear whether this damage alone is sufficient to cause death. Therefore, we aimed to examine contribution of organ injury/dysfunction to early deaths in the mouse abdominal sepsis.
Methods: Female OF-1 mice underwent either medium-severity cecal ligation and puncture (CLP-Only) or non-lethal CLP-ODam (CLP with cisplatin/carbontetrachloride to induce survivable hepatotoxicity and nephrotoxicity). In the first experiment, blood was collected daily from survivors (SUR; CLP-Only and CLP-ODam groups) or until early death (DIED; CLP-Only). In the second experiment (CLP-Only), early outcome was prospectively predicted based on body temperature (BT) and pairs of mice predicted to survive (P-SUR) and die (P-DIE) were sacrificed post-CLP. The overall magnitude of organ injury/dysfunction was compared in retrospectively and prospectively stratified mice.
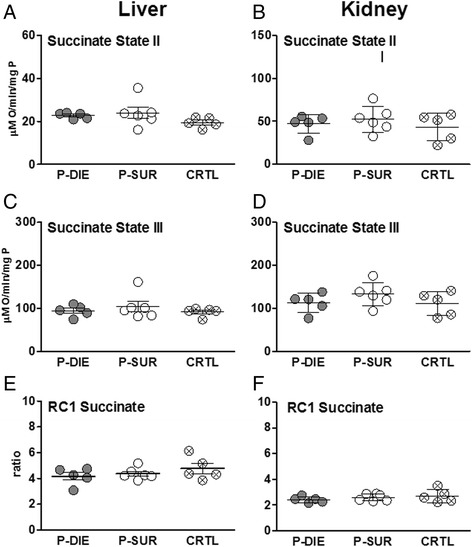
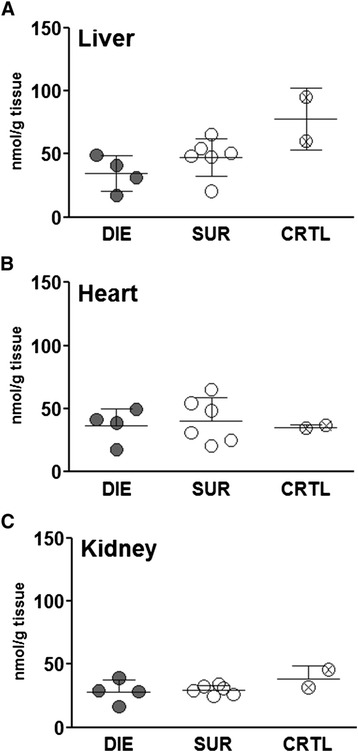
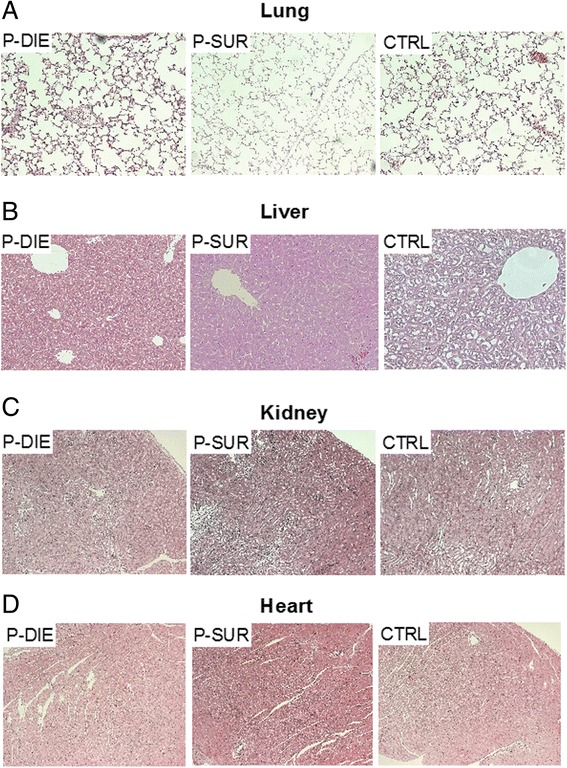
Results: At day 7 post-CLP, survival in CLP-Only was 48%, while CLP-ODam was non-lethal. In CLP-Only mice within 24 h of death, urea increased to 78 (versus 40 mg/dl in SUR), ALT to 166 (vs. 108 U/l), LDH to 739 (vs. 438 U/l) and glucose declined to 43 (vs. 62 mg/dl). In CLP-ODam, hypoglycemia was exacerbated (by 1.5-fold) and ALT and LDH were 20- and 8-fold higher versus DIED (CLP-Only) mice. In CLP-Only, predicted deaths (P-DIE) were preceded by a significant rise only in cystatin C (268 vs. 170 ng/ml in P-SUR) but not in creatinine and troponin I. Respiratory function of mitochondria in the liver and kidney of P-SUR and P-DIE CLP-Only mice was not impaired (vs. controls) and ATP level in organs remained similar among all groups. Histologic injury scores in the liver, kidney, heart and lung showed no major disparities among dying, surviving and control mice.
Conclusions: In CLP-Only mice, although the deregulation of parameters indicative of organ injury/dysfunction was greater in dying versus surviving mice, it never exceeded the changes in surviving CLP-ODam animals, and it was not followed by histopathological damage and/or mitochondrial dysfunction. This shows that interpretation of the contribution of the organ injury/dysfunction to early deaths in the CLP model is not straightforward and depends on the pathophysiological origin of the profiled disturbances.
Figures


Similar articles
-
Lethal versus surviving sepsis phenotypes displayed a partly differential regional expression of neurotransmitters and inflammation and did not modify the blood-brain barrier permeability in female CLP mice.Intensive Care Med Exp. 2024 Nov 4;12(1):96. doi: 10.1186/s40635-024-00688-7. Intensive Care Med Exp. 2024. PMID: 39497013 Free PMC article.
-
Relationship between age/gender-induced survival changes and the magnitude of inflammatory activation and organ dysfunction in post-traumatic sepsis.PLoS One. 2012;7(12):e51457. doi: 10.1371/journal.pone.0051457. Epub 2012 Dec 12. PLoS One. 2012. PMID: 23251540 Free PMC article.
-
A non-lethal traumatic/hemorrhagic insult strongly modulates the compartment-specific PAI-1 response in the subsequent polymicrobial sepsis.PLoS One. 2013;8(2):e55467. doi: 10.1371/journal.pone.0055467. Epub 2013 Feb 8. PLoS One. 2013. PMID: 23408987 Free PMC article.
-
Early murine polymicrobial sepsis predominantly causes renal injury.Shock. 2014 Feb;41(2):97-103. doi: 10.1097/SHK.0000000000000073. Shock. 2014. PMID: 24300829 Free PMC article.
-
Systemic inhibition and liver-specific over-expression of PAI-1 failed to improve survival in all-inclusive populations or homogenous cohorts of CLP mice.J Thromb Haemost. 2014 Jun;12(6):958-69. doi: 10.1111/jth.12565. J Thromb Haemost. 2014. PMID: 24655755
Cited by
-
Thermoregulation and survival during sepsis: insights from the cecal ligation and puncture experimental model.Intensive Care Med Exp. 2024 Nov 10;12(1):100. doi: 10.1186/s40635-024-00687-8. Intensive Care Med Exp. 2024. PMID: 39522078 Free PMC article.
-
Lung immune incompetency after mild peritoneal sepsis and its partial restoration by type 1 interferon: a mouse model study.Intensive Care Med Exp. 2024 Dec 20;12(1):119. doi: 10.1186/s40635-024-00707-7. Intensive Care Med Exp. 2024. PMID: 39707074 Free PMC article.
-
Lethal versus surviving sepsis phenotypes displayed a partly differential regional expression of neurotransmitters and inflammation and did not modify the blood-brain barrier permeability in female CLP mice.Intensive Care Med Exp. 2024 Nov 4;12(1):96. doi: 10.1186/s40635-024-00688-7. Intensive Care Med Exp. 2024. PMID: 39497013 Free PMC article.
-
Impact of ambient temperature on inflammation-induced encephalopathy in endotoxemic mice-role of phosphoinositide 3-kinase gamma.J Neuroinflammation. 2020 Oct 7;17(1):292. doi: 10.1186/s12974-020-01954-7. J Neuroinflammation. 2020. PMID: 33028343 Free PMC article.
-
Role of Protein Kinase C-delta in regulating platelet activation and platelet-leukocyte interaction during sepsis.PLoS One. 2018 Apr 4;13(4):e0195379. doi: 10.1371/journal.pone.0195379. eCollection 2018. PLoS One. 2018. PMID: 29617417 Free PMC article.
References
-
- Bernard GR, Vincent JL, Laterre PF, LaRosa SP, Dhainaut JF, Lopez-Rodriguez A, Steingrub JS, Garber GE, Helterbrand JD, Ely EW, Fisher CJ., Jr Efficacy and safety of recombinant human activated protein C for severe sepsis. N Engl J Med. 2001;344:699–709. doi: 10.1056/NEJM200103083441001. - DOI - PubMed
Grants and funding
LinkOut - more resources
Full Text Sources
Other Literature Sources
Research Materials
Miscellaneous
