

Electron tomographic structure and protein composition of isolated rat cerebellar, hippocampal and cortical postsynaptic densities
- PMID: 26215919
- PMCID: PMC4547907
- DOI: 10.1016/j.neuroscience.2015.07.062
Electron tomographic structure and protein composition of isolated rat cerebellar, hippocampal and cortical postsynaptic densities
Abstract
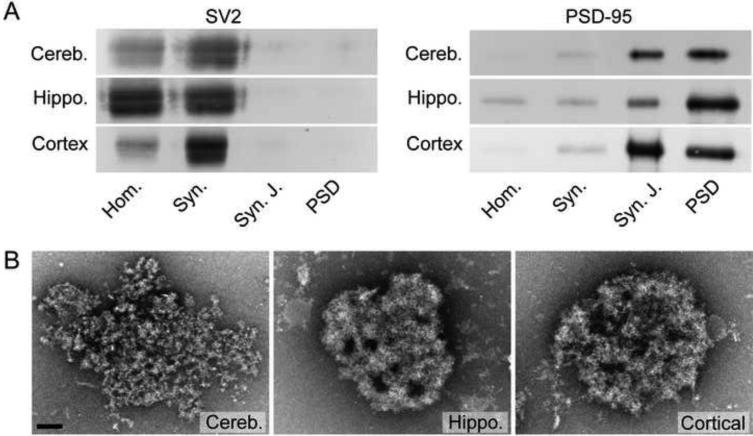
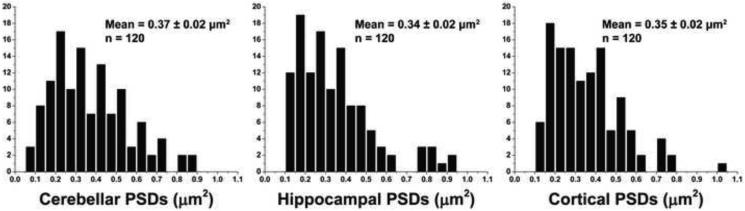
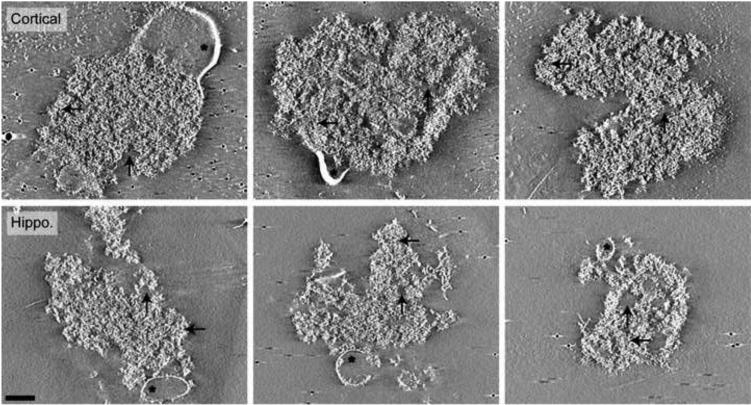
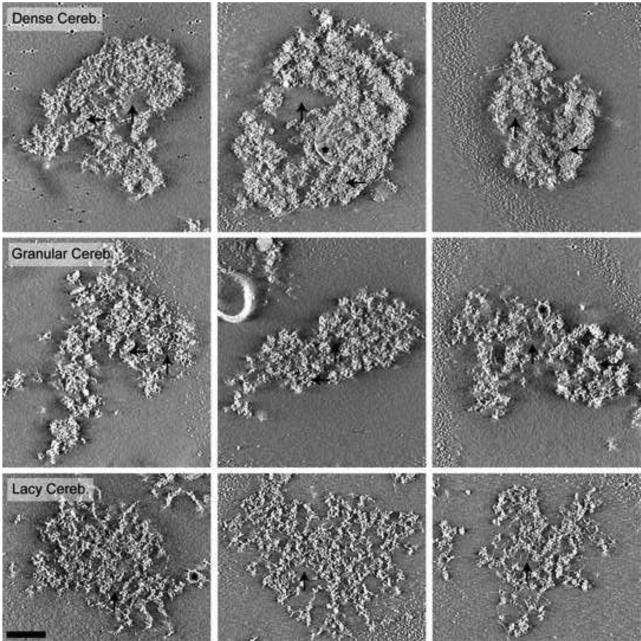
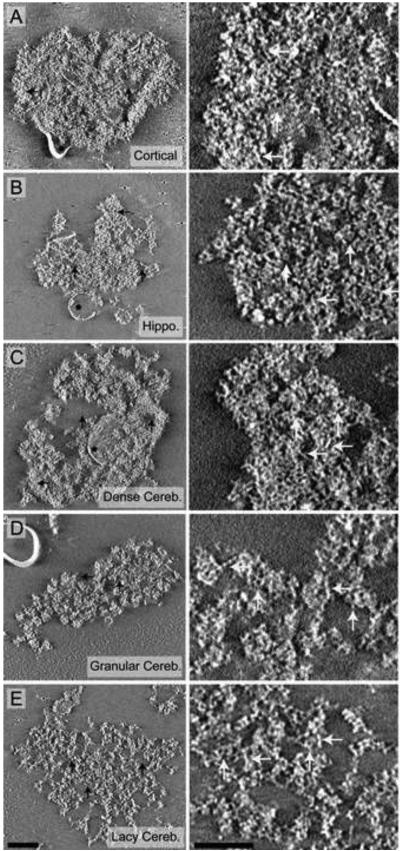
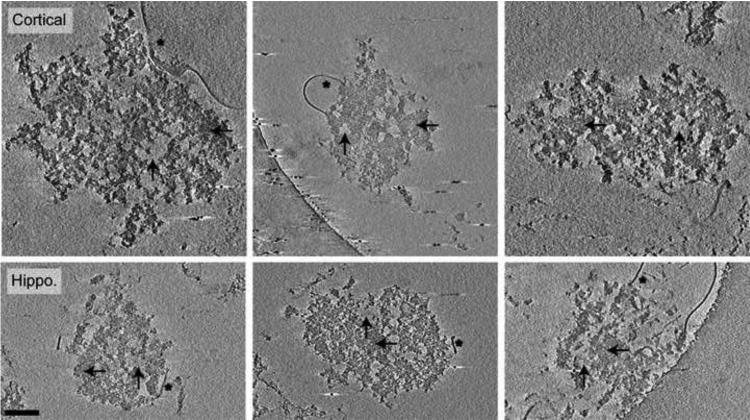
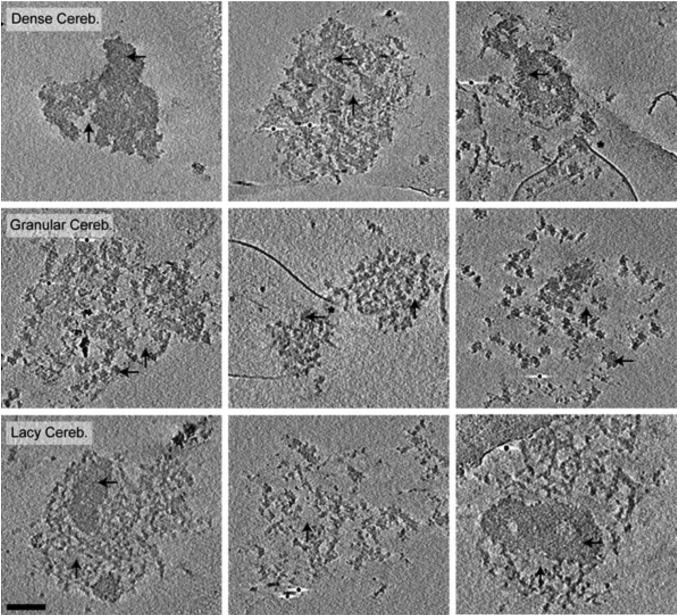
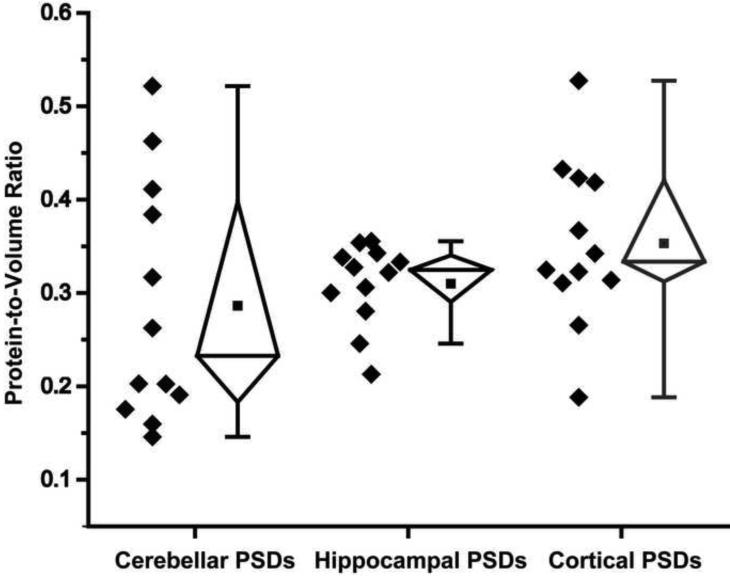
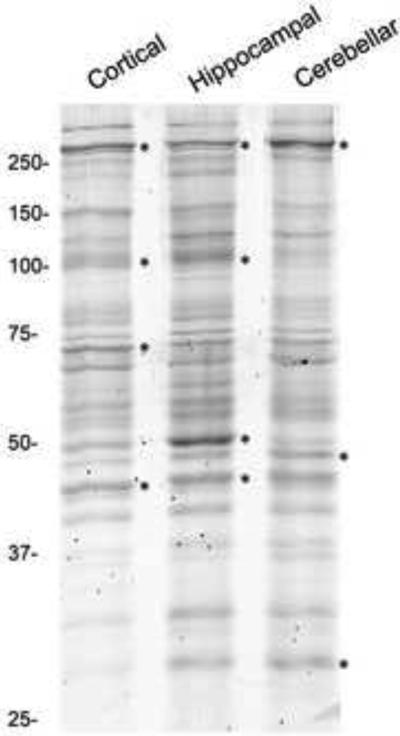
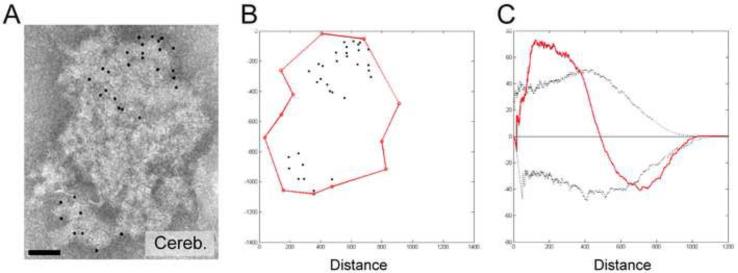
Electron tomography and immunogold labeling were used to analyze similarities and differences in the morphology and protein composition of postsynaptic densities (PSDs) isolated from adult rat cerebella, hippocampi, and cortices. There were similarities in physical dimensions and gross morphology between cortical, hippocampal and most cerebellar PSDs, although the morphology among cerebellar PSDs could be categorized into three distinct groups. The majority of cerebellar PSDs were composed of dense regions of protein, similar to cortical and hippocampal PSDs, while others were either composed of granular or lattice-like protein regions. Significant differences were found in protein composition and organization across PSDs from the different brain regions. The signaling protein, βCaMKII, was found to be a major component of each PSD type and was more abundant than αCaMKII in both hippocampal and cerebellar PSDs. The scaffold molecule PSD-95, a major component of cortical PSDs, was found absent in a fraction of cerebellar PSDs and when present was clustered in its distribution. In contrast, immunogold labeling for the proteasome was significantly more abundant in cerebellar and hippocampal PSDs than cortical PSDs. Together, these results indicate that PSDs exhibit remarkable diversity in their composition and morphology, presumably as a reflection of the unique functional demands placed on different synapses.
Keywords: electron cryotomography; electron tomography; immunogold labeling; postsynaptic density; receptors; scaffold proteins.
Copyright © 2015 IBRO. Published by Elsevier Ltd. All rights reserved.
Figures
Similar articles
-
Isolation and characterization of postsynaptic densities from various brain regions: enrichment of different types of postsynaptic densities.J Cell Biol. 1980 Sep;86(3):831-45. doi: 10.1083/jcb.86.3.831. J Cell Biol. 1980. PMID: 7410481 Free PMC article.
-
A study of the spatial protein organization of the postsynaptic density isolated from porcine cerebral cortex and cerebellum.Mol Cell Proteomics. 2011 Oct;10(10):M110.007138. doi: 10.1074/mcp.M110.007138. Epub 2011 Jun 28. Mol Cell Proteomics. 2011. PMID: 21715321 Free PMC article.
-
Structure and composition of the postsynaptic density during development.J Comp Neurol. 2010 Oct 15;518(20):4243-60. doi: 10.1002/cne.22451. J Comp Neurol. 2010. PMID: 20878786 Free PMC article.
-
Direct visualization of CaMKII at postsynaptic densities by electron microscopy tomography.J Comp Neurol. 2012 Dec 15;520(18):4218-25. doi: 10.1002/cne.23151. J Comp Neurol. 2012. PMID: 22627922
-
Characterization of Na+-independent GABA and flunitrazepam binding sites in preparations of synaptic membranes and postsynaptic densities isolated from canine cerebral cortex and cerebellum.J Neurochem. 1984 Oct;43(4):1011-7. doi: 10.1111/j.1471-4159.1984.tb12837.x. J Neurochem. 1984. PMID: 6088689
Cited by
-
Tubulin and GTP Are Crucial Elements for Postsynaptic Density Construction and Aggregation.J Neurochem. 2025 May;169(5):e70085. doi: 10.1111/jnc.70085. J Neurochem. 2025. PMID: 40396438 Free PMC article.
-
Estimation of the number of synapses in the hippocampus and brain-wide by volume electron microscopy and genetic labeling.Sci Rep. 2020 Aug 19;10(1):14014. doi: 10.1038/s41598-020-70859-5. Sci Rep. 2020. PMID: 32814795 Free PMC article.
-
Cryo-EM tomography and automatic segmentation delineate modular structures in the postsynaptic density.Front Synaptic Neurosci. 2023 Apr 6;15:1123564. doi: 10.3389/fnsyn.2023.1123564. eCollection 2023. Front Synaptic Neurosci. 2023. PMID: 37091879 Free PMC article.
-
Neurons as a model system for cryo-electron tomography.J Struct Biol X. 2022 Mar 9;6:100067. doi: 10.1016/j.yjsbx.2022.100067. eCollection 2022. J Struct Biol X. 2022. PMID: 35310407 Free PMC article.
-
Identification of PSD-95 in the Postsynaptic Density Using MiniSOG and EM Tomography.Front Neuroanat. 2018 Dec 7;12:107. doi: 10.3389/fnana.2018.00107. eCollection 2018. Front Neuroanat. 2018. PMID: 30581381 Free PMC article.
References
-
- Aronowski J, Grotta JC, Waxham MN. Ischemia-induced translocation of Ca2+/calmodulin-dependent protein kinase II: potential role in neuronal damage. J Neurochem. 1992;58:1743–1753. - PubMed
-
- Bingol B, Schuman EM. Activity-dependent dynamics and sequestration of proteasomes in dendritic spines. Nature. 2006;441:1144–1148. - PubMed
-
- Bingol B, Wang CF, Arnott D, Cheng D, Peng J, Sheng M. Autophosphorylated CaMKIIalpha acts as a scaffold to recruit proteasomes to dendritic spines. Cell. 2010;140:567–578. - PubMed
Publication types
MeSH terms
Substances
Grants and funding
LinkOut - more resources
Full Text Sources
Other Literature Sources
