Review
. 2015 Dec:141:91-8.
doi: 10.1016/j.exer.2015.07.015. Epub 2015 Jul 26.

IOP telemetry in the nonhuman primate

Affiliations
Review

IOP telemetry in the nonhuman primate

J Crawford Downs. Exp Eye Res. 2015 Dec.

Abstract

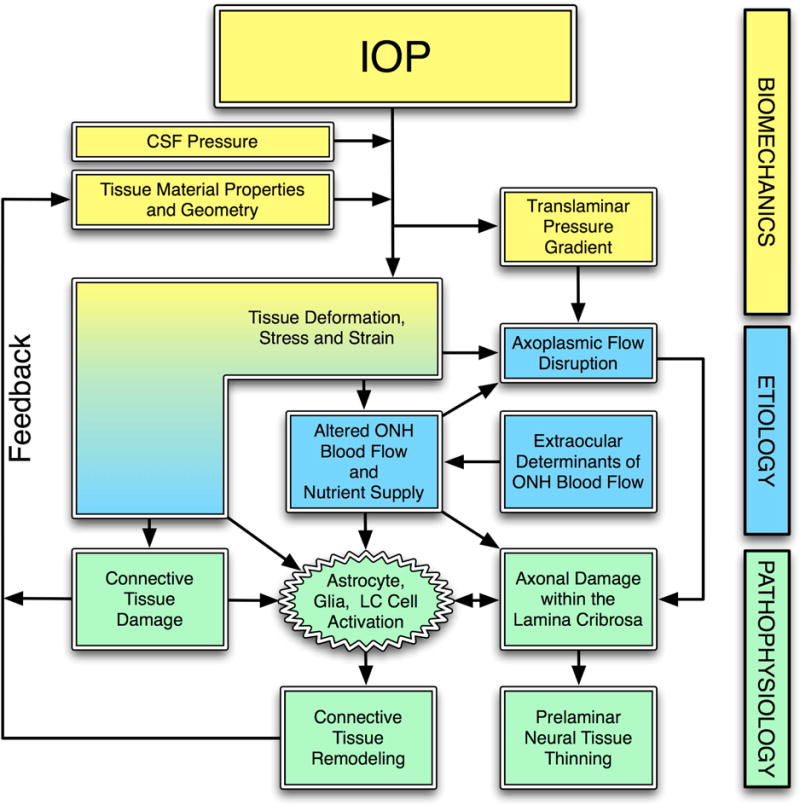
This review is focused on continuous IOP monitoring using telemetry systems in the nonhuman primate (NHP), presented in the context that IOP fluctuations at various timescales may be involved in glaucoma pathogenesis and progression. We use glaucoma as the primary framework to discuss how the dynamic nature of IOP might change with age, racial heritage, and disease in the context of glaucoma susceptibility and progression. We focus on the limited work that has been published in IOP telemetry in NHPs, as well as the emerging data and approaches. We review the ongoing efforts to measure continuous IOP, and the strengths, weaknesses and general pitfalls of the various approaches.

Keywords: Biomechanics; Glaucoma; IOP; Nonhuman primate; Telemetry.


Figures

Figure 1
Figure 1. IOP-related stress and strain are a constant presence within the ONH at all levels of IOP
IOP and cerebrospinal fluid pressure act mechanically on the tissues of the eye, producing deformations, strain and stress within the tissues. These deformations depend on the eye-specific geometry and material properties of the individual eye. In a biomechanical paradigm, stress and strain alter blood flow and may also induce connective tissue damage directly (laminar beam yield), and drives a connective tissue remodeling process that alters the tissues’ geometry and mechanical response to loading. This feeds back directly onto the mechanical effects of IOP. Adapted from Sigal, Roberts, and Downs. (Sigal, Roberts et al. 2010)
Figure 2
Figure 2. High- and Low-frequency IOP Fluctuation in the Human and NHP
Top: Pressure recording of continuous IOP from an unrestrained awake patient with baseline mean IOP of ~16 mmHg and IOP fluctuations up to 10 and 14 mmHg associated with blinks and saccadic eye movements, respectively. Adapted from Coleman and Trokel (Coleman and Trokel 1969). Bottom: Screen capture of ~7 seconds of continuous telemetric IOP trace from an unrestrained awake NHP with baseline mean IOP of ~8–14 mmHg and IOP fluctuations up to 12 and 8 mmHg associated with blinks and saccadic eye movements, respectively. IOP fluctuations can be much larger and of longer duration, especially when the animal squints or is agitated or stressed. Adapted from Downs, et al. (Downs, Burgoyne et al. 2011).
Figure 3
Figure 3. IOP Fluctuates Throughout the Day in the NHP
Plot of the 10-minute time-window average of 24 hours of continuous IOP showing low frequency IOP fluctuation from a typical NHP eye. Note that room lights were on from 6AM to 6PM daily. The color of the plot points and lines indicate how much data remained in each 10-minute window after post-hoc digital filtering of signal dropout and noise. Green indicates that 100% of the continuous IOP data were used in the 10-minute average IOP plotted in each point, and yellow indicates that 50% were eliminated due to signal dropout or noise. Note the fluctuations in IOP are substantial even when the high-frequency IOP spikes seen in Figure 2 are averaged out. Adapted from Downs, et al. (Downs, Burgoyne et al. 2011)
Figure 4
Figure 4. Ocular Pulse Amplitude Increases with Baseline IOP
Top: The amplitude of IOP fluctuations associated with systolic vascular filling, known as ocular pulse amplitude or OPA, plotted as a function of baseline IOP in one eye of four NHPs. These data show that IOP fluctuations increase significantly in magnitude as IOP increases, presumably driven by the stretching and stiffening of the ocular coats with increasing IOP.
Figure 5
Figure 5. The Nycthemeral Rhythm and Variability of Mean IOP in the NHP as Measured with Continuous IOP Telemetry
Plots of the two-hour time-window average distributions of IOP for six 24-hour periods in a single NHP eye. Note that room lights were on from 6AM to 6PM daily. The date is shown above each plot, and the each row represents three days in the same week. The box and whisker plots are shown wherein the central bar indicates the mean IOP in each two-hour segment, the extents of the box show the central 50% of the measurements, the whiskers indicate the 95% limits of the measurements in that time window, and circles indicate outliers. IOP in the NHP demonstrates no discernable nycthemeral rhythm, and shows a highly variable pattern and magnitude in different days. Adapted from Downs, et al. (Downs, Burgoyne et al. 2011)
Figure 6
Figure 6
(A) Photograph of a typical T30F total implant system showing the battery/transmitter module, radio frequency ring antenna for on/off, transmission antenna, a pressure transducer, and two ECG electrodes plus ground; (B) Photograph of the extra-orbital surface of our custom IOP transducer housing that is secured within a ¼-inch hole in the lateral orbital wall with bone screws as shown in (C) A 23-gauge silicone tube delivers aqueous from the anterior chamber to a fluid reservoir on the intra-orbital side of the transducer (partially hidden from view in B); The tube (with appropriate slack to allow for eye movement) is trimmed, inserted into the anterior chamber, sutured to the sclera using the integral scleral tube anchor plate, and covered with a scleral patchgraft (not shown). Adapted from Downs, et al. (Downs, Burgoyne et al. 2011)
Figure 7
Figure 7
(Top) Photograph of a our enhanced ITS total implant system for continuous monitoring of bilateral IOP, bilateral electro-oculogram (EOG), aortic blood pressure, and body temperature; (Bottom) Screen capture of 20 seconds of data from a single, awake, unrestrained NHP, showing IOP fluctuations from ocular pulse amplitude, blinks, and saccades, which are very similar in fellow eyes and correlated with orbital muscle activity as captured by the EOG signals.

References

    1. The Advanced Glaucoma Intervention Study (AGIS): 7. The relationship between control of intraocular pressure and visual field deterioration. The AGIS Investigators. Am J Ophthalmol. 2000;130(4):429–440. - PubMed
    1. The Advanced Glaucoma Intervention Study (AGIS): 12. Baseline risk factors for sustained loss of visual field and visual acuity in patients with advanced glaucoma. Am J Ophthalmol. 2002;134(4):499–512. - PubMed
    1. Albon J. Age related compliance of the lamina cribrosa in human eyes. British Journal of Ophthalmology. 2000;84(3):318–323. - PMC - PubMed
    1. Bengtsson B, Heijl A. Diurnal IOP fluctuation: not an independent risk factor for glaucomatous visual field loss in high-risk ocular hypertension. Graefes Arch Clin Exp Ophthalmol. 2005;243(6):513–518. - PubMed
    1. Bengtsson B, Leske MC, Hyman L, Heijl A. Fluctuation of intraocular pressure and glaucoma progression in the early manifest glaucoma trial. Ophthalmology. 2007;114(2):205–209. - PubMed