. 2015 Aug;146(2):133-46.
doi: 10.1085/jgp.201411353.

Pore dimensions and the role of occupancy in unitary conductance of Shaker K channels

Affiliations

Pore dimensions and the role of occupancy in unitary conductance of Shaker K channels

Ignacio Díaz-Franulic et al. J Gen Physiol. 2015 Aug.

Abstract

K channels mediate the selective passage of K(+) across the plasma membrane by means of intimate interactions with ions at the pore selectivity filter located near the external face. Despite high conservation of the selectivity filter, the K(+) transport properties of different K channels vary widely, with the unitary conductance spanning a range of over two orders of magnitude. Mutation of Pro475, a residue located at the cytoplasmic entrance of the pore of the small-intermediate conductance K channel Shaker (Pro475Asp (P475D) or Pro475Gln (P475Q)), increases Shaker's reported ∼ 20-pS conductance by approximately six- and approximately threefold, respectively, without any detectable effect on its selectivity. These findings suggest that the structural determinants underlying the diversity of K channel conductance are distinct from the selectivity filter, making P475D and P475Q excellent probes to identify key determinants of the K channel unitary conductance. By measuring diffusion-limited unitary outward currents after unilateral addition of 2 M sucrose to the internal solution to increase its viscosity, we estimated a pore internal radius of capture of ∼ 0.82 Å for all three Shaker variants (wild type, P475D, and P475Q). This estimate is consistent with the internal entrance of the Kv1.2/2.1 structure if the effective radius of hydrated K(+) is set to ∼ 4 Å. Unilateral exposure to sucrose allowed us to estimate the internal and external access resistances together with that of the inner pore. We determined that Shaker resistance resides mainly in the inner cavity, whereas only ∼ 8% resides in the selectivity filter. To reduce the inner resistance, we introduced additional aspartate residues into the internal vestibule to favor ion occupancy. No aspartate addition raised the maximum unitary conductance, measured at saturating [K(+)], beyond that of P475D, suggesting an ∼ 200-pS conductance ceiling for Shaker. This value is approximately one third of the maximum conductance of the large conductance K (BK) channel (the K channel of highest conductance), reducing the energy gap between their K(+) transport rates to ∼ 1 kT. Thus, although Shaker's pore sustains ion translocation as the BK channel's does, higher energetic costs of ion stabilization or higher friction with the ion's rigid hydration cage in its narrower aqueous cavity may entail higher resistance.


Figures

Figure 1.
Figure 1.
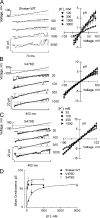
Diffusion-limited currents of Shaker K channels. (A, C, and E) Single-channel current traces of Shaker variants in 100 mM of symmetrical KCl (top) and with 100 mM KCl plus 2 M sucrose in the bath (bottom). (A) Shaker-WT, (C) P475Q, and (E) P475D. (B, D, and F) Open-channel I-V relations of at least five traces from two to four independent experiments. (B) Shaker-WT, (D) P475Q, and (F) P475D. Open and closed symbols correspond to control and sucrose data points, respectively. The solid lines are fits of a third-degree polynomial function with no theoretical meaning. The last four points taken at the most positive voltage of each curve were averaged to obtain the diffusion-limited current value for each data series. Shaker-WT, iDL = 1.25 ± 0.032 pA; P475Q, iDL = 1.22 ± 0.045 pA; P475D, iDL = 2.40 ± 0.27 pA.
Figure 2.
Figure 2.
Effect of introducing charged residues at the internal entrance of Shaker-WT channels. (Left) Leak- and capacitance-subtracted single-channel traces of (A) Shaker-WT, (B) V476D, and (C) S479D in a wide range of symmetrical [K+] (100–3,000 mM for Shaker-WT and 30–1,000 mM for V476D and Shaker-S479D). (Right) I-V relations obtained from open-channel amplitudes. Data correspond to n ≥ 10 traces from three separated patches. Data were fitted by a third-degree polynomial function having no theoretical meaning, and the slope of the fit traces at zero voltage was used to obtain the conductance values. (D) Zero-voltage slope conductance of the unitary currents displayed in the right panels of A–C. Data were fitted to a Langmuir isotherm for comparative purposes. Fit parameters: Shaker-WT, Kd = 250 ± 38 mM and gmax = 59 ± 10 pS; V476D, Kd = 3.6 ± 2.6 mM and gmax = 61 ± 3 pS; S479D, Kd = 4.7 ± 1.6 mM and gmax = 75 ± 3 pS. The discrepancy with the maximum conductance of ∼45 pS measured for Shaker-WT (Heginbotham and MacKinnon, 1993) is possibly caused by the absence of added Mg2+ in our solutions. Mg2+ could induce a low affinity blockade that reduces single-channel conductance (Heginbotham and MacKinnon, 1993; Harris et al., 1998; Moscoso et al., 2012).
Figure 3.
Figure 3.
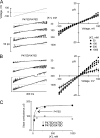
Effect of introducing charged residues at the internal entrance of P475D channels. (Left) Leak- and capacitance-subtracted single-channel traces of (A) P475D/V476D and (B) P475D/S479D in the 30-1,000-mM range of symmetrical [K+]. (Right) I-V relations from the unitary amplitudes of both variants. The slope third-order polynomial fits were used to obtain the conductance values at zero voltage. (C) Zero-voltage slope unitary conductance obtained from the I-V relations displayed in A and B plotted versus [K+]. Data of P475D/S479D were fitted to a Langmuir isotherm (Kd = 22 ± 7 mM and gmax = 179 ± 10 pS), whereas the data of P475D/V476D could not be fitted by a Langmuir isotherm; instead, we choose to average the unitary conductance of the channel at all K+ concentrations (gmax = 87 ± 1 pS). For better comparison, we included the fit of P475D from Moscoso et al. (2012) (Kd = 48 ± 6 mM and gmax = 186 ± 2 pS; discontinued line).
Figure 4.
Figure 4.
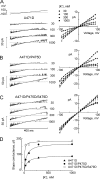
Charge additions at the inner cavity of Shaker K channels. (Left) Leak- and capacitance-subtracted single-channel traces of (A) Shaker-A471D, (B) P475D/A471D, and (C) P475D/S479D/A471D in the 30-1,000-mM range of symmetrical [K+]. (Right) I-V relations obtained from open-channel amplitudes. The continuous traces are third-degree polynomial functions fitted to the data. The slope of the fit function at zero voltage was used to obtain the conductance values. (D) Slope conductance of open-channel amplitude displayed in A–C is plotted vs. [K+]. Data were fitted to a Langmuir isotherm with the following fitting parameters: A471D, Kd = 67 ± 1.4 mM and gmax = 96 ± 2 pS; P475D/A471D, Kd = 65 ± 12 mM and gmax = 175 ± 4 pS; P475D/S479D/A471D, Kd = 6.7 ± 3.3 mM and gmax = 185 ± 6 pS.
Figure 5.
Figure 5.
Pore occupancy is modified by charge addition along the permeation pathway. (A) A snapshot of the Shaker pore structure and scheme of occupancy analysis. Shaker protein, shown in light pink, was modeled using the crystallographic structure of Kv1.2 channel as a template (PDB accession no. 2A79; Moscoso et al., 2012). Segments S5–S6, forming the pore domain, are the red ribbons; K+ are green spheres; lipids are in light gray in surf representation; and residues 471, 475, 476, and 479 are represented as gray, green, blue, and yellow bumps, respectively. The front and back subunits were removed for clarity. The discontinuous lines schematize the 5-Å-radius, pore-concentric cylinder in which time-averaged ion densities were calculated in 0.5-Å-thick slices. (B) Occupancy profile for Shaker-WT, V476D, S479D, A471D, P475D, P475D/V476D, P475D/S479D, and A471D/P475D/S479D calculated by the time-averaged ion densities inside the pore-concentric, 5-Å-radius cylinder relative to the bulk solution (500 mM K+) during ∼10 ns of simulation. Discontinuous lines indicate the binding sites at z of ∼14, ∼11, ∼8, ∼5, ∼2, approximately −9, approximately −15, and approximately −19 Å for s0, s1, s2, s3, s4, s5, s6, and s7, respectively. The drawing in A and B is at approximately the same Z-scale.
Figure 6.
Figure 6.
K+ ion hydrodynamic radius. (A) Schematic lateral view of Kv1.2/2.1 paddle chimera structure (PDB accession no. 2R9R) along the pore. The front and back subunits, together with the voltage sensor and T1 domains, were omitted. A schematic representation of the selectivity filter together with two of the pore helices and two Pro475 residues is shown for reference. Also a scheme of the 1 × 1–Å grid and the circles described by rmin and rmax are shown in blue and yellow, respectively. The eye and the arrow drawings indicate the point of view for the following images. (B–E) Surfaces left by rolling a sphere of variable radius onto the van der Waals surface of the protein. Radii varied from 1.3 to 4.6 Å (indicated in each panel). For reference, B also shows the 1 × 1–Å grid used to measure the radii rmin and rmax (represented in blue and yellow, respectively). As the size of the probe increased, the surface left by the probe was less grainy; also, the difference between the two radii decreased. When rC was ≥4.6 Å (F), the probe was not able to enter the pore. (G) Effective radii of capture, rC, for rmin and rmax plotted versus rP, the radius of the probe. The size of the hydrodynamic radius for K+ ion was obtained when rC matched the experimentally obtained capture radius of 0.82 Å (dashed line). The values for the K+ ion hydrodynamic radius were 3.8 and 4.1 Å for the comparison with the smaller and the bigger circle data, respectively (vertical arrows).
Figure 7.
Figure 7.
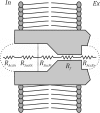
In-series connected resistance model. The conduction pathway was divided into five resistors connected in-series: the external and internal access resistances, RAccIn and RAccEx, respectively; the resistance of the section occupied by sucrose, RSucOc; the resistance of the sucrose-free section, RSucFr; and the selectivity filter, Rf. See Table 2 for details of resistance calculations.

Comment in

References

    1. Andersen O.S. 1983. Ion movement through gramicidin A channels. Studies on the diffusion-controlled association step. Biophys. J. 41:147–165. 10.1016/S0006-3495(83)84416-6 - DOI - PMC - PubMed
    1. Andersen O.S., and Procopio J.. 1980. Ion movement through gramicidin A channels. On the importance of the aqueous diffusion resistance and ion-water interactions. Acta Physiol. Scand. Suppl. 481:27–35. - PubMed
    1. Bezanilla F., and Armstrong C.M.. 1972. Negative conductance caused by entry of sodium and cesium ions into the potassium channels of squid axons. J. Gen. Physiol. 60:588–608. 10.1085/jgp.60.5.588 - DOI - PMC - PubMed
    1. Blatz A.L., and Magleby K.L.. 1986. Single apamin-blocked Ca-activated K+ channels of small conductance in cultured rat skeletal muscle. Nature. 323:718–720. 10.1038/323718a0 - DOI - PubMed
    1. Brelidze T.I., and Magleby K.L.. 2005. Probing the geometry of the inner vestibule of BK channels with sugars. J. Gen. Physiol. 126:105–121. 10.1085/jgp.200509286 - DOI - PMC - PubMed

Publication types

Substances