. 2015 Aug;146(2):161-72.
doi: 10.1085/jgp.201511359.

Sphingomyelinase D inhibits store-operated Ca2+ entry in T lymphocytes by suppressing ORAI current

Affiliations

Sphingomyelinase D inhibits store-operated Ca2+ entry in T lymphocytes by suppressing ORAI current

David J Combs et al. J Gen Physiol. 2015 Aug.

Abstract

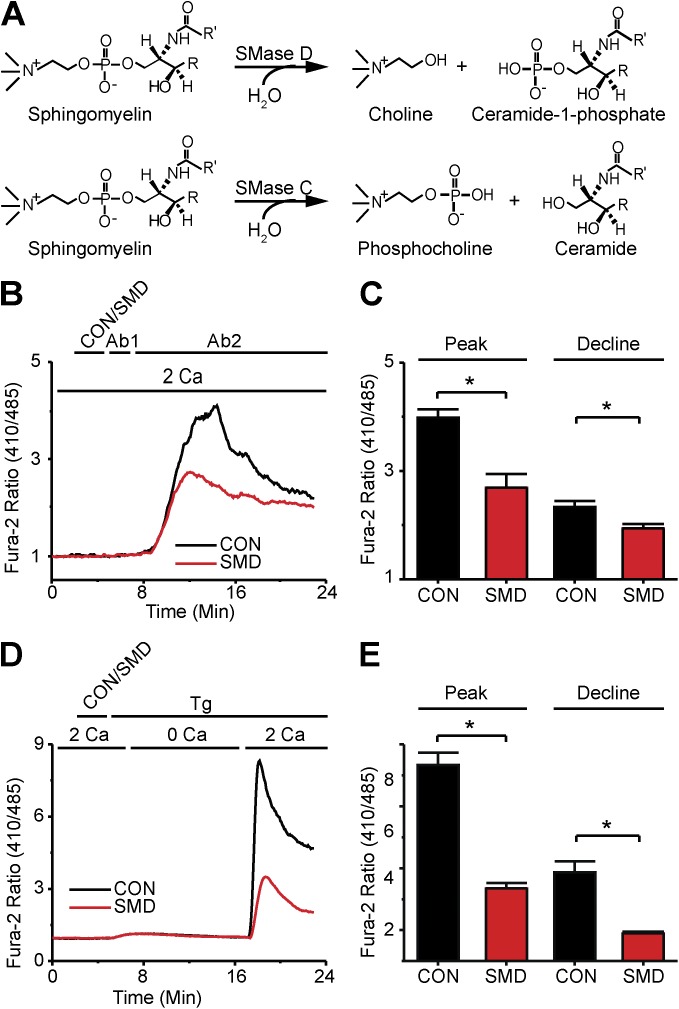
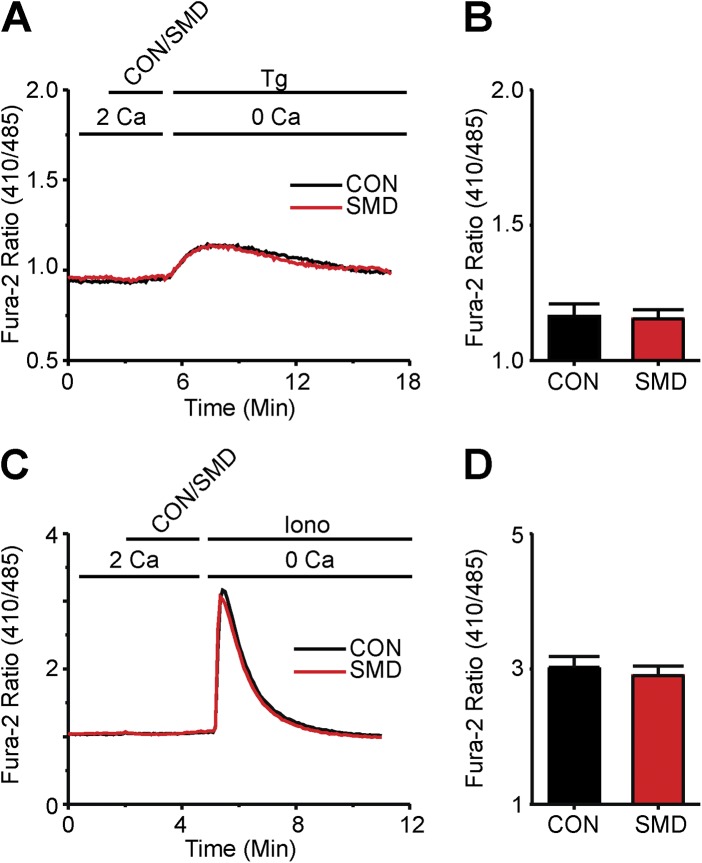
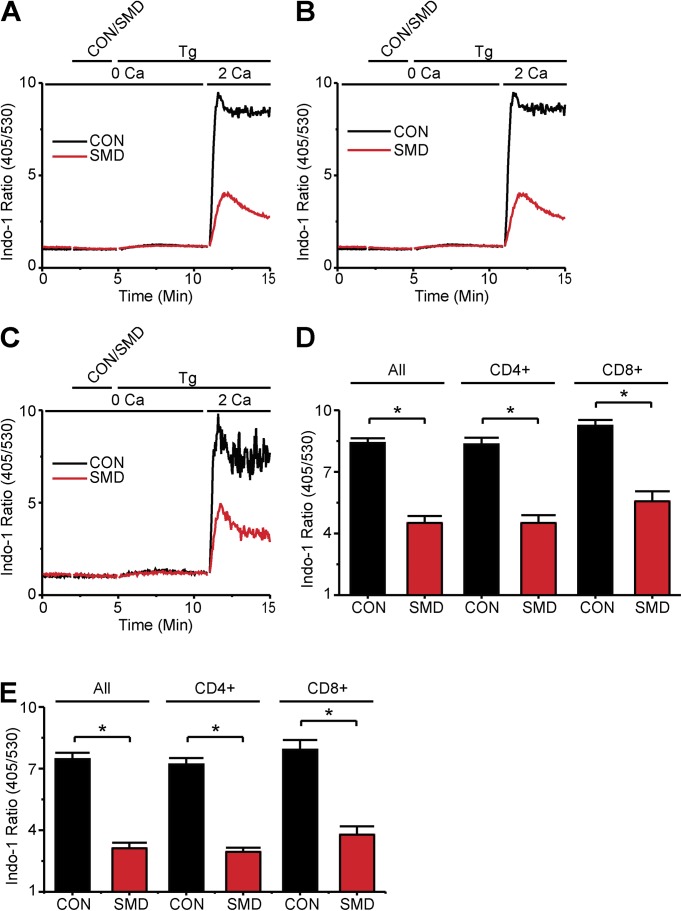
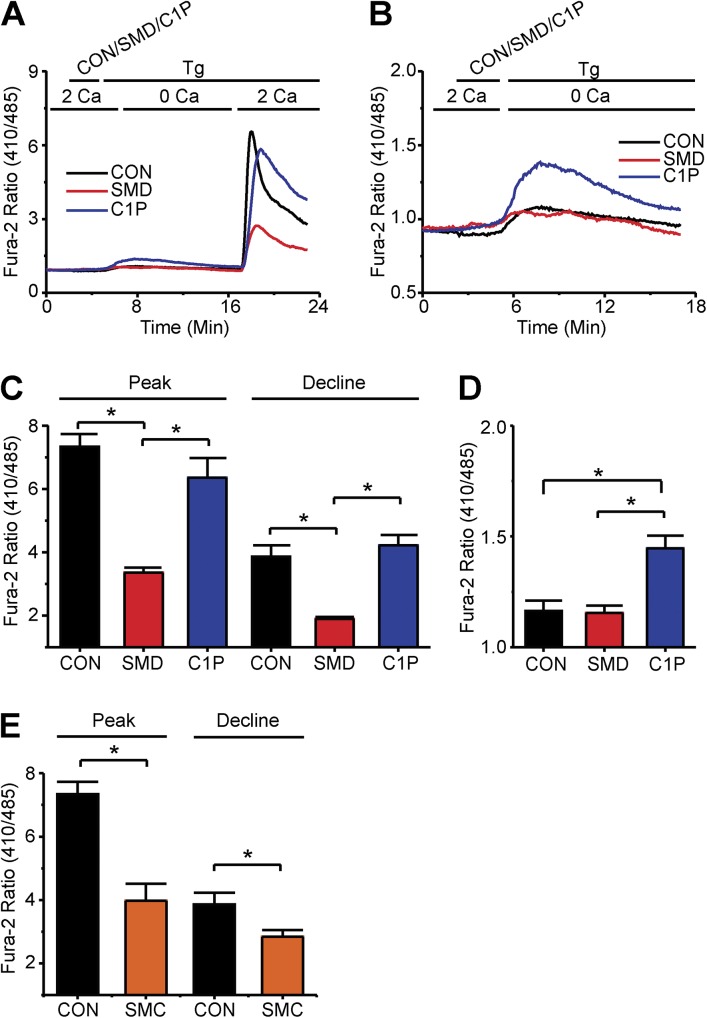
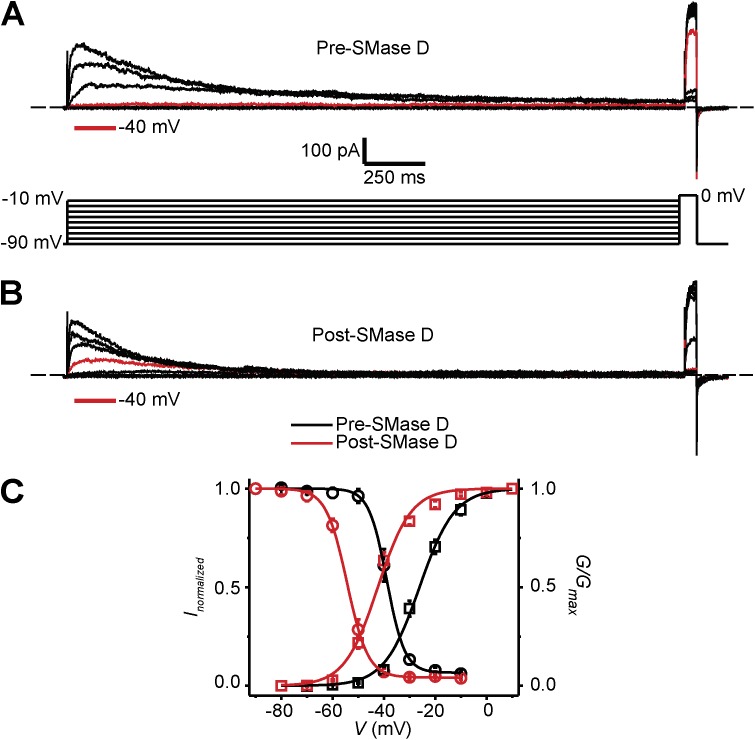
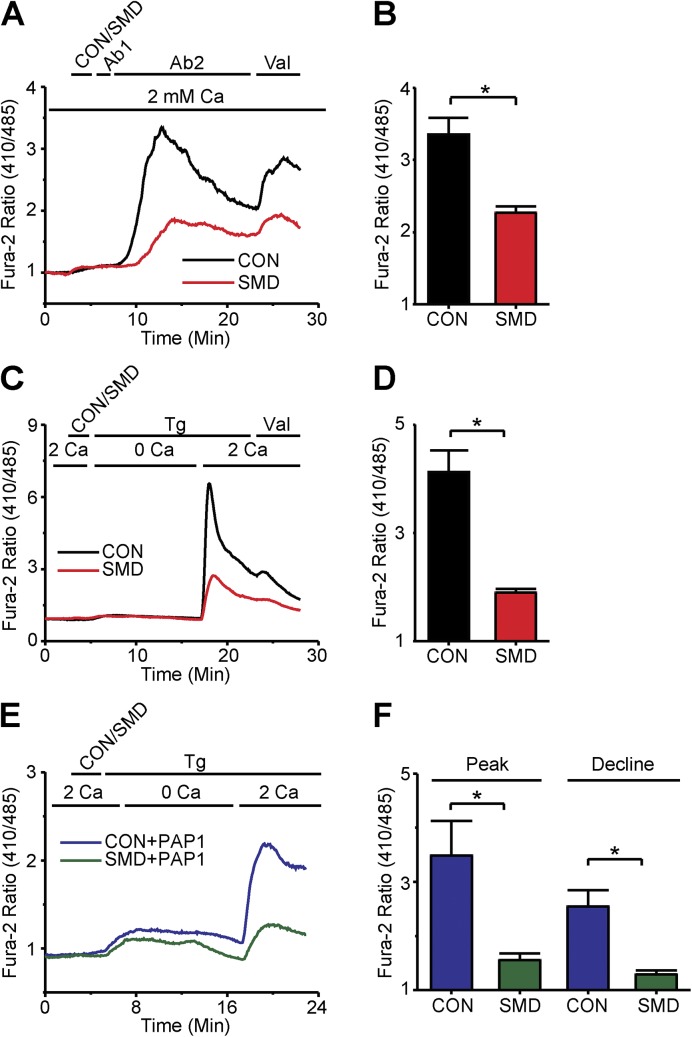
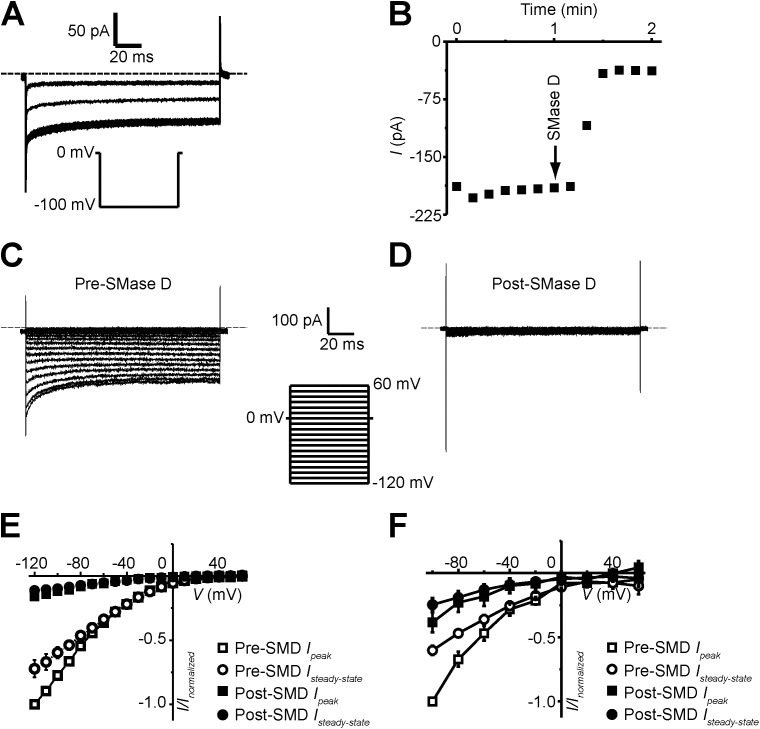
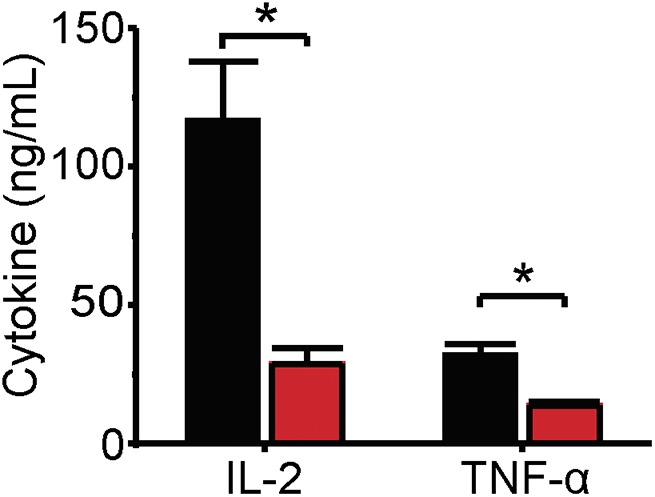
Infections caused by certain bacteria including Mycobacterium tuberculosis and Corynebacterium pseudotuberculosis provoke inflammatory responses characterized by the formation of granulomas with necrotic foci-so-called caseous necrosis. The granulomas of infected animals show prominent infiltration by T lymphocytes, and T cell depletion increases host mortality. Notorious zoonotic C. pseudotuberculosis secretes sphingomyelinase (SMase) D, a phospholipase that cleaves off the choline moiety of sphingomyelin, a phospholipid found primarily in the outer leaflet of host cell plasma membranes. Experimental C. pseudotuberculosis strains that lack SMase D are markedly less infectious and unable to spread in hosts, indicating that this enzyme is a crucial virulence factor for sustaining the caseous lymphadenitis infections caused by this microbe. However, the molecular mechanism by which SMase D helps bacteria evade the host's immune response remains unknown. Here, we find that SMase D inhibits store-operated Ca(2+) entry (SOCE) in human T cells and lowers the production of the SOCE-dependent cytokines interleukin-2, which is critical for T cell growth, proliferation, and differentiation, and tumor necrosis factor α, which is crucial for the formation and maintenance of granulomas in microbial infections. SMase D inhibits SOCE through a previously unknown mechanism, namely, suppression of Orai1 current, rather than through altering gating of voltage-gated K(+) channels. This finding suggests that, whereas certain genetic mutations abolish Orai1 activity causing severe combined immunodeficiency (SCID), bacteria have the ability to suppress Orai1 activity with SMase D to create an acquired, chronic SCID-like condition that allows persistent infection. Thus, in an example of how virulence factors can disrupt key membrane protein function by targeting phospholipids in host cell membranes, our study has uncovered a novel molecular mechanism that bacteria can use to thwart host immunity.


Figures

Figure 1.
Figure 1.
SMase D suppresses SOCE in human T lymphocytes. (A) Reaction schemes for SMase D (top) and SMase C (bottom). (B) Fura-2 ratio signals of (26–54) T cells in a single 40× field, where the records show the average signals relative to the resting levels. The upper bar above the panel indicates these treatments: after 2-min rest, cells were treated with either SMase D (SMD, red) or catalytically inactive enzyme (CON, black) for 3 min, and then with 5 µg anti-CD3ε (Ab1) antibody for 2 min, and finally with 5 µg anti-IgG (Ab2) antibody for 18 min; the lower bar shows the Ca2+-containing solution type. (C) Peak and declining phase (at 23 min) values (error bars represent mean ± SEM; n = 5) of Fura-2 ratio signals after antibody stimulation as shown in B. (D) Fura-2 ratio signals of (17–31) T cells as in B, where the upper bar above the panel refers to these treatments: after 2-min rest, cells were treated with SMD (red) or CON (black) for 3 min and 1 µg Tg for 18 min; the lower bar shows the Ca2+-containing solution type. (E) Peak and declining phase (23 min) values (error bars represent mean ± SEM; n = 5) of Fura-2 ratio signals from Tg-stimulated cells for experiments as shown in D. Where present, the asterisks denote statistically significant comparisons as detailed in Materials and methods.
Figure 2.
Figure 2.
SMase D does not alter internal store Ca2+ release in human T lymphocytes. (A) Fura-2 ratio signals from experiments shown in Fig. 1 D but with axes rescaled to better show the internal store release component for cells treated with SMase D (SMD, red) or catalytically inactive enzyme (CON, black). (B) Peak values (error bars represent mean ± SEM; n = 5) of Fura-2 ratio signals from Tg-stimulated cells in experiments as shown in A. (C) Fura-2 ratio signals of (38–84) T cells in a single 40× field, where the upper bar above the panel indicates these treatments: after 2-min rest, cells were treated with SMD (red) or CON (black) for 3 min, and then with 1 µg ionomycin (Iono) for 12 min; the lower bar shows the Ca2+-containing solution type. (D) Peak values (error bars represent mean ± SEM; n = 4) of Fura-2 ratio signals from ionomycin-stimulated cells in experiments as shown in C.
Figure 3.
Figure 3.
SMase D suppresses SOCE in CD4 and CD8 T lymphocyte subsets. (A–C) Indo-1 ratio signals of total T cells (A), CD4-positive T cells (B), and CD8-positive T cells (C), where the upper bar above each panel indicates the following: after 2-min rest, cells were treated with SMase D (SMD, red) or catalytically inactive enzyme (CON, black) for 3 min and 1 µg Tg for 10 min; the lower bar above each panel shows Ca2+-containing solution type before and after the addition of 5 µl of 100 mM CaCl2 at 11 min, which results in a final Ca2+ concentration of ∼2 mM. (D and E) Peak (D) and declining phase (E) values (error bars represent mean ± SEM; n = 5) of indo-2 ratio signals from Tg-stimulated cells for experiments as shown in A–C. Where present, the asterisks denote statistically significant comparisons as detailed in Materials and methods.
Figure 4.
Figure 4.
T lymphocyte SOCE is inhibited by SMases but not C1P. (A) Fura-2 ratio signals of (35–45) T cells, where the upper bar above the panel indicates treatments: after 2-min rest, cells were treated with SMase D (SMD, red), C1P (blue), or catalytically inactive enzyme (CON, black) for 3 min and 1 µg Tg for 18 min; the lower bar shows the Ca2+-containing solution type. Cells treated with C1P were also bathed in 0.5 mg/ml of C1P-containing solutions throughout the Tg treatment period. (B) Fura-2 ratio signals from experiments shown in A but with axes rescaled to better show the internal store release component for cells treated with SMD (red), C1P (blue), or CON (black). (C) Peak and declining phase (23 min) values (error bars represent mean ± SEM; n = 5) of Fura-2 ratio signals from Tg-stimulated cells for experiments as shown in A. (D) Peak values (error bars represent mean ± SEM; n = 5) of Fura-2 ratio signals from Tg-stimulated cells in experiments as shown in B. (E) Peak and declining phase values (error bars show mean ± SEM; n = 5) of Fura-2 ratio signals from Tg-stimulated cells treated with SMase C (SMC, orange) or CON (black). Where present, the asterisks denote statistically significant comparisons as detailed in Materials and methods.
Figure 5.
Figure 5.
Effect of SMase D on C-type inactivation of KV1.3 channels in human T lymphocytes. (A and B) KV1.3 currents elicited by stepping membrane voltage at 30-s intervals from the −100-mV holding potential to a first pulse between −90 and −10 mV in 10-mV increments followed by a second test pulse to 0 mV, before (A) and after (B) the addition of SMase D to the bath solution (0.25 µg/ml). Current traces for −40 mV are colored red; dashed lines indicate zero current levels. (C) G-V curves (squares) and h-infinity curves (circles) of KV1.3 channels in T cells before (black) and after (red) SMase D treatment; error bars represent means ± SEM (n = 5). The curves are fits of Boltzmann functions, yielding: V1/2 = −38.8 ± 0.2 mV and Z = 7.3 ± 0.4 (black circles); V1/2 = −54.4 ± 0.2 mV, Z = 6.3 ± 0.2, and c = 0.04 ± 0.01 (red circles); V1/2 = −26.1 ± 0.4 mV and Z = 3.7 ± 0.2 (black squares); and V1/2 = −42.4 ± 0.6 mV and Z = 4.0 ± 0.3 (red squares).
Figure 6.
Figure 6.
Inhibition of SOCE by SMase D does not depend on decreased K+ conductance. (A) Fura-2 ratio signal of (26–54) T cells in a single 40× field, where the upper bar above the panel indicates these treatments: after 2-min rest, cells were treated with either SMase D (SMD, red) or catalytically inactive enzyme (CON, black) for 3 min, 5 µg anti-CD3ε antibody (Ab1) for 2 min, 5 µg anti-IgG antibody (Ab2) for 18 min, and finally 1 µg valinomycin (Val) for 5 min; the lower bar shows the Ca2+-containing solution type. (B) Peak values (error bars represent mean ± SEM; n = 5) of Fura-2 ratio signals induced by valinomycin as shown in A. (C) Fura-2 ratio signal of (17–31) T cells as in A, where the upper bar above the panel indicates these treatments: after 2-min rest, cells were treated successively with SMD (red) or CON (black) for 3 min, 1 µg Tg for 18 min, and 1 µg valinomycin (Val) for 5 min; the lower bar shows the Ca2+-containing solution type. (D) Peak values (error bars represent mean ± SEM; n = 5) of the valinomycin-induced Fura-2 ratio signals from experiments as shown in C. (E) Fura-2 ratio signals of (19–48) T cells as in A but in the presence of 200 nM PAP-1 throughout, where the upper bar above the panel indicates these treatments: after 2-min rest, cells were treated with either SMD (green) or CON (blue) for 3 min and 1 µg Tg for 18 min; the lower bar shows the Ca2+-containing solution type. (F) Peak and declining phase values (error bars represent mean ± SEM; n = 7) of Fura-2 ratio signals from Tg-stimulated cells in the presence of PAP-1 as shown in E. Where present, the asterisks denote statistically significant comparisons as detailed in Materials and methods.
Figure 7.
Figure 7.
SMase D suppresses Orai1 currents. (A and B) Orai1 currents (A) and steady-state current time course (B) recorded in the presence of 20 mM [Ca2+]ext, elicited by stepping the voltage from the 0-mV holding potential to −100 mV. After the addition of 0.5 µg/ml SMase D, the current was suppressed. (C and D) Orai1 currents elicited by stepping the membrane voltage from the 0-mV holding potential to between −120 and 60 mV in 10-mV increments before (C) and after (D) the addition of SMase D to the bath solution. Dashed lines in A, C, and D indicate zero current levels, and currents traces are shown after correcting for background currents (i.e., those recorded in a nominally Ca2+-free solution). (E) I-V relations of peak (squares) and steady-state current (circles) before (open) and after (closed) treatment with 0.5 µg/ml SMase D. Peak currents in E were measured as the mean current over a 0.5-ms window 2.0 ms after the start of the voltage step, and steady-state currents in B and E were measured as the mean current of a 40-ms window 100 ms after the start of the voltage step in A and C, or D, respectively. (F) Jurkat whole-cell Orai1 I-V relations of peak (squares) and steady-state current (circles) before (open) and after (closed) treatment with 0.5 µg/ml SMase D. Error bars represent mean ± SEM.
Figure 8.
Figure 8.
SMase D suppresses IL-2 and TNF production. IL-2 and TNF concentrations (error bars represent means ± SEM; n = 5) in cell culture supernatants of human T lymphocytes stimulated with CD3 and CD28 antibody-coated beads in the presence of SMase D (red) or catalytically inactive enzyme (CON, black). Asterisks denote statistically significant comparisons as detailed in Materials and methods.

Comment in

Similar articles

Cited by

References

    1. Aggarwal B.B., Gupta S.C., and Kim J.H.. 2012. Historical perspectives on tumor necrosis factor and its superfamily: 25 years later, a golden journey. Blood. 119:651–665. 10.1182/blood-2011-04-325225 - DOI - PMC - PubMed
    1. Baird G.J., and Fontaine M.C.. 2007. Corynebacterium pseudotuberculosis and its role in ovine caseous lymphadenitis. J. Comp. Pathol. 137:179–210. 10.1016/j.jcpa.2007.07.002 - DOI - PubMed
    1. Breittmayer J.P., Bernard A., and Aussel C.. 1994. Regulation by sphingomyelinase and sphingosine of Ca2+ signals elicited by CD3 monoclonal antibody, thapsigargin, or ionomycin in the Jurkat T cell line. J. Biol. Chem. 269:5054–5058. - PubMed
    1. Cahalan M.D., and Chandy K.G.. 2009. The functional network of ion channels in T lymphocytes. Immunol. Rev. 231:59–87. 10.1111/j.1600-065X.2009.00816.x - DOI - PMC - PubMed
    1. Cahalan M.D., Chandy K.G., DeCoursey T.E., and Gupta S.. 1985. A voltage-gated potassium channel in human T lymphocytes. J. Physiol. 358:197–237. 10.1113/jphysiol.1985.sp015548 - DOI - PMC - PubMed

Publication types