. 2015 Sep 11;290(37):22662-77.
doi: 10.1074/jbc.M115.644799. Epub 2015 Jul 27.

Galectin-1 regulates tissue exit of specific dendritic cell populations

Affiliations

Galectin-1 regulates tissue exit of specific dendritic cell populations

Sandra Thiemann et al. J Biol Chem. .

Abstract

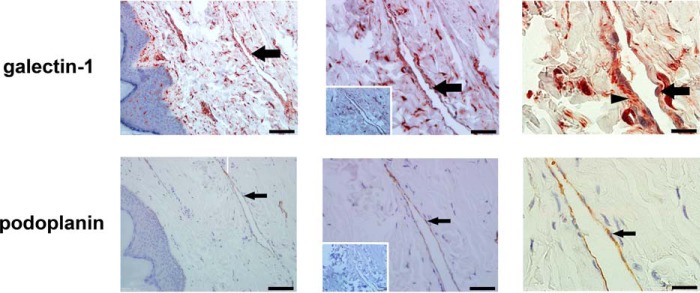
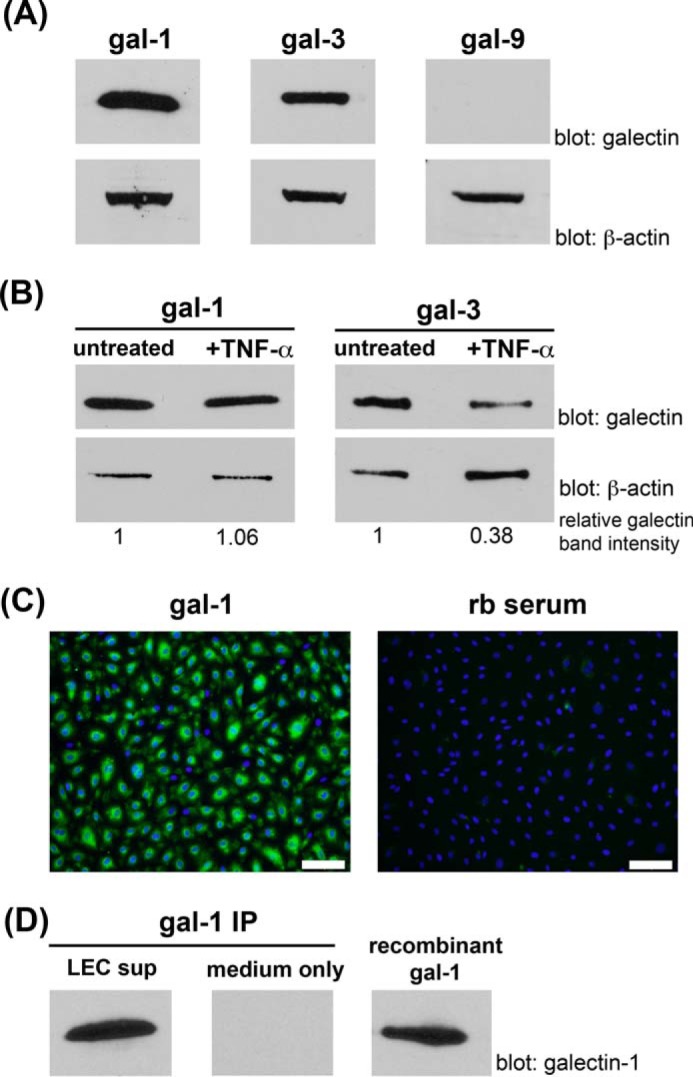
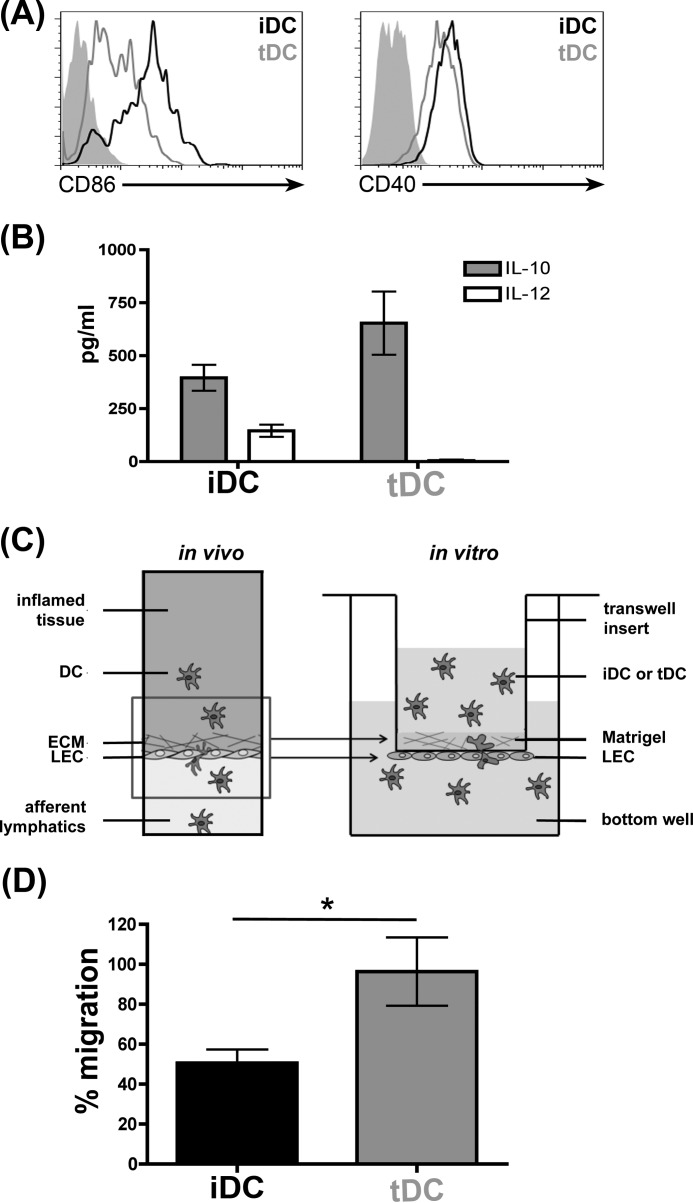
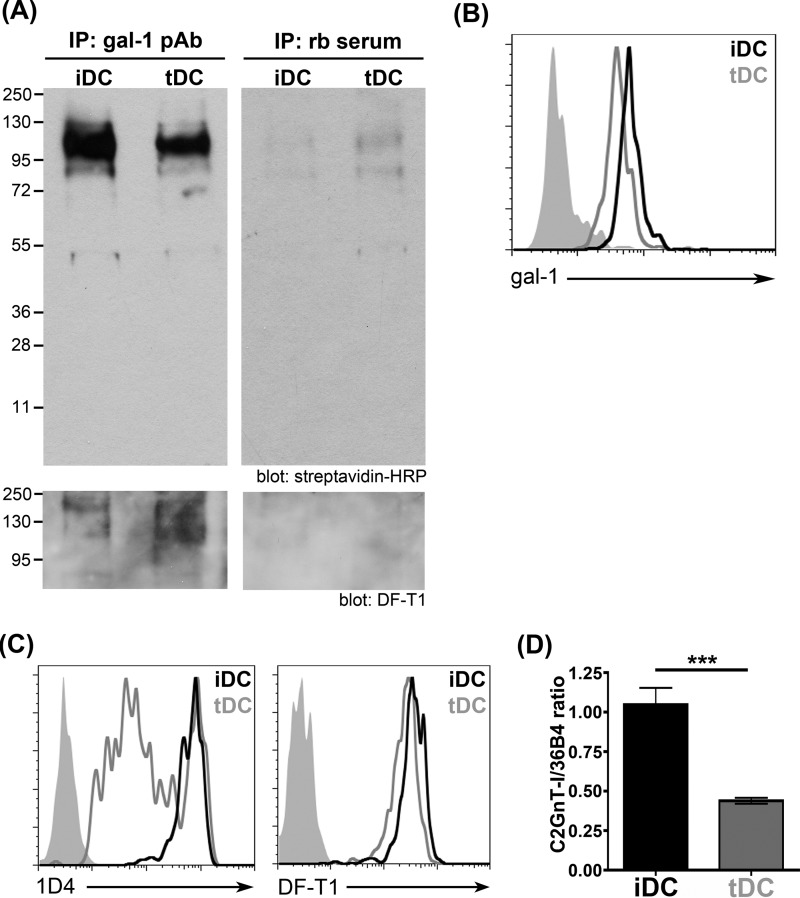
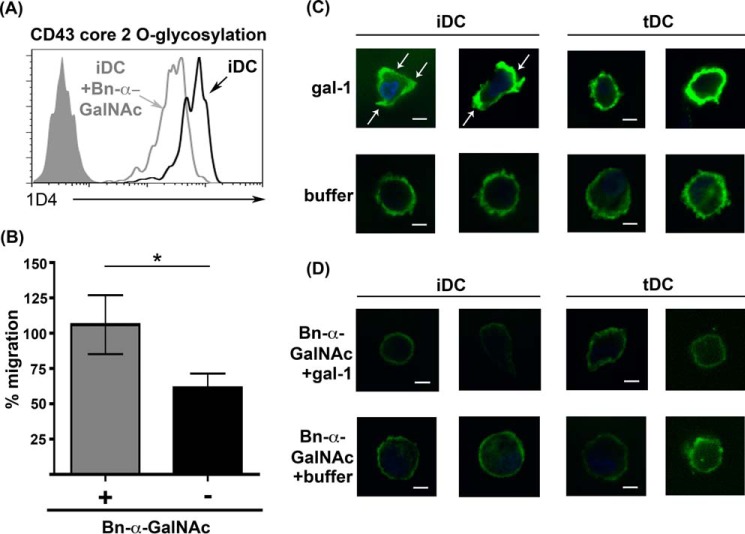
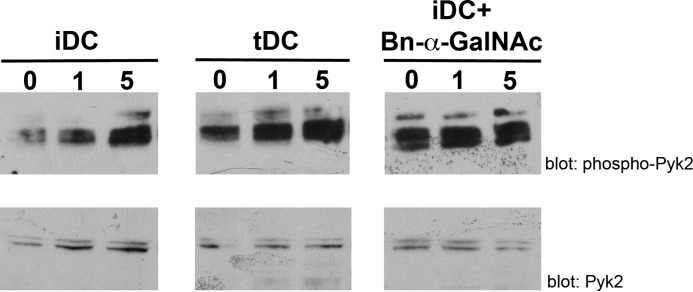
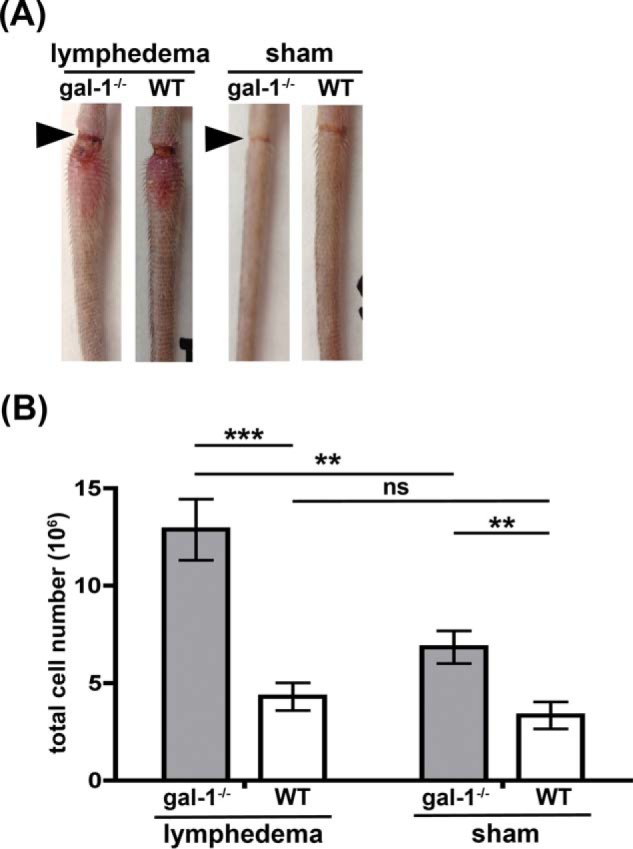
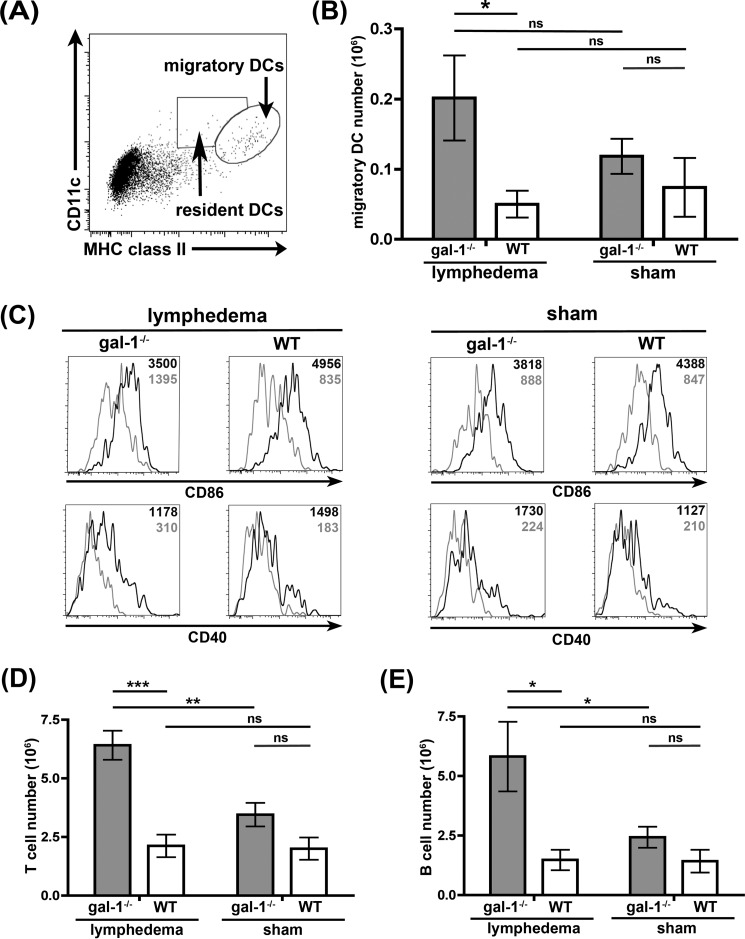
During inflammation, dendritic cells emigrate from inflamed tissue across the lymphatic endothelium into the lymphatic vasculature and travel to regional lymph nodes to initiate immune responses. However, the processes that regulate dendritic cell tissue egress and migration across the lymphatic endothelium are not well defined. The mammalian lectin galectin-1 is highly expressed by vascular endothelial cells in inflamed tissue and has been shown to regulate immune cell tissue entry into inflamed tissue. Here, we show that galectin-1 is also highly expressed by human lymphatic endothelial cells, and deposition of galectin-1 in extracellular matrix selectively regulates migration of specific human dendritic cell subsets. The presence of galectin-1 inhibits migration of immunogenic dendritic cells through the extracellular matrix and across lymphatic endothelial cells, but it has no effect on migration of tolerogenic dendritic cells. The major galectin-1 counter-receptor on both dendritic cell populations is the cell surface mucin CD43; differential core 2 O-glycosylation of CD43 between immunogenic dendritic cells and tolerogenic dendritic cells appears to contribute to the differential effect of galectin-1 on migration. Binding of galectin-1 to immunogenic dendritic cells reduces phosphorylation and activity of the protein-tyrosine kinase Pyk2, an effect that may also contribute to reduced migration of this subset. In a murine lymphedema model, galectin-1(-/-) animals had increased numbers of migratory dendritic cells in draining lymph nodes, specifically dendritic cells with an immunogenic phenotype. These findings define a novel role for galectin-1 in inhibiting tissue emigration of immunogenic, but not tolerogenic, dendritic cells, providing an additional mechanism by which galectin-1 can dampen immune responses.

Keywords: dendritic cell; endothelial cell; extracellular matrix; galectin; inflammation; migration.


Figures

FIGURE 1.
FIGURE 1.
Human lymphatic endothelial cells express and secrete galectin-1. Sections of skin from lymphedema patients were stained with polyclonal antibody against galectin-1 (top) or monoclonal antibody to the human LEC marker podoplanin (bottom). Bound antibody was detected with the corresponding secondary antibody and visualized using a 3-amino-9-ethylcarbazole chromogenic substrate system. Sections were counterstained with hematoxylin. Insets (middle column) show control antibody staining. Dilated lymphatic vessels are lined by LECs expressing galectin-1 (arrow, top) and podoplanin (arrow, bottom). Data are representative of six independent tissue samples. Note that the distribution of galectin-1 on LECs appears more dispersed than that of podoplanin, suggesting the localization of secreted galectin-1 in extracellular matrix (arrowhead, top right panel). Magnification is as follows: ×20 (left), ×40 (middle), and ×100 (right). Scale bar, 100 μm (left), 50 μm (middle), and 20 μm (right).
FIGURE 2.
FIGURE 2.
Cultured human LECs express and secrete galectin-1. A, primary human LECs were analyzed for expression of gal-1, gal-3, and gal-9 by immunoblot. B, primary human LECs were grown in the presence or absence of the inflammatory cytokine TNF-α for 24 h, and cell lysates were analyzed for expression of galectin-1 and galectin-3 by immunoblot. Densitometry quantification of the relative change in galectin expression is indicated at the bottom of the figure. Relative galectin band intensity was calculated for each sample as a ratio of the pixel intensity in the scanned galectin band over the β-actin band. The relative galectin band intensity of the untreated sample was assigned a value of 1, and the +TNF-α sample was displayed as a proportion of the untreated sample. Data are representative of four independent experiments. Galectin-1 expression remained abundant in TNF-α-treated LECs, although galectin-3 expression decreased significantly after TNF-α treatment. C, confluent LECs were fixed with 4% PFA, and surface galectin-1 was detected by immunofluorescence microscopy using pAb against galectin-1 and FITC-conjugated secondary antibody. Nuclei were visualized with DAPI staining. Galectin-1 is detectable on the cell surface indicating that galectin-1 secreted by LECs binds back to glycans on the LEC surface. Scale bar, 100 μm. rb serum, rabbit serum. D, serum-free medium supernatant from cultured human LECs (LEC sup) was collected, and galectin-1 protein was immunoprecipitated (IP) for detection by immunoblot. Abundant galectin-1 was detected in the LEC supernatant but not in LEC-free medium (medium only). Immunoprecipitation of galectin-1 from a control sample containing 125 ng of recombinant galectin-1 is shown for comparison (right).
FIGURE 3.
FIGURE 3.
iDCs and tDCs are distinct DC populations that differ in the ability to migrate through ECM and across LECs in the presence of galectin-1. A, phenotypic analysis of iDCs and tDCs. iDCs and tDCs were analyzed for expression of the cell surface markers CD86 and CD40 by flow cytometry. Although iDCs expressed high levels of CD86 and CD40, expression was lower on tDCs. Filled histograms are isotype controls. B, secretion of IL-10 and IL-12 by iDCs and tDCs. Although iDCs secreted significant levels of both IL-10 and IL-12, tDCs only secreted IL-10. Data are combined from four independent donors each analyzed in duplicate ± S.E. C, in vivo model of DCs emigrating from inflamed tissue across LECs in the basolateral-to-apical direction (left). In vitro model of DC migration assay through matrix and across LECs (right). LECs were grown to confluency on the underside of MatrigelTM-covered transwell inserts, and MatrigelTM was impregnated with recombinant galectin-1 or buffer alone. 5 × 10⁴ iDCs or tDCs labeled with CFSE were placed into the top chamber, and cells migrated to the bottom well (containing the chemoattractant MIP-3β) for 24 h. D, presence of galectin-1 inhibited migration of iDCs, but not tDCs, through the matrix and across LECs. Results are shown as % migration in the presence of galectin-1 in MatrigelTM/% migration in the absence of galectin-1 in MatrigelTM. Data are combined from four independent experiments ± S.E. *, p = 0.04.
FIGURE 4.
FIGURE 4.
Galectin-1 binds CD43 on iDCs and tDCs. A, iDCs and tDCs were incubated with recombinant galectin-1 for 1 h at 4 °C. iDCs and tDCs were biotinylated, incubated with recombinant galectin-1 for 1 h at 4 °C, and fixed with DTSSP. After chemical cross-linking, galectin-1 plus bound cell surface counter-receptors were immunoprecipitated (IP) with rabbit anti-galectin-1 pAb. Control samples were immunoprecipitated with rabbit serum (rb serum). Immunoprecipitates were separated on a 4–12% BisTris polyacrylamide gel in MOPS buffer. Blots were probed with streptavidin-horseradish peroxidase (HRP), stripped, and re-probed with antibody against CD43. A single band of ∼115 kDa was detected in samples from both iDCs and tDCs that reacted with the pan-specific CD43 mAb DF-T1. B, iDCs bind slightly more exogenous galectin-1 than tDCs. Recombinant biotinylated galectin-1 was added to iDCs and tDCs at 4 °C, and bound galectin-1 was detected with FITC-conjugated streptavidin. Data shown are representative of four independent experiments. Filled histogram is the rabbit serum (rb serum) control staining. C, differences in CD43 core 2 O-glycosylation on iDCs and tDCs were identified by flow cytometry using mAb 1D4 (left) that recognizes core 2 O-glycans on human CD43. Although iDCs and tDCs expressed equivalent levels of total CD43, detected by mAb DF-T1 (right), iDCs express significantly more CD43 decorated with core 2 O-glycans compared with tDCs. Filled histograms are isotype controls. D, β(1,6)-N-acetylglucosaminyltransferase (C2GnT-I) mRNA expression was analyzed by quantitative RT-PCR and normalized to expression of the housekeeping gene 36B4. Results are from three independent experiments ± S.E. ***, p = 0.001. iDCs express >3-fold more β(1,6)-N-acetylglucosaminyltransferase mRNA than tDCs, consistent with the higher expression of core 2 O-glycan modified CD43 on iDCs compared with tDCs in C.
FIGURE 5.
FIGURE 5.
Inhibition of O-glycosylation reverses galectin-1 inhibition of iDC migration and prevents CD43 clustering on iDCs in the presence of galectin-1. A, iDCs were treated with 2 mm Bn-α-GalNAc (iDC + Bn-α-GalNAc) or with buffer control (iDC). Expression of CD43 bearing core 2 O-glycans was analyzed by flow cytometry with the mAb 1D4. Filled histogram is the isotype control. Treatment with Bn-α-GalNAc decreased binding of mAb 1D4. B, in vitro migration assays were performed as described in Fig. 3C. Bn-α-GalNAc-treated and untreated iDCs were migrated across MatrigelTM plus LECs in the presence or absence of recombinant galectin-1 in MatrigelTM. Inhibition of O-glycan elongation reversed the inhibitory effect of galectin-1 on iDC migration. Results are shown as % migration in the presence of galectin-1 in MatrigelTM/% migration in the absence of galectin-1 in MatrigelTM. Results are representative of three independent experiments. Three replicate samples ± S.D. are shown for each data point, *, p = 0.019. C, iDCs or tDCs were treated with recombinant galectin-1 for 1 h at 37 °C. After fixation, samples were processed for confocal microscopy using antibody against CD43 (mAb DF-T1) and FITC-coupled secondary antibody. Galectin-1 clustered CD43 on iDCs (white arrows) but not on tDCs. Nuclei were visualized with DAPI. Two different images from different experiments are shown for each condition. Scale bar, 5 μm. D, iDCs or tDCs were treated with 2 mm Bn-α-GalNAc before recombinant galectin-1 was added for 1 h at 37 °C. Samples were processed as above. Inhibition of O-glycan elongation with Bn-α-GalNAc abrogated galectin-1-induced clustering of CD43 on iDCs. Two different images from different experiments are shown for each condition. Scale bar, 5 μm.
FIGURE 6.
FIGURE 6.
O-Glycan-dependent binding of galectin-1 regulates Pyk2 phosphorylation. iDCs, tDCs, or iDCs treated with 2 mm Bn-α-GalNAc were treated with 20 μm recombinant galectin-1 for 0, 1, or 5 min. Cell lysates were analyzed for phosphorylated Pyk2 and total Pyk2 protein expression. Phosphorylation of Pyk2 was lower in iDCs treated with galectin-1 compared with tDCs at the same time points. Bn-α-GalNAc treatment of iDCs prior to addition of galectin-1 increased Pyk2 phosphorylation.
FIGURE 7.
FIGURE 7.
Absence of galectin-1 in vivo increases the number of cells in regional lymph nodes. Superficial dermal lymphatics in the tail were cauterized in galectin-1−/− (gal-1−/−) and C57BL/6 (WT) animals to induce lymphedema. Animals were analyzed at day 6 post-surgery. A, edema adjacent to the incision site (arrowhead) was visible in animals when lymphatics were cauterized (lymphedema), while sham-treated animals (skin incision alone) had no edema. B, cell suspensions from tail-draining lymph nodes were counted to determine the total number of cells in the node. Lymph nodes from galectin-1−/− were larger (data not shown) and had more cells compared with lymph nodes from WT mice, and the difference was more pronounced in animals with lymphedema. Data are combined results of n >10 animals per group and five independent experiments ± S.E. ***, p < 0.0001; **, p = 0.034; ns, p > 0.2.
FIGURE 8.
FIGURE 8.
Increased numbers of migratory iDCs in draining lymph nodes in galectin-1−/− mice. A, identification of migratory and resident DCs. B220 lymph node cells were analyzed by flow cytometry for expression of CD11c and MHC class II as a marker for migratory DCs (CD11chigh/MHC class IIhigh). B, total number of migratory CD11chigh/MHC class IIhigh cells is shown for each group. Note the significant increase in migratory DCs in galectin-1−/− mice with lymphedema compared with control animals. Data are combined results of at least 10 animals per group and five independent experiments ± S.E. *, p = 0.0263; ns, p > 0.2. C, migratory DCs in draining lymph nodes have an immunogenic DC phenotype. When expression of CD86 and CD40 was compared on resident (gray line) and migratory (black line) DCs in the same animal, migratory DCs were CD86high, CD40high, as described for iDCs. Mean fluorescence intensities for CD86 or CD40 detection in both populations are indicated as black (migratory DCs) and gray (resident DCs) numbers inside the histograms. D, increased numbers of T cells in lymph nodes, detected by CD3 staining, from galectin-1−/− mice with lymphedema. Data are combined results of at least 10 animals per group and five independent experiments ± S.E. ***, p = 0.001; **, p = 0.0023, ns, p > 0.05. E, increased numbers of B cells, detected by CD19 staining, from galectin-1−/− mice with lymphedema. Data are combined results of at least 10 animals per group and five independent experiments ± S.E. *, p < 0.03; ns, p > 0.2. Note that the increase in migratory DCs (B) correlates with the increased T and B cell numbers in lymph nodes of galectin-1−/− animals.

Similar articles

Cited by

References

    1. Luster A. D., Alon R., von Andrian U. H. (2005) Immune cell migration in inflammation: present and future therapeutic targets. Nat. Immunol. 6, 1182–1190 - PubMed
    1. Ley K., Laudanna C., Cybulsky M. I., Nourshargh S. (2007) Getting to the site of inflammation: the leukocyte adhesion cascade updated. Nat. Rev. Immunol. 7, 678–689 - PubMed
    1. Merad M., Sathe P., Helft J., Miller J., Mortha A. (2013) The dendritic cell lineage: ontogeny and function of dendritic cells and their subsets in the steady state and the inflamed setting. Annu. Rev. Immunol. 31, 563–604 - PMC - PubMed
    1. Segura E., Amigorena S. (2013) Inflammatory dendritic cells in mice and humans. Trends Immunol. 34, 440–445 - PubMed
    1. Malissen B., Tamoutounour S., Henri S. (2014) The origins and functions of dendritic cells and macrophages in the skin. Nat. Rev. Immunol. 14, 417–428 - PubMed

Publication types

MeSH terms