. 2015 Aug 3;210(3):419-33.
doi: 10.1083/jcb.201411037. Epub 2015 Jul 27.

Endocytosis-dependent coordination of multiple actin regulators is required for wound healing

Affiliations

Endocytosis-dependent coordination of multiple actin regulators is required for wound healing

Yutaka Matsubayashi et al. J Cell Biol. .

Erratum in

Abstract

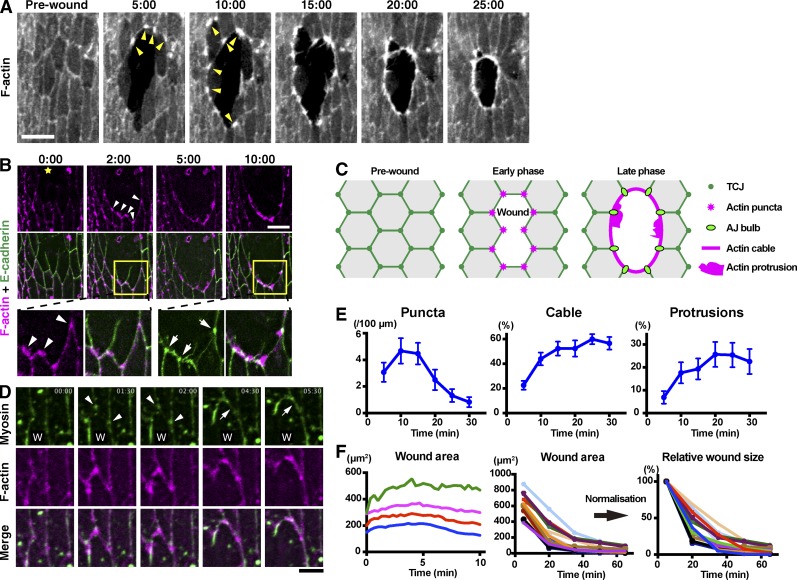
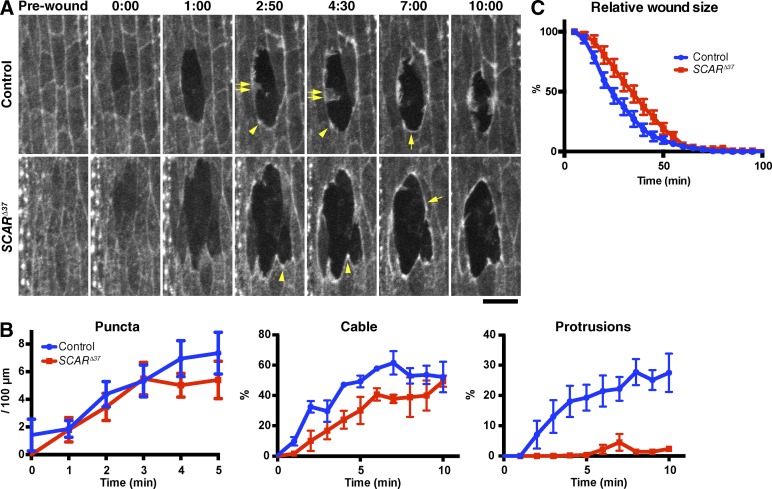
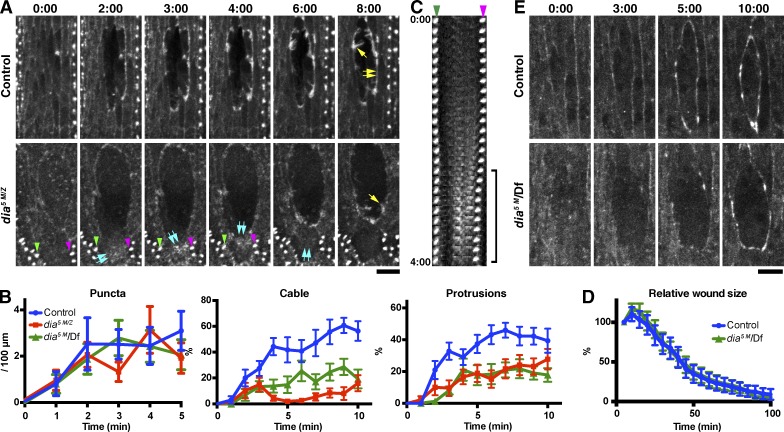
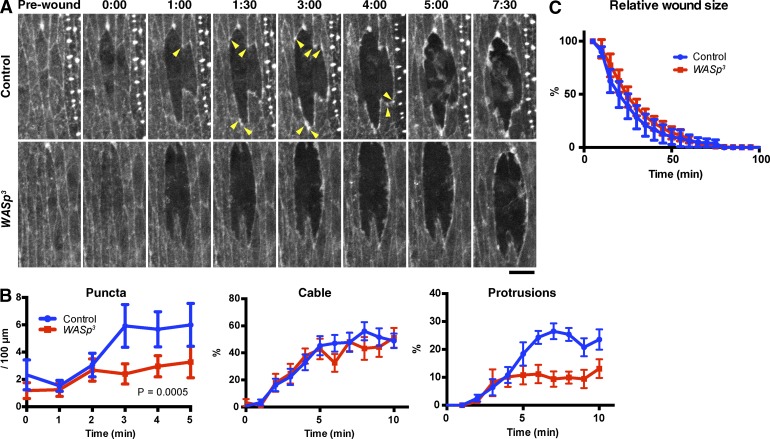
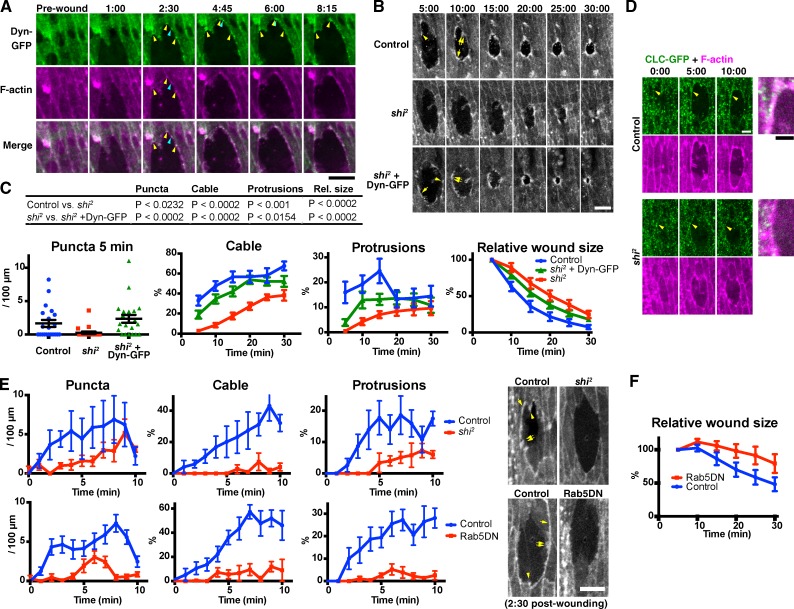
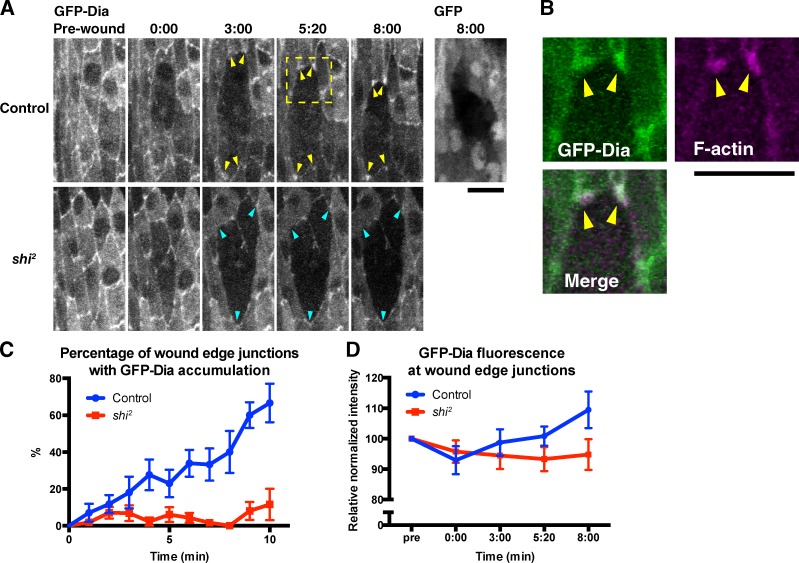
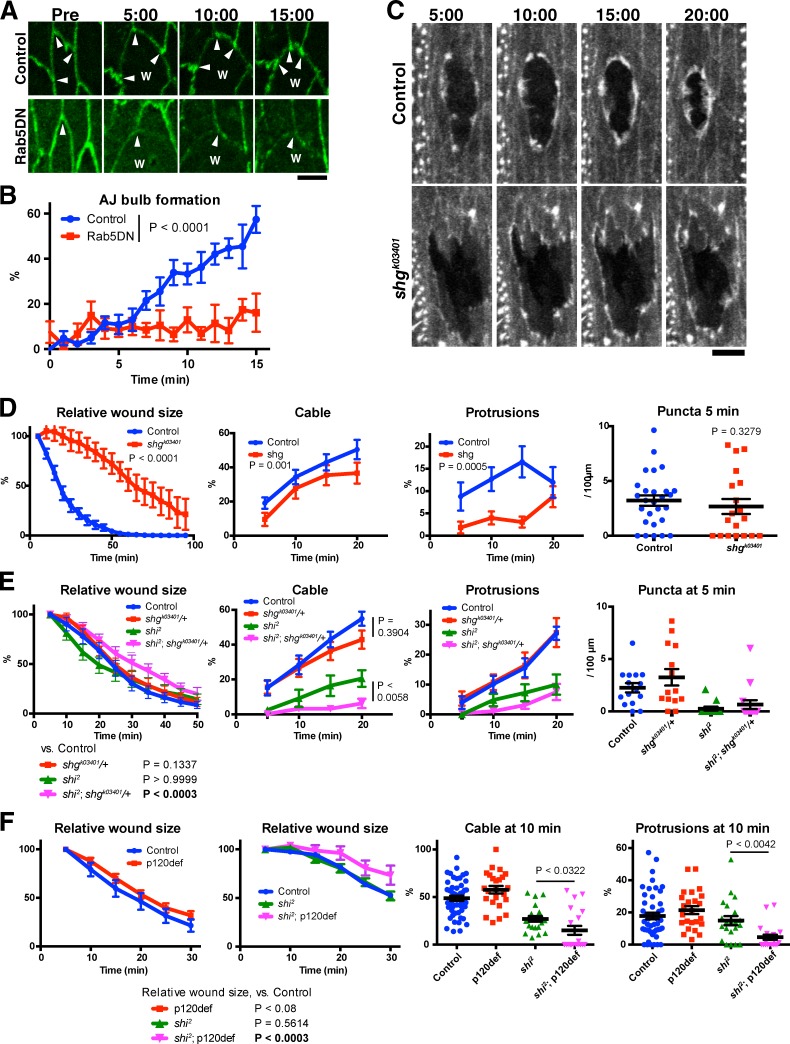
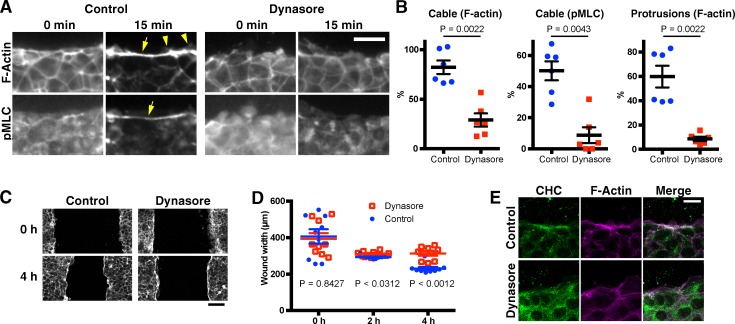
The ability to heal wounds efficiently is essential for life. After wounding of an epithelium, the cells bordering the wound form dynamic actin protrusions and/or a contractile actomyosin cable, and these actin structures drive wound closure. Despite their importance in wound healing, the molecular mechanisms that regulate the assembly of these actin structures at wound edges are not well understood. In this paper, using Drosophila melanogaster embryos, we demonstrate that Diaphanous, SCAR, and WASp play distinct but overlapping roles in regulating actin assembly during wound healing. Moreover, we show that endocytosis is essential for wound edge actin assembly and wound closure. We identify adherens junctions (AJs) as a key target of endocytosis during wound healing and propose that endocytic remodeling of AJs is required to form "signaling centers" along the wound edge that control actin assembly. We conclude that coordination of actin assembly, AJ remodeling, and membrane traffic is required for the construction of a motile leading edge during wound healing.


Figures

Figure 1.
Figure 1.
Dynamics of F-actin, E-cadherin, and Myosin at wound edges. (A) Time course of wound closure in Drosophila embryo expressing GFP-Moesin in the epidermis. Arrowheads indicate representative wound edge actin puncta. (B) The epidermis of a Drosophila embryo expressing the F-actin probe mCherry-Moesin (magenta) and E-cadherin–GFP (green) was wounded at the position marked by a yellow star and subjected to time-lapse live imaging. Bottom images show enlarged and enhanced images of the areas indicated by yellow squares in middle images. Arrowheads indicate actin puncta appearing at former-TCJs. Arrows indicate pronounced accumulations of E-cadherin where neighboring cells abut one another at the wound edge. (C) Cartoon illustrating the relationship between actin assembly and cell–cell junctions during wound healing. (D) Wound healing in an embryo expressing GFP-Zipper and mCherry-Moesin. W indicates position of wound. Arrowheads indicate myosin accumulations appearing and then enlarging at former-TCJs along the wound edge. Arrows indicate the formation of a link between two neighboring myosin accumulations. See also Video 1. (E) Wound closure was live imaged in embryos expressing GFP-Moesin and the prevalence of actin puncta, cable, and protrusions throughout the process was quantified as described in Materials and methods (graphs show means ± SEM; n = 10–15 embryos). (F) GFP-Moesin–expressing embryos were wounded, and wound area throughout closure was measured. (left) Wound area in first 10 min after wounding plotted against time at 20-s intervals. Data from four individual embryos are shown. The wounds expanded until ∼5 min and then began to reduce in area. (middle) Wound area throughout closure for 15 individual wounds of varying size measured at 15-min intervals until 65 min after wounding. Note that the wounds all close over a broadly consistent time course and with similar dynamics. (right) Data in middle graph were normalized against the area at 5 min. Time points indicate time after wounding (minutes and seconds) in A, B, and D. Bars: (A and B) 10 µm; (D) 5 µm.
Figure 2.
Figure 2.
SCAR function in actin remodeling at wound edges. (A) Control and SCARΔ37 zygotic mutant embryos expressing GFP-Moesin were wounded and subjected to time-lapse imaging. Time points after wounding (minutes and seconds) are indicated. Note that although the actin puncta (arrowheads) and cable (single allows) appear in both the control and mutant embryos, the formation of actin protrusions (double allows) is severely reduced in the mutant, making its wound circumference markedly smoother than that of control. See also Video 2. Bar, 10 µm. (B) Quantitation of wound edge actin puncta, cable, and protrusion levels in control and zygotic SCARΔ37 embryos in the early phase of wound closure. n = 7–9 embryos. (C) Quantitation of wound closure in control and SCARΔ37 zygotic mutant embryos. Wound areas were normalized to the value at 5 min after wounding and plotted against time, as in Fig. 1 F. n = 4–17 embryos. Graphs show means ± SEM of the data.
Figure 3.
Figure 3.
Dia function in actin remodeling at wound edges. (A) Time-lapse imaging of GFP-Moesin expressed in a control or dia5 M/Z embryo. Yellow single arrows indicate actin protrusions; yellow double arrows indicate actin cable. Blue double arrows in the dia5 M/Z images indicate diffuse assemblies of F-actin within a wound edge cell, which appear at 2 min, move upwards in the cell until 4 min and disappear by 6 min. See also Video 3. The denticles indicated by the green and magenta arrowheads in the dia5 M/Z images are visible in the kymograph in C. (B) Quantitation of wound edge actin puncta, cable, and protrusion levels in control, dia5 M/Z, and dia5 M/Df embryos in the early phase of wound closure. n = 9–13 embryos. (C) Kymograph analysis of the correlation between the formation of diffuse F-actin assemblies and cell contraction. The two denticles indicated by the green and magenta arrowheads in this panel and in A are equivalent. Note that the distance between the two denticles decreases when assemblies of F-actin (equivalent to blue double arrows in A) appear between them (bracket), consistent with this F-actin causing cell contraction. Images taken every 10 s until 4 min after wounding are shown. (D) Quantitation of wound closure in control and dia5 M/Df embryos. Wound areas were normalized to the value at 5 min after wounding and plotted against time. n = 3–13 embryos. (E) Time-lapse imaging of GFP-Spaghetti-squash expressed in a control (+/Df) or dia5 M/Df embryo. Time points indicate time after wounding (minutes and seconds). Graphs show means ± SEM of the data. Bars, 10 µm.
Figure 4.
Figure 4.
WASp function in actin remodeling at wound edges. (A) Time-lapse imaging of GFP-Moesin expressed in a control or wasp3 zygotic mutant embryo. Arrowheads indicate actin puncta. Time points indicate time after wounding (minutes and seconds). Bar, 10 µm. (B) Quantitation of wound edge actin puncta (left), cable (middle), and protrusions (right). n = 7–11 embryos. (C) Quantification of wound closure. Wound areas were normalized against the value at 5 min after wounding and plotted against time. n = 6–8 embryos. Graph show means ± SEM of the data.
Figure 5.
Figure 5.
Endocytosis is required for wound edge actin remodeling and wound closure. (A) Time-lapse live imaging of an embryo expressing Dynamin-GFP (Dyn-GFP, green) and mCherry-Moesin (magenta). At 2 min and 30 s, Dynamin-GFP and F-actin colocalize at puncta on the wound edge, at (yellow arrowheads) and also outside (blue arrowheads) former-TCJs. The Dynamin-GFP puncta at former-TCJs were relatively stable and stationary, whereas those at other sites were more transient and mobile. See also Video 4. (B) Time-lapse live imaging of mCherry-Moesin, expressed in control and shi2 embryos (top and middle rows, respectively), and a shi2 embryo expressing Dynamin-GFP (shi2 + Dyn-GFP, bottom row). Representative actin puncta (arrowheads), cables (single arrows), and protrusions (double arrows) are indicated. (C) Quantitation of wound edge actin puncta, cable, protrusions, and wound closure (left to right, respectively) in control embryos, shi2 embryos, and shi2 embryos expressing Dynamin-GFP. Note that puncta were quantified only at 5 min because at later time points, they are obscured by the actin cable and protrusions (see also Fig. 1). n = 12–21 embryos (actin puncta, cable, and protrusions) or 15–16 (wound closure). For the measurement of wound closure, wound area was normalized against the value at 5 min after wounding. The table at the top summarizes the results of statistical analyses of the data. (D) Time-lapse live imaging of a control or shi2 mutant embryo expressing Clathrin light chain-GFP (CLC-GFP; green) and mCherry-Moesin (magenta). Merged images at the right show the wound edge around the arrowheads in the 10:00 images. Note the punctate accumulations of Clathrin-GFP at the wound edge in the control but not in shi2 embryos (arrowheads). (E, top) A more detailed analysis of the formation of actin structures in control or shi2 embryos in the early phase of wound closure. Here, F-actin was visualized using GFP-Moesin. The results confirm the actin remodeling defects observed for shi2 embryos in the longer term analysis in B and C. n = 3–4 embryos. (bottom) Quantitation of actin puncta, cable, and protrusions in control or Rab5DN-expressing embryos. F-actin was visualized using GFP-Moesin. n = 6–8 embryos. Photographs at the right are representative images at 2 min and 30 s after wounding, of the embryos of indicated genotype. See also Videos 5 and 6. (F) Quantitation of wound closure control or Rab5DN-expressing embryos, performed as in C, rightmost graph. n = 10–11. Time points indicate time after wounding (minutes and seconds). Bars, 10 µm. All experiments involving shi2 were performed at 30°C, the restrictive temperature of this mutant. Bars in column scatter plot (C, left) indicate means ± SEM of all plotted values. Line graphs in C, E, and F show means ± SEM of the data.
Figure 6.
Figure 6.
Dynamin-dependent relocalization of Dia during wound healing. (A, top) Time-lapse live imaging of embryos expressing GFP-Dia or GFP together with mCherry-Moesin in wild-type embryos. Note that GFP-Dia is recruited to wound edge junctions after wounding (arrowheads), whereas GFP alone is not (rightmost image). (bottom) Behavior of GFP-Dia in a wounded shi2 embryo. Note that the fluorescence level at wound edge junctions does not increase (arrowheads). Time points indicate time after wounding (minutes and seconds). (B) The enlarged images of GFP-Dia (green) and mCherry-Moesin (magenta) in the area indicated by the dashed square in A (Control, 8:20). Note the colocalization of GFP-Dia and actin puncta (arrowheads). (C and D) Dia accumulation over the course of wound healing in wild-type and shi2 embryos, measured in two distinct ways as described in Materials and methods. (C) Semiquantification based on the size and brightness of GFP-Dia accumulation at wound edge junctions. n = 5–7 embryos. Each image contained 3–23 wound edge junctions. (D) Quantification of the GFP-Dia fluorescence intensity at wound edge junctions. n = 27–31. Note that in both C and D, the value indicating the accumulation of GFP-Dia increases after wounding in control but not shi2 embryos. All experiments were performed at 30°C. Graphs show means ± SEM of the data. Bars, 10 µm.
Figure 7.
Figure 7.
Genetic interactions between Dynamin and AJ components. (A and B) Effect of Rab5DN on the formation of wound edge AJ bulbs. (A) Representative images of control and Rab5DN-expressing embryos prewounding (Pre) and at the indicated time points after wounding. Note the presence (control) and absence (Rab5DN) of AJ bulbs at wound edge (arrowheads). The images of Rab5DN embryos were enhanced to highlight the shape of wound edge junctions. W indicates position of wound. (B) Quantification of AJ bulb formation over the course of wound healing in control and Rab5DN-expressing embryos, measured as described in Materials and methods. n = 6 or 7 embryos. Each image contained 3–23 wound edge junctions. (C and D) Analysis of the wound healing of zygotic homozygous shg mutant embryos. (C) Representative images of F-actin visualized using GFP-Moesin in embryos with indicated genotype at indicated time points. (D) Normalized wound area and the formation of actin puncta, cable, and protrusions in embryos of the indicated genotypes were quantified and plotted (left to right, respectively). n = 5–27 embryos. (E) Analysis of the effect on wound closure and wound edge actin remodeling of loss of one copy of shg in a wild-type (control) or shi2 background. Normalized wound area and the formation of actin puncta, cable, and protrusions in embryos of the indicated genotypes were quantified and plotted (left to right, respectively). n = 8–22 embryos. (F) Analysis of the effect on wound closure (left two graphs, n = 15–20), and wound edge actin remodeling (right two graphs) of loss of both maternal and zygotic p120ctn (p120def) from wild-type (control) or shi2 embryos. Normalized wound area and the formation of actin cable and protrusions in embryos of the indicated genotypes were quantified and plotted. All experiments were performed at 25°C. Time points indicate time after wounding (minutes and seconds). Bars indicate the means ± SEM of all plotted values. Bars: (A) 5 µm; (C) 10 µm.
Figure 8.
Figure 8.
Dynasore inhibits wound edge actin remodeling by mammalian cells. Confluent monolayers of mIMCD3 mouse kidney epithelial cells were scratch wounded after treatment with DMSO (control) or 80 µM dynasore, a chemical inhibitor of Dynamin. At the indicated time points, the cells were fixed and stained with rhodamine-phalloidin and antibodies against phospho (=activated) myosin light chain (pMLC) or clathrin heavy chain (CHC), to examine the formation of an actomyosin cable and actin protrusions at the wound edge and the intracellular localization of clathrin. (A) Representative phalloidin and anti-pMLC images of control and dynasore-treated cells at 0 and 15 min after wounding. Arrows and arrowheads indicate the actin (myosin) cable and protrusions, respectively. (B) Cable and protrusion formation in the images 15 min after wounding was quantified. Cable formation was quantified using both the F-actin and pMLC images. Protrusions were quantified using the F-actin images. Note that the formation of both actin cable and protrusions are inhibited by dynasore. (C) Low magnification phalloidin images at 0 and 4 h after wounding. Note that the advancement of the cell sheets is inhibited by dynasore. At 4 h, a wound edge actin cable is observed, even for dynasore-treated cell sheets. (D) Quantification of wound width in each sample at the indicated time points. (E) Representative phalloidin and anti–clathrin heavy chain images of control and dynasore-treated cells at 15 min after wounding. Bars in the column scatter plots indicate means ± SEM of all plotted values. Line graphs show means ± SEM of the data. Bars: (A and E) 20 µm; (C) 100 µm.

Similar articles

Cited by

References

    1. Abreu-Blanco M.T., Verboon J.M., Liu R., Watts J.J., and Parkhurst S.M.. 2012. Drosophila embryos close epithelial wounds using a combination of cellular protrusions and an actomyosin purse string. J. Cell Sci. 125:5984–5997. 10.1242/jcs.109066 - DOI - PMC - PubMed
    1. Afshar K., Stuart B., and Wasserman S.A.. 2000. Functional analysis of the Drosophila diaphanous FH protein in early embryonic development. Development. 127:1887–1897. - PubMed
    1. Antunes M., Pereira T., Cordeiro J.V., Almeida L., and Jacinto A.. 2013. Coordinated waves of actomyosin flow and apical cell constriction immediately after wounding. J. Cell Biol. 202:365–379. 10.1083/jcb.201211039 - DOI - PMC - PubMed
    1. Bement W.M., Forscher P., and Mooseker M.S.. 1993. A novel cytoskeletal structure involved in purse string wound closure and cell polarity maintenance. J. Cell Biol. 121:565–578. 10.1083/jcb.121.3.565 - DOI - PMC - PubMed
    1. Ben-Yaacov S., Le Borgne R., Abramson I., Schweisguth F., and Schejter E.D.. 2001. Wasp, the Drosophila Wiskott-Aldrich syndrome gene homologue, is required for cell fate decisions mediated by Notch signaling. J. Cell Biol. 152:1–13. 10.1083/jcb.152.1.1 - DOI - PMC - PubMed

Publication types

MeSH terms