. 2015 Aug 18;112(33):10443-8.
doi: 10.1073/pnas.1513341112. Epub 2015 Jul 27.

Roles of unphosphorylated ISGF3 in HCV infection and interferon responsiveness

Affiliations

Roles of unphosphorylated ISGF3 in HCV infection and interferon responsiveness

Pil Soo Sung et al. Proc Natl Acad Sci U S A. .

Abstract

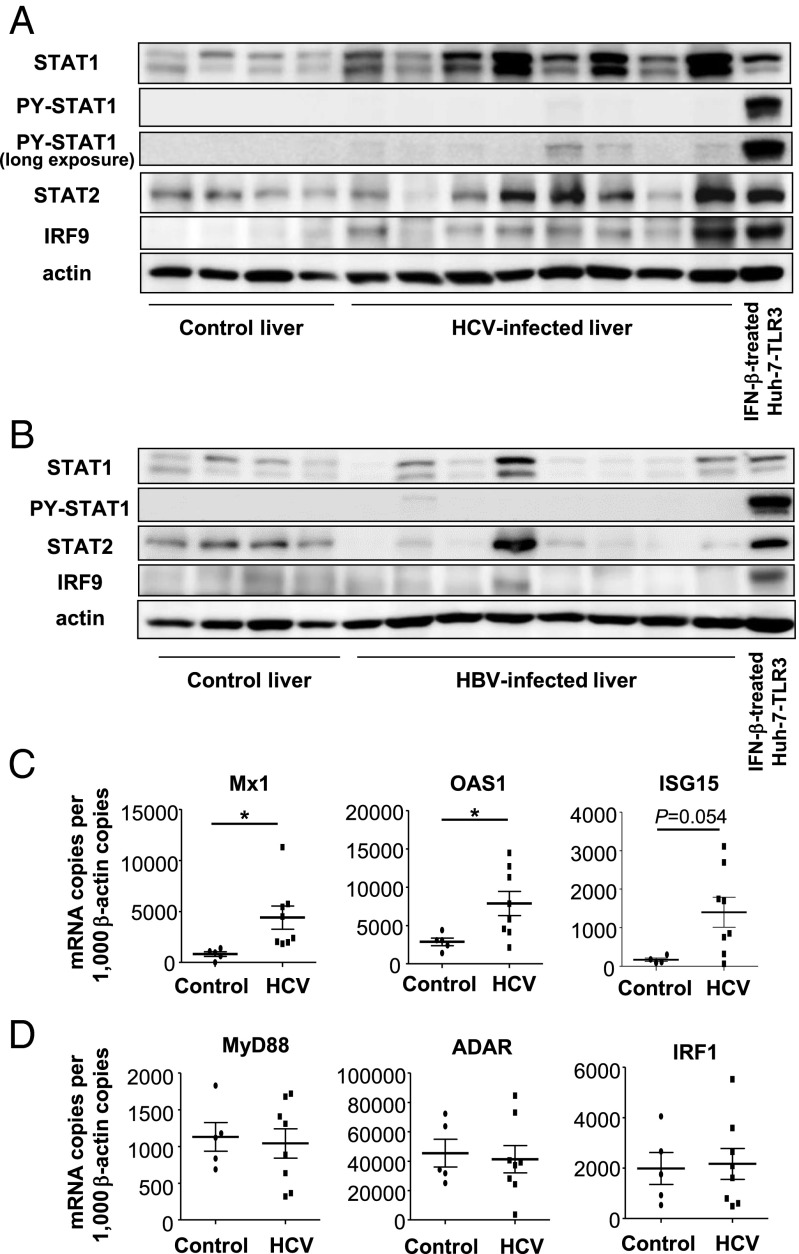
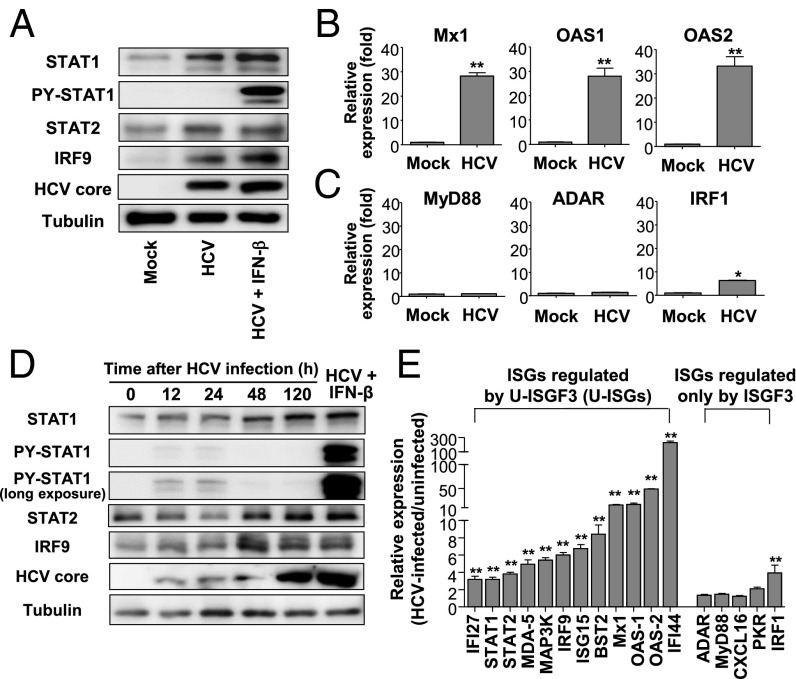
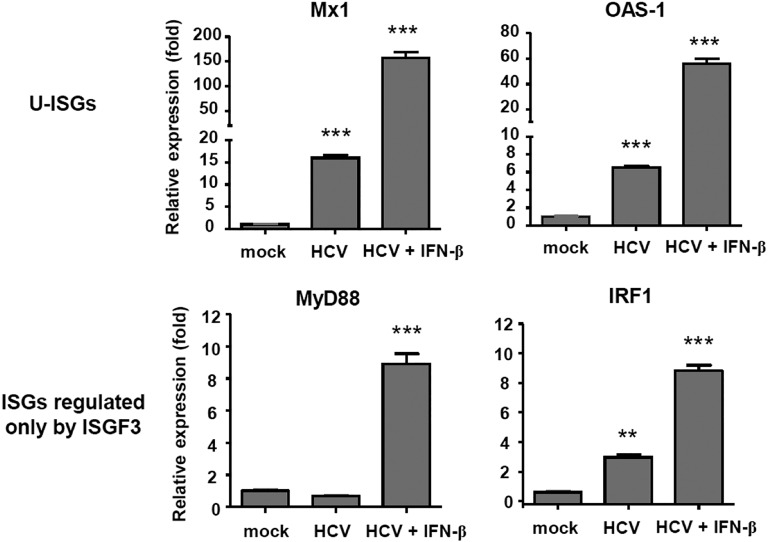
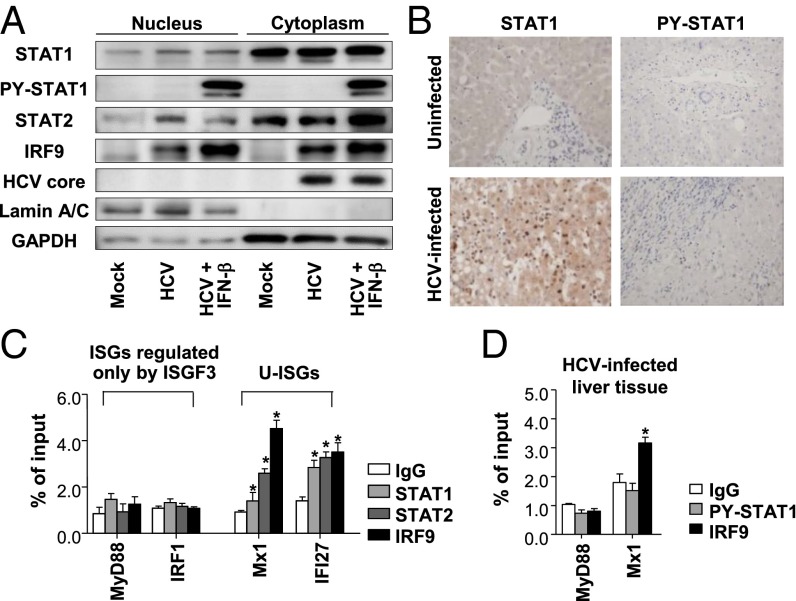
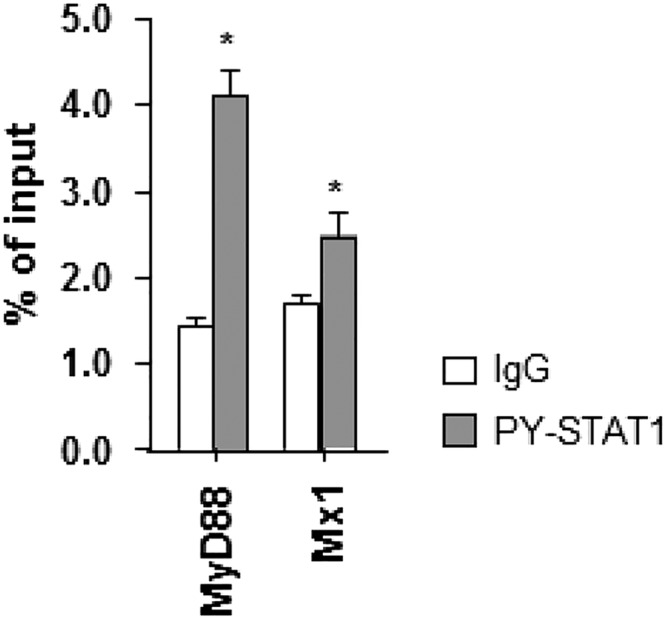
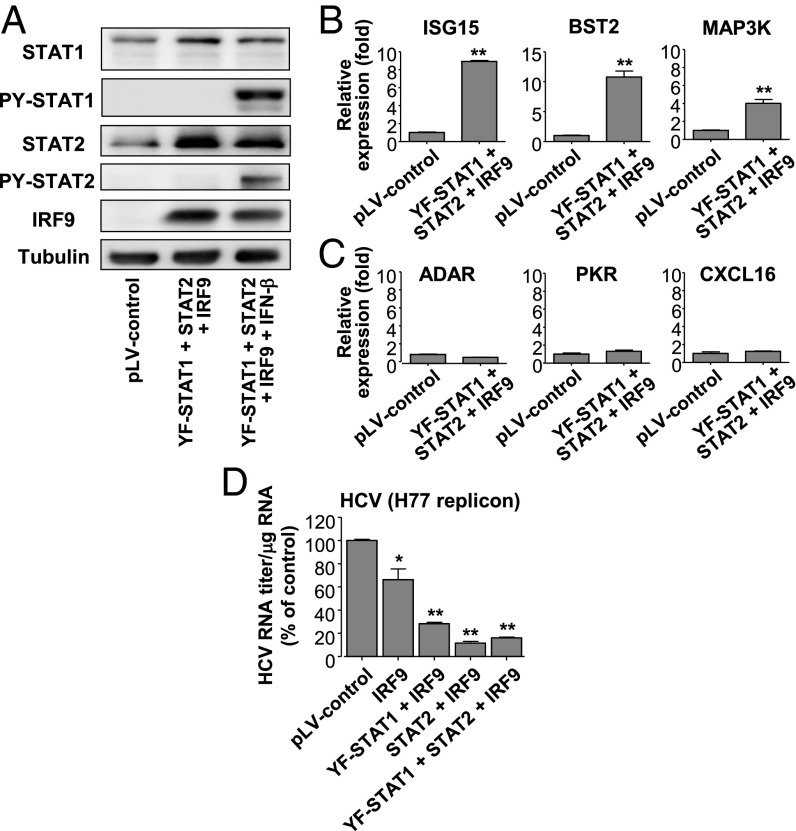
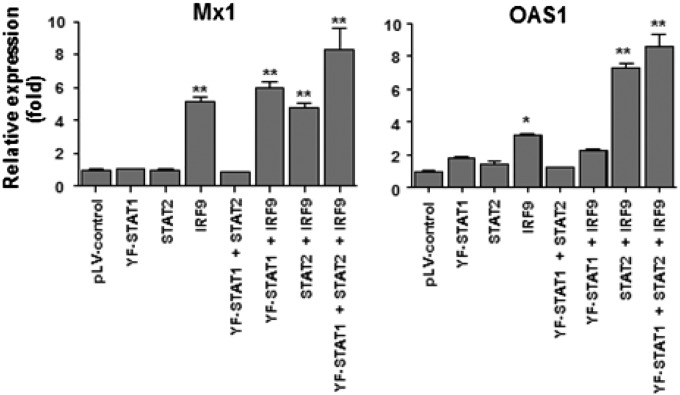
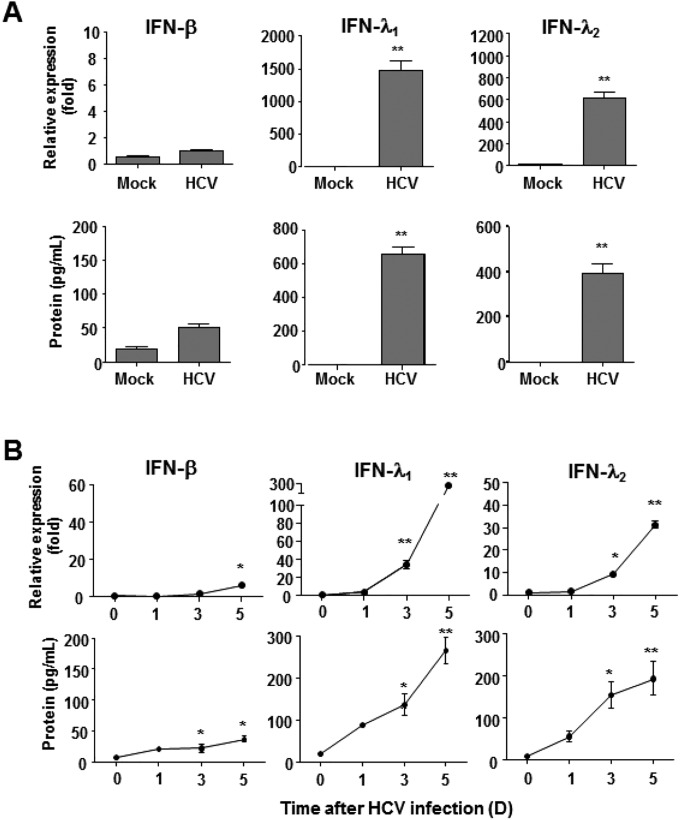
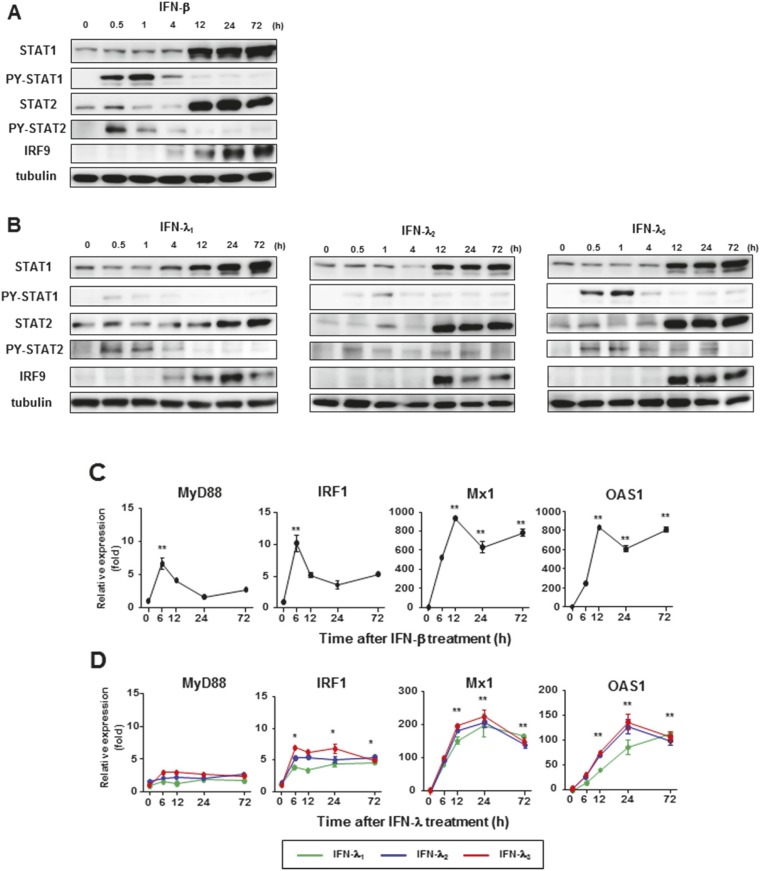
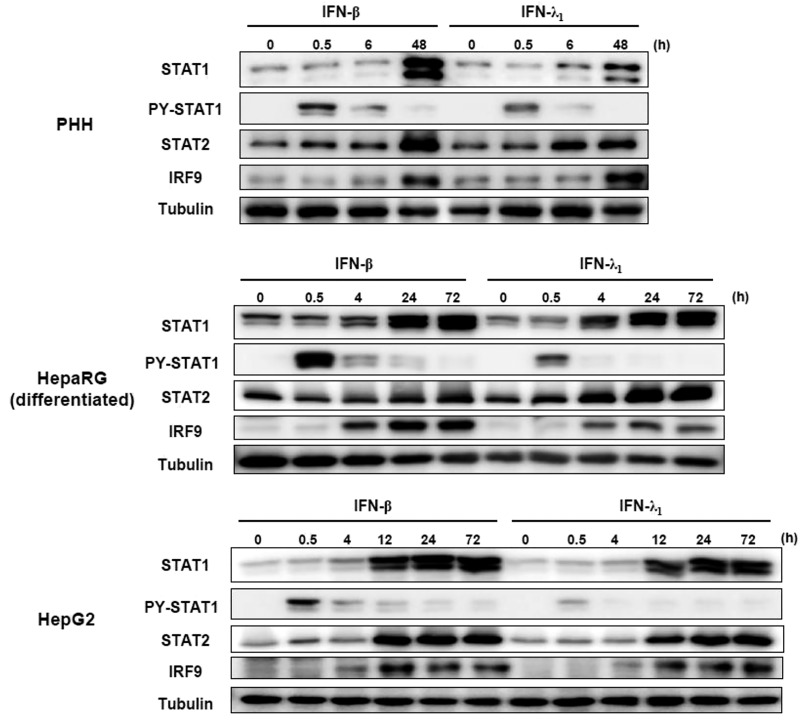
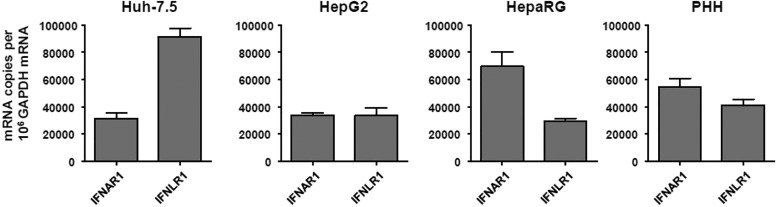
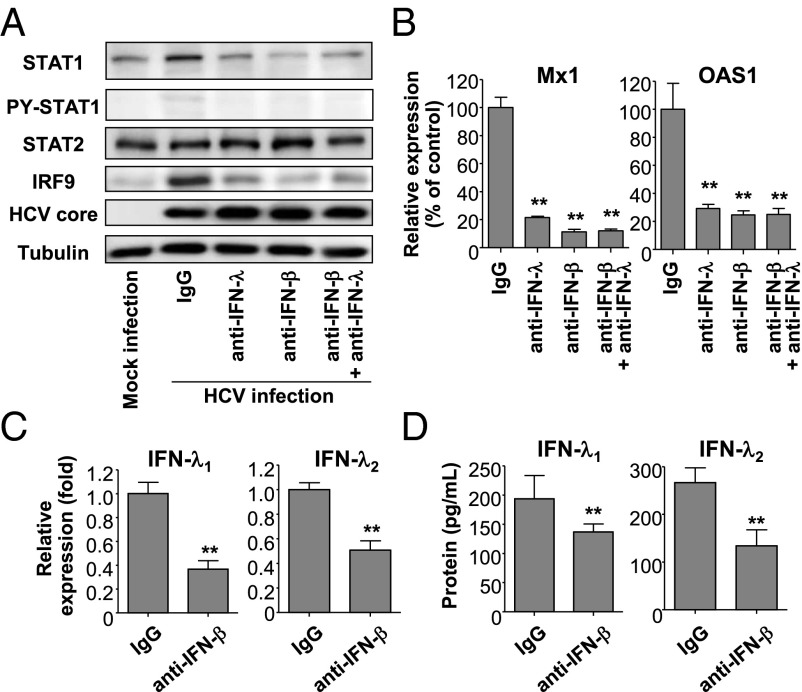
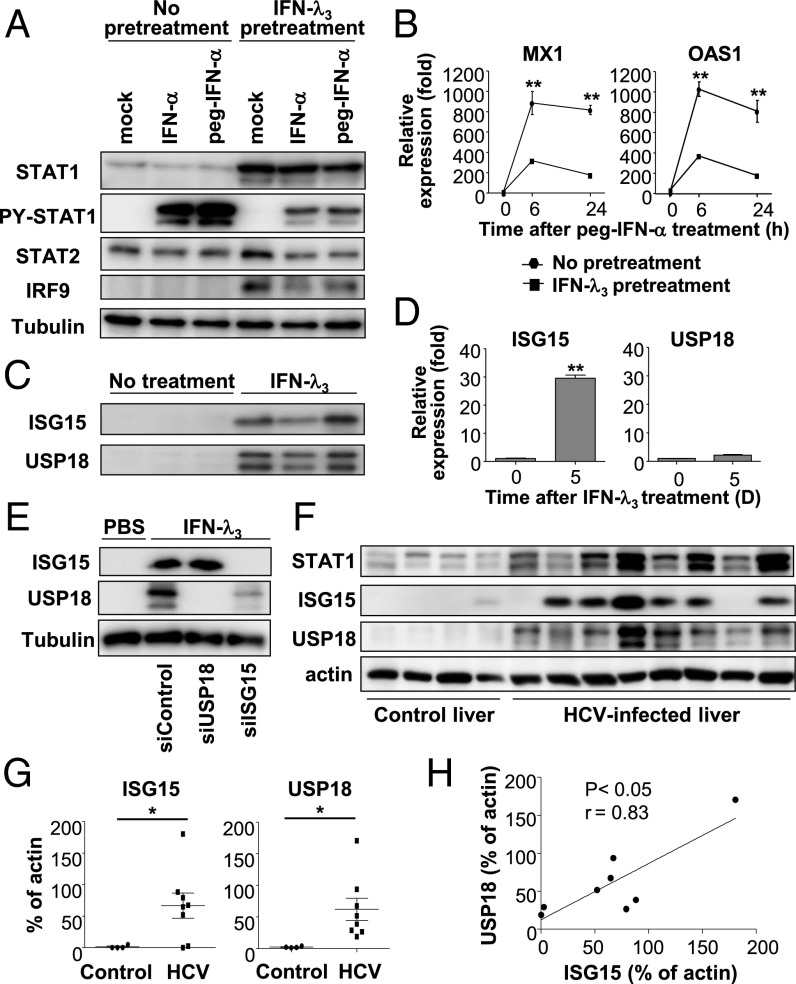
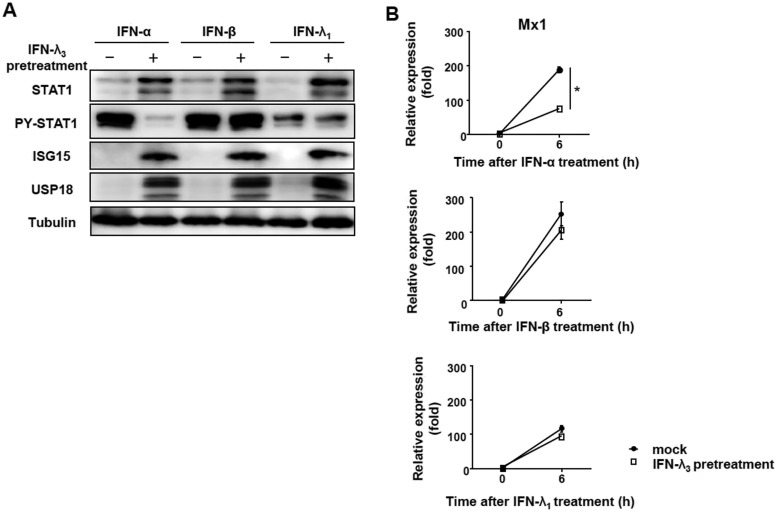
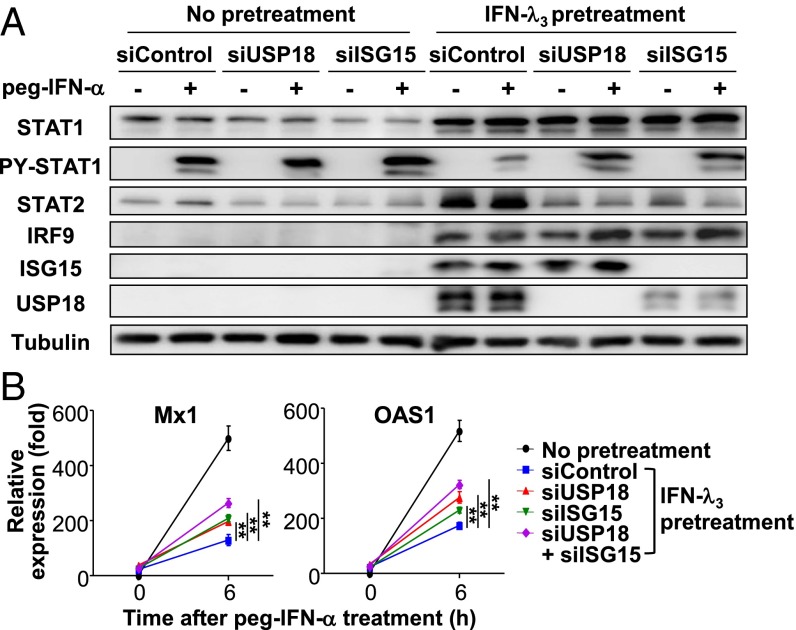
Up-regulation of IFN-stimulated genes (ISGs) is sustained in hepatitis C virus (HCV)-infected livers. Here, we investigated the mechanism of prolonged ISG expression and its role in IFN responsiveness during HCV infection in relation to unphosphorylated IFN-stimulated gene factor 3 (U-ISGF3), recently identified as a tripartite transcription factor formed by high levels of IFN response factor 9 (IRF9), STAT1, and STAT2 without tyrosine phosphorylation of the STATs. The level of U-ISGF3, but not tyrosine phosphorylated STAT1, is significantly elevated in response to IFN-λ and IFN-β during chronic HCV infection. U-ISGF3 prolongs the expression of a subset of ISGs and restricts HCV chronic replication. However, paradoxically, high levels of U-ISGF3 also confer unresponsiveness to IFN-α therapy. As a mechanism of U-ISGF3-induced resistance to IFN-α, we found that ISG15, a U-ISGF3-induced protein, sustains the abundance of ubiquitin-specific protease 18 (USP18), a negative regulator of IFN signaling. Our data demonstrate that U-ISGF3 induced by IFN-λs and -β drives prolonged expression of a set of ISGs, leading to chronic activation of innate responses and conferring a lack of response to IFN-α in HCV-infected liver.

Keywords: U-ISGF3; hepatitis C virus; interferon; interferon-stimulated genes.


Conflict of interest statement

The authors declare no conflict of interest.

Figures

Fig. 1.
Fig. 1.
Expression of U-ISGF3 components and U-ISGs in livers of patients with chronic HCV infection. (A and B) Immunoblotting of STAT1, PY-STAT1, STAT2, and IRF9 was performed with control livers without viral hepatitis (n = 4) and HCV-infected livers (n = 8) (A) or HBV-infected livers (n = 8) (B). As a positive control for PY-STAT1, Huh-7–TLR3 cells were treated with IFN-β for 30 min. The Upper blot of PY-STAT1 was obtained after exposure for the same time as the blot of STAT1, and the Lower blot of PY-STAT1 was obtained after much longer exposure to detect the minimal amount of PY-STAT1. (C and D) The expression of U-ISGs (C) and ISGs known to be regulated only by ISGF3 (D) was examined by TaqMan real-time quantitative PCR in control livers without viral hepatitis (n = 5) and HCV-infected livers (n = 8). The data represent the means ± SD, *P < 0.05 compared with control.
Fig. 2.
Fig. 2.
Expression of U-ISGF3 components and U-ISGs in HCV-infected PHHs and Huh-7–TLR3 cells. (AC) PHHs were infected with JFH1 HCVcc [multiplicity of infection (MOI) = 2] and harvested 5 d later. Immunoblotting of STAT1, PY-STAT1, STAT2, IRF9, and HCV core was performed (A). As a positive control of PY-STAT1, HCV-infected cells were treated with IFN-β for 30 min. The expression of U-ISGs (B) and ISGs known to be regulated only by phosphorylated ISGF3 (C) was examined by TaqMan real-time quantitative PCR. (D) Huh-7–TLR3 cells were infected with JFH1 HCVcc (MOI = 10) and harvested at the indicated time. Immunoblotting of STAT1, PY-STAT1, STAT2, IRF9, and HCV core was performed. As a positive control of PY-STAT1, HCV-infected Huh-7–TLR3 cells were treated with IFN-β for 30 min. (E) Huh-7–TLR3 cells were infected with JFH1 HCVcc (MOI = 10) and harvested 5 d later. The expression of U-ISGs (Left) and ISGs known to be regulated only by ISGF3 (Right) were examined by TaqMan real-time quantitative PCR. Data are presented as a ratio of the mRNA level in HCV-infected cells to the mRNA level in uninfected cells. Bar graphs represent the means ± SEM (n = 3). *P < 0.05, **P < 0.01 compared with control.
Fig. S1.
Fig. S1.
Up-regulation of ISGs in HCV-infected Huh-7–TLR3 cells by exogenous IFN-β treatment. HCV-infected Huh-7–TLR3 cells were treated with IFN-β for 6 h, and real-time qPCR was performed to quantify Mx1, OAS-1, MyD88, and IRF1 mRNA levels. Bar graphs represent the means ± SEM (n = 3). **P < 0.01, ***P < 0.001 compared with control.
Fig. 3.
Fig. 3.
Role of U-ISGF3 components in the induction of U-ISGs in HCV-infected Huh-7–TLR3 cells. (A) Huh-7–TLR3 cells were infected with JFH1 HCVcc (MOI = 10) and harvested 5 d later. The cell lysates were fractionated into nuclei and cytoplasm, and immunoblotting of STAT1, PY-STAT1, STAT2, IRF9, and HCV core was performed. As a positive control for PY-STAT1, HCV-infected Huh-7–TLR3 cells were treated with IFN-β for 30 min. (B) Immunohistochemical staining of STAT1 and PY-STAT1 was performed in control and HCV-infected livers. (C) Huh-7–TLR3 cells were infected with JFH1 HCVcc (MOI = 10) and harvested 5 d later. Next, ChIP assays were performed to examine the binding of STAT1, STAT2, and IRF9 to the promoter regions of the ISGs such as MyD88, IRF1, Mx1, and IFI27. The reactions were performed in triplicate, and the means were normalized to 1% of the chromatin input. (D) HCV-infected livers were used for ChIP assays to examine the binding of PY-STAT1 and IRF9 to the promoter regions of the MyD88 and Mx1. Bar graphs represent the means ± SEM (n = 3). *P < 0.05 compared with control.
Fig. S2.
Fig. S2.
Binding of PY-STAT1 to the promoter of MyD88 and Mx1 4 h after IFN-β stimulation. HCV-infected Huh-7–TLR3 cells were treated with IFN-β for 4 h, and a ChIP assay was performed using anti-PY-STAT1 antibody. Bar graphs represent the means ± SEM (n = 3). *P < 0.05 compared with control.
Fig. 4.
Fig. 4.
Induction of U-ISGs by increased expression of U-STAT1, STAT2, and IRF9 without IFN stimulation. (AC) Huh-7.5 cells were transduced with lentiviruses carrying pLV control vector or expression vectors for Y701F-STAT1, STAT2, or IRF9. Then, immunoblotting of STAT1, STAT2, and IRF9 was performed (A). As a positive control for PY-STAT1 in the immunoblotting analysis, the transduced cells were treated with IFN-β for 30 min. The expression of a set of U-ISGs (B) and a set of ISGF3-downstream genes (C) was examined by TaqMan real-time quantitative PCR. (D) Full-length H77 (HCV genotype 1a) replicon-harboring Huh-7.5 cells were transduced with lentiviruses carrying pLV control vector or expression vector for IRF9, Y701F-STAT1, or STAT2. Intracellular HCV RNA titer was quantified by TaqMan real-time PCR. Bar graphs represent the means ± SEM (n = 3). *P < 0.05, **P < 0.01 compared with control.
Fig. S3.
Fig. S3.
Induction of Mx1 and OAS1 by increased expression of U-STAT1, STAT2, and IRF9 without IFN stimulation. Huh-7.5 cells were transduced with lentiviruses carrying pLV control vector or expression vectors for Y701F-STAT1, STAT2, or IRF9. The expression of Mx1 and OAS1 was examined by TaqMan real-time quantitative PCR. Bar graphs represent the means ± SEM (n = 3). *P < 0.05, **P < 0.01 compared with control.
Fig. S4.
Fig. S4.
Induction of endogenous IFN-λs and IFN-β in HCV-infected primary human hepatocytes and Huh-7–TLR3 cells. (A) Primary human hepatocytes were infected with JFH1 HCVcc (MOI = 2) and harvested 5 d later. The expression of IFN-β, IFN-λ1, and IFN-λ2 was examined at the mRNA level by TaqMan real-time quantitative PCR and at the protein level by ELISA. (B) Huh-7–TLR3 cells were infected with JFH1 HCVcc (MOI = 10). The infected cells were harvested at the indicated time points, and the expression of IFN-β, IFN-λ1, and IFN-λ2 was examined at the mRNA level by TaqMan real-time quantitative PCR and at the protein level by ELISA. The data represent the means ± SEM (n = 3). *P < 0.05, **P < 0.01 compared with control.
Fig. S5.
Fig. S5.
Induction of U-ISGF3 and U-ISGs after treatment of IFN-β and IFN-λs in Huh-7.5 cells. (AD) Huh-7.5 cells were treated with 3 ng/mL IFN-β (A and C) or 100 ng/mL the indicated IFN-λ (B and D) and harvested at the indicated time points. Immunoblotting of STAT1, PY-STAT1, STAT2, PY-STAT2, and IRF9 was performed (A and B), and the expression of ISGs was examined by TaqMan real-time quantitative PCR (C and D). The data represent the means ± SEM (n = 3). *P < 0.05, **P < 0.01 compared with control.
Fig. S6.
Fig. S6.
Induction of U-ISGF3 after treatment of IFN-β and IFN-λ1 in PHHs, differentiated HepaRG cells, and HepG2 cells. PHHs, differentiated HepaRG cells, and HepG2 cells were treated with 1 ng/mL IFN-β or 100 ng/mL IFN-λ1 and harvested at the indicated time points. Immunoblotting of STAT1, PY-STAT1, STAT2, PY-STAT2, and IRF9 was performed.
Fig. S7.
Fig. S7.
IFNAR1 and IFNLR1 mRNA expression in various liver-derived cells. Real-time qPCR was performed to measure the level of IFNAR1 and IFNLR1 mRNA. Bar graphs represent the means ± SEM (n = 3).
Fig. 5.
Fig. 5.
Role of endogenous IFN-λs and IFN-β in the induction of U-ISGF3 components and U-ISGs in HCV-infected Huh-7–TLR3 cells. (AD) Huh-7–TLR3 cells were infected with JFH1 HCVcc (MOI = 5) and cultured for 2 d. Next, 2,000 IU/mL of IFN-β–blocking antibody, 20 μg/mL IFN-λ–blocking antibody, or control IgG was added to the culture, and the cells were further maintained for 3 d and harvested. Immunoblotting of STAT1, PY-STAT1, STAT2, IRF9, and HCV core was performed (A), and the expression of Mx1 and OAS1 was examined by TaqMan real-time quantitative PCR (B). The expression of IFN-λ1 and IFN-λ2 was examined at the mRNA level using TaqMan real-time quantitative PCR (C) and at the protein level by ELISA (D). The data represent the means ± SEM (n = 3). **P < 0.01 compared with control.
Fig. 6.
Fig. 6.
Increased levels of ISG15 and USP18 in cells after prolonged stimulation with IFN-λ3 or in HCV-infected livers. (A and B) Huh-7.5 cells were treated with 10 ng/mL IFN-λ3 for 5 d and rested for 16 h. Then, 100 IU of IFN-α or peg–IFN-α2b was added. After 30 min, immunoblotting was performed for the detection of STAT1, PY-STAT1, STAT2, and IRF9 (A). After peg–IFN-α2b treatment for 6 or 24 h, the expression of ISGs was examined by TaqMan real-time quantitative PCR (B). (C and D) Huh-7.5 cells were treated with 10 ng/mL IFN-λ3 for 5 d and rested for 16 h. Immunoblotting of ISG15 and USP18 was performed (C), and the mRNA levels of ISG15 and USP18 were examined by TaqMan real-time quantitative PCR (D). (E) Huh-7.5 cells were treated with 10 ng/mL IFN-λ3. After 5 d, siRNAs targeting USP18 or ISG15 were introduced by transfection. Forty-eight hours after transfection, cells were harvested, and immunoblotting of ISG15 and USP18 was performed. (FH) Immunoblotting of ISG15 and USP18 was performed in control livers without viral hepatitis (n = 4) and HCV-infected livers (n = 8). Bands for STAT1, ISG15 and USP18 are presented (F). The relative band intensities (% of actin) are presented as scatter plots (G). Correlation between the band intensities of ISG15 and those of USP18 is presented (H). The data represent the means ± SEM (n = 3). *P < 0.05, **P < 0.01 compared with control.
Fig. S8.
Fig. S8.
Differential responses to exogenous IFN-α, IFN-β, and IFN-λ1 in IFN-λ3–pretreated cells. Huh-7.5 cells were pretreated with IFN-λ3 for 5 d, and treated with IFN-α, IFN-β, and IFN-λ1. Immunoblotting was performed 30 min after IFN stimulation to evaluate the phosphorylation of STAT1 (A), and real-time qPCR was performed 6 h after IFN stimulation to measure the level of Mx1 mRNA (B). Bar graphs represent the means ± SEM (n = 3). *P < 0.5.
Fig. 7.
Fig. 7.
Enhanced response to peg–IFN-α after silencing of USP18 and/or ISG15 expression in cells after prolonged stimulation with IFN-λ3. (A and B) Huh-7.5 cells were treated with 10 ng/mL IFN-λ3 for 5 d, and the indicated siRNAs were introduced by transfection. Forty eight hours after transfection, the cells were treated with 100 IU of peg–IFN-α2b for 30 min, and immunoblotting of STAT1, PY-STAT1, STAT2, IRF9, USP18, and ISG15 was performed (A). Twenty-four hours after transfection, cells were treated with 50 IU of peg–IFN-α2b for 6 h, and TaqMan real-time quantitative PCR for Mx1 and OAS1 was performed (B). The data represent the means ± SEM (n = 3). **P < 0.01 compared with control.
Fig. S9.
Fig. S9.
Defects in inducing ISGs in U3A cells. U3A cells were transfected with WT STAT1, and treated with 50 IU/mL IFN-β for 4 h. Many representative ISGs, including IFIT3, Mx1, and Casp1, were not induced. These genes were significantly induced in IFN-β–treated primary STAT1-null fibroblasts (8) transfected with WT STAT1. UT, untreated cells. The data represent the means ± SEM (n = 3).

References

    1. Jeong SW, Jang JY, Chung RT. Hepatitis C virus and hepatocarcinogenesis. Clin Mol Hepatol. 2012;18(4):347–356. - PMC - PubMed
    1. Horner SM, Gale M., Jr Regulation of hepatic innate immunity by hepatitis C virus. Nat Med. 2013;19(7):879–888. - PMC - PubMed
    1. Marukian S, et al. Hepatitis C virus induces interferon-λ and interferon-stimulated genes in primary liver cultures. Hepatology. 2011;54(6):1913–1923. - PMC - PubMed
    1. Park H, et al. IL-29 is the dominant type III interferon produced by hepatocytes during acute hepatitis C virus infection. Hepatology. 2012;56(6):2060–2070. - PMC - PubMed
    1. Thomas E, et al. HCV infection induces a unique hepatic innate immune response associated with robust production of type III interferons. Gastroenterology. 2012;142(4):978–988. - PMC - PubMed

Publication types

MeSH terms