. 2015 Aug 11;112(32):E4410-7.
doi: 10.1073/pnas.1501605112. Epub 2015 Jul 27.

Metabolite profiling stratifies pancreatic ductal adenocarcinomas into subtypes with distinct sensitivities to metabolic inhibitors

Affiliations

Metabolite profiling stratifies pancreatic ductal adenocarcinomas into subtypes with distinct sensitivities to metabolic inhibitors

Anneleen Daemen et al. Proc Natl Acad Sci U S A. .

Abstract

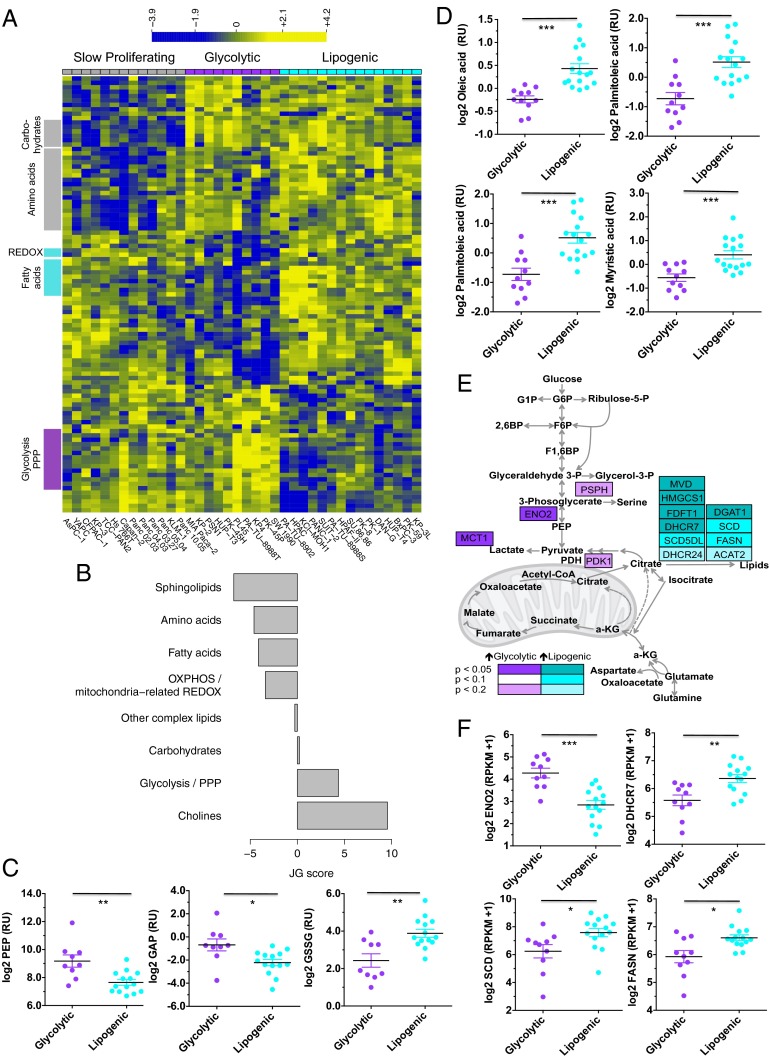
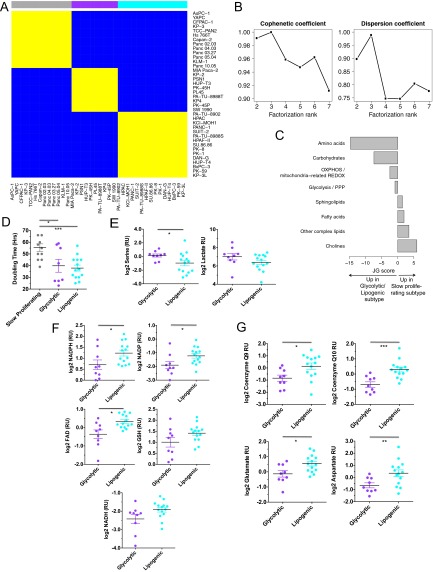
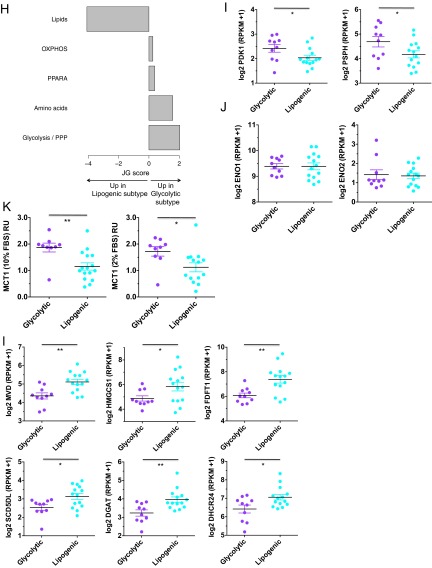
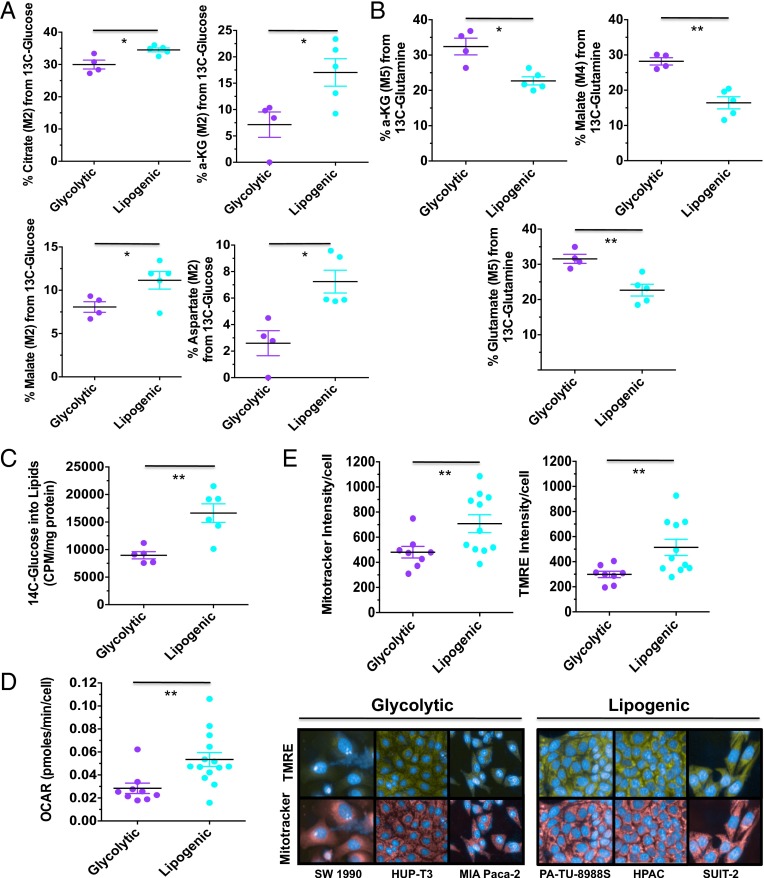
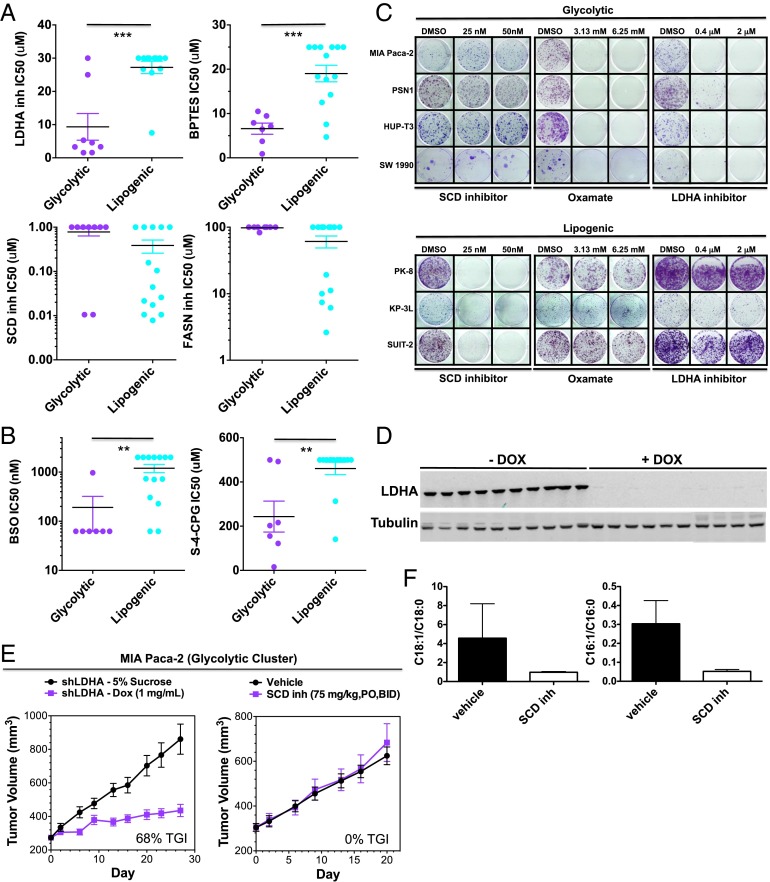
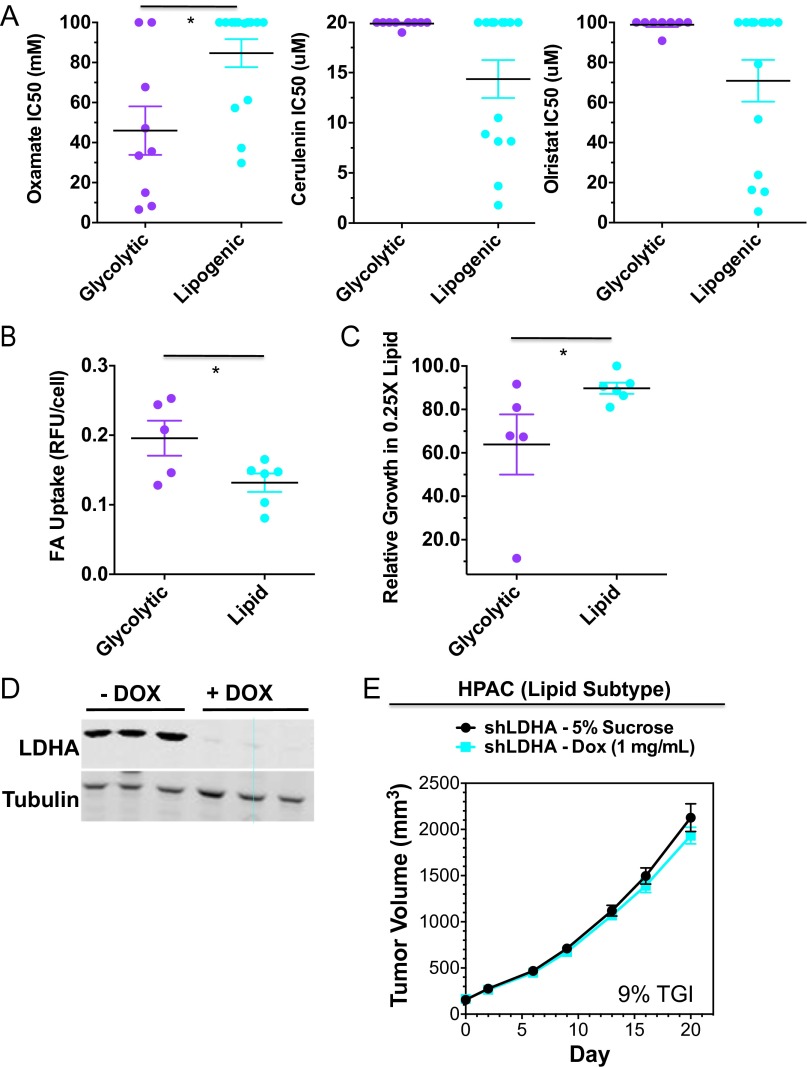
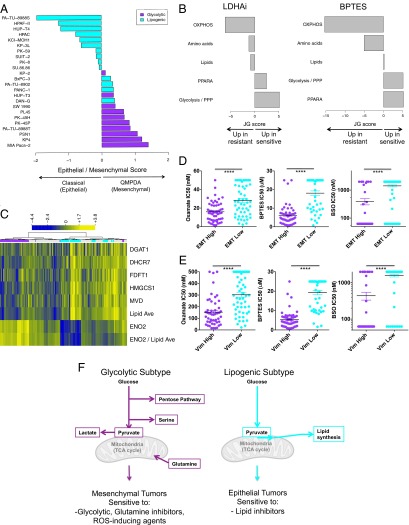
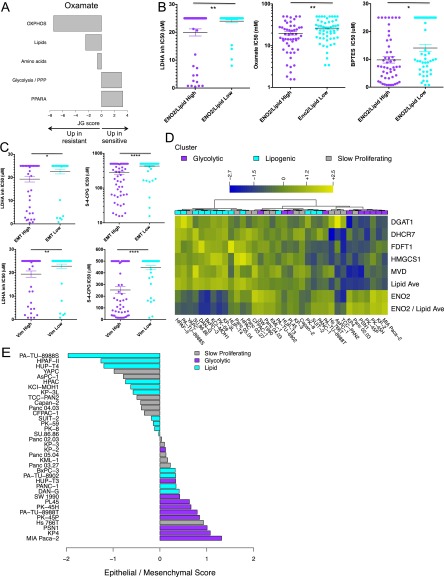
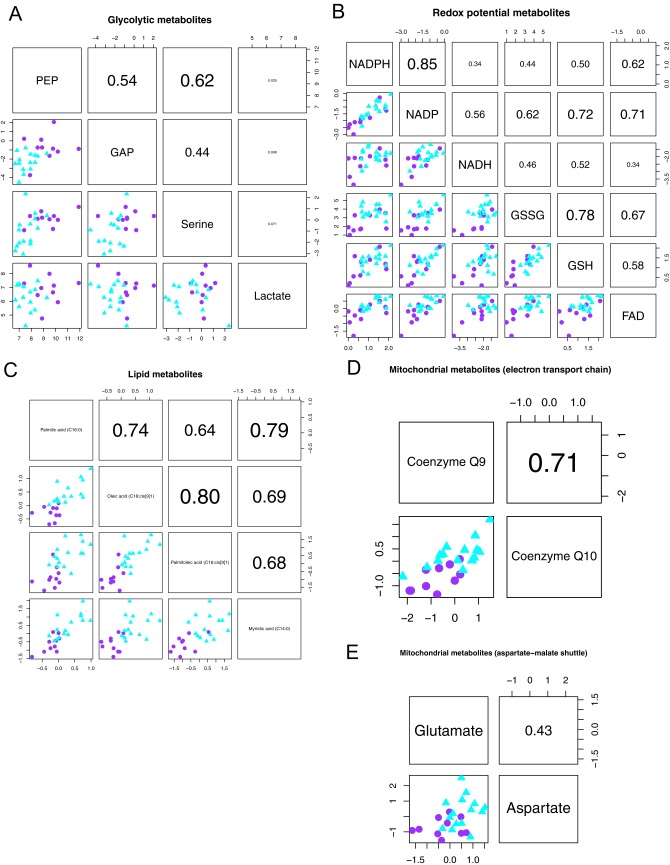
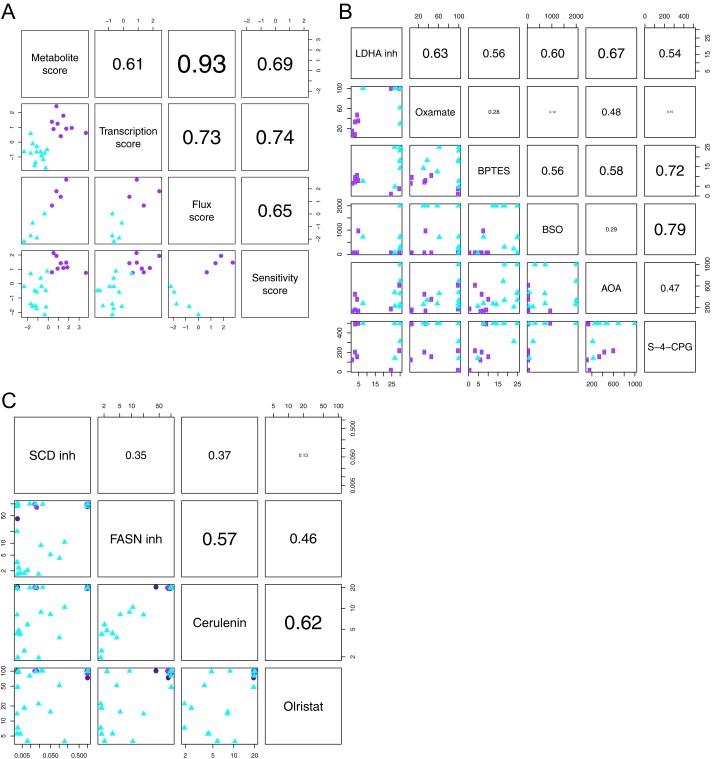
Although targeting cancer metabolism is a promising therapeutic strategy, clinical success will depend on an accurate diagnostic identification of tumor subtypes with specific metabolic requirements. Through broad metabolite profiling, we successfully identified three highly distinct metabolic subtypes in pancreatic ductal adenocarcinoma (PDAC). One subtype was defined by reduced proliferative capacity, whereas the other two subtypes (glycolytic and lipogenic) showed distinct metabolite levels associated with glycolysis, lipogenesis, and redox pathways, confirmed at the transcriptional level. The glycolytic and lipogenic subtypes showed striking differences in glucose and glutamine utilization, as well as mitochondrial function, and corresponded to differences in cell sensitivity to inhibitors of glycolysis, glutamine metabolism, lipid synthesis, and redox balance. In PDAC clinical samples, the lipogenic subtype associated with the epithelial (classical) subtype, whereas the glycolytic subtype strongly associated with the mesenchymal (QM-PDA) subtype, suggesting functional relevance in disease progression. Pharmacogenomic screening of an additional ∼ 200 non-PDAC cell lines validated the association between mesenchymal status and metabolic drug response in other tumor indications. Our findings highlight the utility of broad metabolite profiling to predict sensitivity of tumors to a variety of metabolic inhibitors.

Keywords: biomarkers for metabolic inhibitors; glycolysis; lipid synthesis; metabolic subtypes in PDAC; metabolite profiling.


Conflict of interest statement

The authors declare no conflict of interest.

Figures

Fig. 1.
Fig. 1.
Identification of distinct metabolic subtypes in PDAC through baseline metabolite profiling. (A) Hierarchical clustering of identifiable metabolites with significant intensity differences between any of the three subtypes (F test, P < 0.05; 99 metabolites). Cell lines were grouped by subtype, with the order per subtype defined by unsupervised clustering. Log2 intensity ratio data per metabolite are scaled across all cell lines to mean = 0 and SD = 1. Blue indicates low scaled intensity, and yellow indicates high for each metabolite. Highlighted in gray are functionally related metabolites. Slow proliferating lines are labeled in gray, glycolytic lines in purple, and lipogenic in cyan. (B) Relative enrichment of the eight metabolic ontology classes in the glycolytic and lipogenic subtypes, represented by JG score (47). Positive scores represent ontologies enriched for metabolites with high intensities in the glycolytic subtype. See Dataset S1 for a description and list of metabolites per ontology and Dataset S4 for the list of differentially expressed metabolites. (C) Normalized metabolite intensity levels for metabolites involved in glycolysis/pentose phosphate and redox pathways that were differentially expressed between glycolytic and lipogenic lines. RU stands for relative unit, with intensity levels normalized to a reference pool of samples for metabolites from the Broad Profiling platform (Dataset S2) and to a universal 13C-labeled internal standard for metabolites from the Energy platform (Dataset S3). (D) Normalized metabolite intensity levels for metabolites involved in lipid synthesis that were differentially expressed between glycolytic and lipogenic lines. (E) Detailed metabolite map with genes differentially expressed between cell lines from the glycolytic vs. lipogenic subtype indicated with various shades of color depending on P value corrected for multiple testing. For MCT1, P value is based on protein expression level. We refer to Dataset S6 for a list of differentially expressed genes. (F) Expression levels of ENO2, DHCR7, SCD, and FASN involved in glycolysis and lipid synthesis that were differentially expressed between glycolytic and lipogenic lines (Dataset S6). Asterisks denote a statistically significant difference by unpaired t test with Welch’s correction (*P < 0.05, **P < 0.01, ***P < 0.001).
Fig. S1.
Fig. S1.
Related to Fig. 1. (A) Cell line-by-cell line consensus heatmap shows the clustering consensus obtained with nonnegative matrix factorization (NMF) based on 200 runs (21); yellow color indicates similar metabolic profiles and blue indicates dissimilar. The three identified subtypes are colored on top: slow proliferating subtype in gray, glycolytic subtype in purple, lipogenic subtype in cyan. (B) Cophenetic coefficient (measure of subtype stability) and dispersion coefficient (measure of subtype robustness) in function of the number of subtypes ranging from 2 to 7. The cophenetic coefficient equals 1 for a perfect consensus matrix with entries 0 and 1 and decreases when entries become scattered between 0 and 1. (C) Relative enrichment of the eight metabolic ontology classes in the slow proliferating subtype vs. the glycolytic/lipogenic subtypes, represented by JG score (47). Positive scores represent ontologies enriched for metabolites with high intensities in the slow proliferating subtype. Negative scores represent ontologies characteristic of the glycolytic/lipogenic subtypes. See Dataset S1 for a list of metabolites per ontology and Dataset S4 for the list of differentially expressed metabolites. (D) Doubling time for all cell lines grouped by subtype, with a lower proliferation rate for cell lines in the slow proliferating subtype. Proliferation was measured using CyQUANT Cell Proliferation Assays. Data from Dataset S7. (E) Normalized metabolite intensity level for lactate involved in glycolysis. RU stands for relative unit, similar to Fig. 1C. (F) Normalized metabolite intensity levels for metabolites involved in redox pathways that were differentially expressed between glycolytic and lipogenic lines. RU stands for relative unit, similar to Fig. 1C. (G) Normalized metabolite intensity levels for metabolites involved in the electron transport chain and aspartate/malate shuttle that were differentially expressed between glycolytic and lipogenic subtype lines. RU stands for relative unit, similar to Fig. 1C. (H) Relative enrichment of the five curated metabolism gene sets in the glycolytic and lipogenic subtypes, represented by JG score. Positive scores represent gene sets enriched in the glycolytic subtype. Negative scores represent gene sets characteristic of the lipogenic subtype. The transcriptomic profile of the glycolytic subtype is enriched with genes involved in glycolysis and pentose phosphate. Cell lines from the lipogenic subtype show higher expression of lipid synthesis genes. Dataset S5 lists genes per gene set, and Dataset S6 lists differentially expressed genes. (I) Expression of several of the glycolysis genes that were differentially expressed between glycolytic and lipogenic lines (Dataset S5 and Fig. 1E). (J) Enolase homologs ENO1 and ENO3 show no differential expression between glycolytic and lipogenic lines. The expression profile for ENO2 is shown in Fig. 1F. (K) Western blots and quantification of Mct1 protein in glycolytic and lipogenic lines (quantification normalized to HSP90). (L) Expression of several of the fatty acid synthesis genes (cholesterol and lipids) that were differentially expressed between glycolytic and lipogenic lines (Dataset S5 and Fig. 1F). Asterisks denote a statistically significant difference by t test (*P < 0.05, **P < 0.01, ***P < 0.001).
Fig. S1.
Fig. S1.
Related to Fig. 1. (A) Cell line-by-cell line consensus heatmap shows the clustering consensus obtained with nonnegative matrix factorization (NMF) based on 200 runs (21); yellow color indicates similar metabolic profiles and blue indicates dissimilar. The three identified subtypes are colored on top: slow proliferating subtype in gray, glycolytic subtype in purple, lipogenic subtype in cyan. (B) Cophenetic coefficient (measure of subtype stability) and dispersion coefficient (measure of subtype robustness) in function of the number of subtypes ranging from 2 to 7. The cophenetic coefficient equals 1 for a perfect consensus matrix with entries 0 and 1 and decreases when entries become scattered between 0 and 1. (C) Relative enrichment of the eight metabolic ontology classes in the slow proliferating subtype vs. the glycolytic/lipogenic subtypes, represented by JG score (47). Positive scores represent ontologies enriched for metabolites with high intensities in the slow proliferating subtype. Negative scores represent ontologies characteristic of the glycolytic/lipogenic subtypes. See Dataset S1 for a list of metabolites per ontology and Dataset S4 for the list of differentially expressed metabolites. (D) Doubling time for all cell lines grouped by subtype, with a lower proliferation rate for cell lines in the slow proliferating subtype. Proliferation was measured using CyQUANT Cell Proliferation Assays. Data from Dataset S7. (E) Normalized metabolite intensity level for lactate involved in glycolysis. RU stands for relative unit, similar to Fig. 1C. (F) Normalized metabolite intensity levels for metabolites involved in redox pathways that were differentially expressed between glycolytic and lipogenic lines. RU stands for relative unit, similar to Fig. 1C. (G) Normalized metabolite intensity levels for metabolites involved in the electron transport chain and aspartate/malate shuttle that were differentially expressed between glycolytic and lipogenic subtype lines. RU stands for relative unit, similar to Fig. 1C. (H) Relative enrichment of the five curated metabolism gene sets in the glycolytic and lipogenic subtypes, represented by JG score. Positive scores represent gene sets enriched in the glycolytic subtype. Negative scores represent gene sets characteristic of the lipogenic subtype. The transcriptomic profile of the glycolytic subtype is enriched with genes involved in glycolysis and pentose phosphate. Cell lines from the lipogenic subtype show higher expression of lipid synthesis genes. Dataset S5 lists genes per gene set, and Dataset S6 lists differentially expressed genes. (I) Expression of several of the glycolysis genes that were differentially expressed between glycolytic and lipogenic lines (Dataset S5 and Fig. 1E). (J) Enolase homologs ENO1 and ENO3 show no differential expression between glycolytic and lipogenic lines. The expression profile for ENO2 is shown in Fig. 1F. (K) Western blots and quantification of Mct1 protein in glycolytic and lipogenic lines (quantification normalized to HSP90). (L) Expression of several of the fatty acid synthesis genes (cholesterol and lipids) that were differentially expressed between glycolytic and lipogenic lines (Dataset S5 and Fig. 1F). Asterisks denote a statistically significant difference by t test (*P < 0.05, **P < 0.01, ***P < 0.001).
Fig. 2.
Fig. 2.
Functional characterization of glycolytic and lipogenic subtypes. (A) Comparison of relative contribution of glucose oxidation to the TCA metabolites, determined by M2 labeling from [U-13C6]glucose for citrate, αKG, malate, and aspartate between glycolytic and lipogenic cell lines. (B) Comparison of relative contribution of reductive glutamine metabolism to TCA metabolites, determined by M5 labeling from [U-13C5]glutamine for αKG and glutamate, and M4 labeling for malate between glycolytic and lipogenic cell lines. (C) Comparison of relative contribution of glucose metabolism to de novo lipid synthesis between glycolytic and lipogenic cell lines. Cells were labeled with 1 μCi/mL d[U-14C] glucose for 6 h, and lipids were extracted. The incorporation of 14C into lipids was determined by scintillation counting. (D) Comparison of oxygen consumption rates (OCRs) between glycolytic and lipogenic cell lines. (E) Comparison of relative mitochondria number (Mitotracker intensity per cell) and potential/fitness (TMRE per cell) between glycolytic and lipogenic cell lines. For A–E, the mean and SD between cell lines belonging to the glycolytic subtype vs. lipogenic subtype is plotted where each cell line is shown as one dot, representing the mean of three replicates. Data are normalized to sample protein content (A–C) or cell number (D and E). Asterisks denote a statistically significant difference by unpaired t test with Welch’s correction (*P < 0.05, **P < 0.01, ***P < 0.001).
Fig. 3.
Fig. 3.
Glycolytic and lipogenic cell lines show distinct sensitivity to various metabolic inhibitors both in vitro and in vivo. (A) Comparison of IC50 values to various metabolic inhibitors between representative glycolytic vs. lipogenic cell lines in short-term (3 d) viability assays. Saturated IC50 values correspond to cell lines where an IC50 was not reached at the maximum drug concentration. The mean and SD between cell lines belonging to the glycolytic vs. lipogenic subtype is plotted where each cell line is shown as one dot, representing the mean of three replicates. Asterisks denote a statistically significant difference by Mann–Whitney test (*P < 0.05, **P < 0.01, ***P < 0.001). (B) Comparison of IC50 values to various ROS-inducing agents between representative glycolytic vs. lipogenic cell lines in short-term (3 d) viability assays, similar to A. (C) Comparison of sensitivity to oxamate, LDHA, or SCD inhibitors between representative glycolytic vs. lipogenic cell lines in longer-term (12 d), low seeding density growth assays. (D) Western blots showing 98% in vivo knockdown of LDHA levels in MIA Paca-2 xenografts administered with doxycycline (1 mg/mL) for 8 d vs. 5% sucrose. (E) In vivo knockdown of LDHA (n = 10 for each group) results in 68% TGI, 95% confidence interval [48, 83] in the MIA Paca-2 shLDHA model of a glycolytic subtype tumor, whereas treatment with an SCD inhibitor (75 mg/kg, orally, BID) resulted in no significant change in tumor volume. (F) Confirmed pharmacodynamic inhibition of lipid metabolism by SCD inhibitor. The SCD inhibitor reduces desaturation of palmitate and stearate in MIA Paca-2 shLDHA xenograft tumor tissues and in mouse liver and plasma (n = 5 per group). Data are presented as mean ± SD.
Fig. S2.
Fig. S2.
Related to Fig. 3. (A) Comparison of IC50 values of lipid synthesis inhibitors cerulenin and orlistat between representative glycolytic and lipogenic cell lines in short-term (3 d) viability assays. The mean and SD between cell lines belonging to the glycolytic vs. lipogenic subtype is plotted where each cell line is shown as one dot, representing the mean of three replicates. Asterisks denote a statistically significant difference by Mann–Whitney test (*P < 0.05, **P < 0.01, ***P < 0.001). Data from Dataset S7. (B) Comparison in baseline fatty acid (FA) uptake between representative glycolytic and lipogenic cell lines. Asterisks denote a statistically significant difference by t test (*P < 0.05, **P < 0.01, ***P < 0.001). (C) Comparison in percent growth in 3.75% delipidated serum:1.25% FBS (relative to 5% FBS) between representative glycolytic and lipogenic cell lines. Asterisks denote a statistically significant difference by Mann–Whitney test (*P < 0.05, **P < 0.01, ***P < 0.001). (D) Western blots showing 98% in vivo knockdown of LDHA levels in HPAC xenografts administered with doxycycline (1 mg/mL) for 8 d vs. 5% sucrose. (E) In vivo knockdown of LDHA results in 9% TGI in the HPAC shLDHA model of a lipogenic subtype tumor.
Fig. 4.
Fig. 4.
Metabolic and mesenchymal markers predict response to glycolytic and glutaminolytic inhibitors in PDAC and other tumor types. (A) Epithelial/mesenchymal score for the glycolytic and lipogenic cell lines based on a 42-gene set characteristic of the classical and QM-PDA subtypes (22). The score is defined as the difference in average expression of QM-PDA vs. classical genes, with a positive score indicative of QM-PDA and a negative score of classical. Cell lines are colored by metabolic subtype, with glycolytic lines in purple and lipogenic lines in cyan. All glycolytic cell lines are of the QM-PDA subtype, whereas lipogenic cell lines are associated with the classical subtype (Fisher’s exact test, P = 0.0006). (B) Relative enrichment of the five curated metabolism gene sets in cell lines that are sensitive (positive JG score) or resistant (negative JG score) to LDHA inhibitor or BPTES in a pan-cancer panel of 204 and 167 nonpancreatic cell lines, respectively, after exclusion of cell lines with intermediate response. See Dataset S5 for a list of genes per gene set. (C) Metabolic dependency preference in the panel of ∼200 nonpancreatic cell lines is based on the ratio of ENO2 expression to the average expression of five lipid genes, and labeled on top of the heatmap as glycolytic in purple (ratio > third quartile), lipogenic in cyan (ratio < lower quartile), and undefined type in gray (ratio between lower and third quartile). Shown are expression (log2 RPKM + 1) of glycolytic gene ENO2, five lipid genes DGAT1, DHCR7, FDFT1, HMGCS1, and MVD, average expression of the five lipid genes (Lipid Ave), and the ratio of ENO2 to average lipid expression (ENO2/Lipid Ave). Data from Dataset S8. (D) High expression of a pan-cancer EMT signature (EMT) associates with sensitivity to oxamate, BPTES, and BSO across a variety of tumor types. EMT low is defined by RPKM values < lower quartile, EMT high = RPKM values > third quartile. Asterisks denote a statistically significant difference by Mann–Whitney test (*P < 0.05, **P < 0.01, ***P < 0.001, ****P < 0.0001). (E) High expression of mesenchymal marker vimentin (Vim) associates with sensitivity to oxamate, BPTES, and BSO across a variety of tumor types. Vim low is defined by RPKM values < lower quartile, Vim high = RPKM values > third quartile. Asterisks as per D. (F) Model of preferential glucose and glutamine utilization in the glycolytic vs. lipogenic subtype.
Fig. S3.
Fig. S3.
Related to Fig. 4. (A) Relative enrichment of the five curated metabolism gene sets in cell lines that are sensitive (positive JG score) or resistant (negative JG score) to oxamate in a pan-cancer panel of 133 nonpancreatic cell lines after exclusion of cell lines with intermediate response. See Dataset S5 for a list of genes per gene set. (B) Ratio of ENO2 expression to average lipid gene expression associates with sensitivity to LDHA inhibitor, oxamate, and BPTES across a variety of tumor types. Saturated values correspond to cell lines where an IC50 was not reached at the maximum drug concentration. Low is defined by RPKM values < lower quartile; high = RPKM values > third quartile. (C) High expression of a pan-cancer EMT signature (EMT) and mesenchymal marker vimentin (Vim) associates with sensitivity to LDHA inhibitor and (S)-4-CPG across a variety of tumor types. EMT and Vim low are defined by RPKM values < lower quartile, EMT and Vim high = RPKM values > third quartile. Asterisks denote a statistically significant difference by Mann–Whitney test (*P < 0.05, **P < 0.01, ***P < 0.001, ****P < 0.0001). (D) Metabolic dependency preference in the panel of 36 PDAC cell lines is based on the ratio of ENO2 expression to the average expression of five lipid genes. Shown are expression (log2 RPKM + 1) of glycolytic gene ENO2, five lipid genes DGAT1, DHCR7, FDFT1, HMGCS1, and MVD, average expression of the five lipid genes (Lipid Ave), and the ratio of ENO2 to average lipid expression (ENO2/Lipid Ave), as per Fig. 4C. Slow proliferating lines are labeled in gray, glycolytic lines in purple, and lipogenic in cyan. Six Slow proliferating lines favor the glycolytic phenotype, and six favor the lipogenic phenotype. (E) Epithelial/mesenchymal score for all PDAC lines based on a 42-gene set characteristic of the classical and QM-PDA subtypes (22). The score is defined as the difference in average expression of QM-PDA vs. classical genes, with a positive score indicative of QM-PDA and a negative score of classical. Cell lines are colored by metabolic subtype, with slow proliferating lines in gray, glycolytic lines in purple, and lipogenic lines in cyan. Six slow proliferating lines are strongly epithelial (of which four are more lipogenic based on expression profiling in D), and six are more mesenchymal (of which four are more glycolytic based on expression profiling).
Fig. S4.
Fig. S4.
Related to SI Text. Overlap in metabolite intensities between the glycolytic and lipogenic subtypes is not indicative of a phenotype that partially reflects the glycolytic and lipogenic subtypes. Association plots are shown per set of metabolites: A, glycolytic metabolites; B, redox potential metabolites; C, lipid metabolites; D, mitochondrial metabolites important for the electron transport chain; E, mitochondrial metabolites from the aspartate-malate shuttle. Shown below the diagonal are scatter plots for each pairwise comparison of metabolites, with relative intensity levels on the x and y axes. Each dot represents a cell line, with glycolytic lines in purple (circle) and lipogenic lines in cyan (triangle). Above the diagonal are the respective Spearman correlation coefficients.
Fig. S5.
Fig. S5.
Related to SI Text. (A) The metabolomics data, transcription profiles, flux experiments, and drug sensitivity confirm robust differences between glycolytic and lipogenic subtype cell lines. PDAC-derived lines were ranked by metabolic dependency for each data type separately, defined as the difference in profile between the glycolytic and lipogenic subtype cell lines, and labeled as metabolite score, transcription score, flux score, and sensitivity score. Shown below the diagonal are scatter plots for each pairwise comparison of scores. (B) Concordance in drug sensitivity to inhibitors of aerobic glycolysis, glutaminolysis, and ROS. Shown below the diagonal are scatter plots for each pairwise comparison of compounds, with IC50 values on the x and y axes. Data are from Dataset S7. (C) Concordance in sensitivity to lipid synthesis inhibitors. Shown below the diagonal are scatter plots for each pairwise comparison of compounds, with IC50 values on log10 scale on the x and y axes. Data are from Dataset S7. For A–C, each dot represents a cell line, with glycolytic lines in purple (circle) and lipogenic lines in cyan (triangle). Above the diagonal are the respective Spearman correlation coefficients.

References

    1. Warburg O, Posener K, Negelein E. On the metabolism of carcinoma cells. Biochem Z. 1924;152:309–344.
    1. Dang L, et al. Cancer-associated IDH1 mutations produce 2-hydroxyglutarate. Nature. 2009;462(7274):739–744. - PMC - PubMed
    1. Deberardinis RJ, Sayed N, Ditsworth D, Thompson CB. Brick by brick: Metabolism and tumor cell growth. Curr Opin Genet Dev. 2008;18(1):54–61. - PMC - PubMed
    1. Hsu PP, Sabatini DM. Cancer cell metabolism: Warburg and beyond. Cell. 2008;134(5):703–707. - PubMed
    1. Anastasiou D, et al. Pyruvate kinase M2 activators promote tetramer formation and suppress tumorigenesis. Nat Chem Biol. 2012;8(10):839–847. - PMC - PubMed

MeSH terms