. 2015 Sep 1;112(35):11054-9.
doi: 10.1073/pnas.1504076112. Epub 2015 Jul 27.

Socially mediated induction and suppression of antibiosis during bacterial coexistence

Affiliations

Socially mediated induction and suppression of antibiosis during bacterial coexistence

Monica I Abrudan et al. Proc Natl Acad Sci U S A. .

Abstract

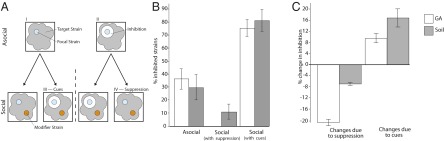
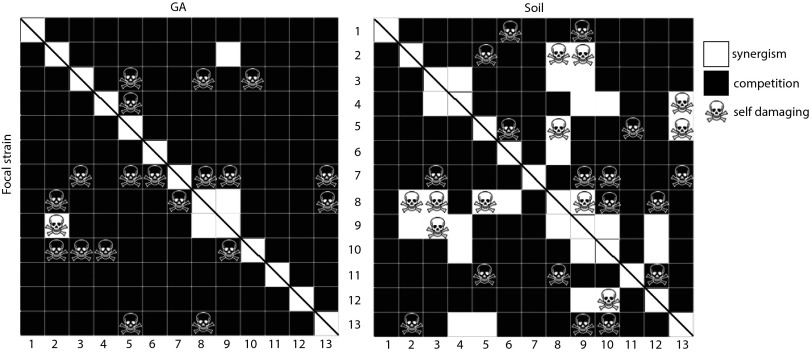
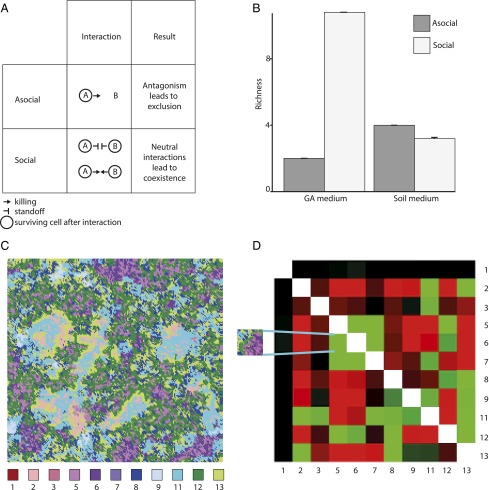
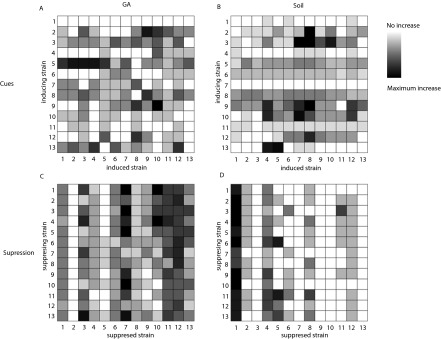
Despite their importance for humans, there is little consensus on the function of antibiotics in nature for the bacteria that produce them. Classical explanations suggest that bacteria use antibiotics as weapons to kill or inhibit competitors, whereas a recent alternative hypothesis states that antibiotics are signals that coordinate cooperative social interactions between coexisting bacteria. Here we distinguish these hypotheses in the prolific antibiotic-producing genus Streptomyces and provide strong evidence that antibiotics are weapons whose expression is significantly influenced by social and competitive interactions between competing strains. We show that cells induce facultative responses to cues produced by competitors by (i) increasing their own antibiotic production, thereby decreasing costs associated with constitutive synthesis of these expensive products, and (ii) by suppressing antibiotic production in competitors, thereby reducing direct threats to themselves. These results thus show that although antibiotic production is profoundly social, it is emphatically not cooperative. Using computer simulations, we next show that these facultative strategies can facilitate the maintenance of biodiversity in a community context by converting lethal interactions between neighboring colonies to neutral interactions where neither strain excludes the other. Thus, just as bacteriocins can lead to increased diversity via rock-paper-scissors dynamics, so too can antibiotics via elicitation and suppression. Our results reveal that social interactions are crucial for understanding antibiosis and bacterial community dynamics, and highlight the potential of interbacterial interactions for novel drug discovery by eliciting pathways that mediate interference competition.

Keywords: Streptomyces; antibiotics; competition sensing; microbial ecology; sociomicrobiology.


Conflict of interest statement

The authors declare no conflict of interest.

Figures

Fig. 1.
Fig. 1.
(A) Schematic of asocial and social inhibition assays. In asocial assays, focal strains (blue) are tested for their capacity to inhibit each other strain (gray) when plated atop the focal colonies in a soft agar overlay. Inhibition was detected as a zone of clearance surrounding focal colonies (II) whereas an absence of inhibition was detected as an absence of clearance (I). All 13 strains were tested as both the focal and target strains, leading to 169 possible assays. The fraction of strains that each focal isolate inhibited during asocial interactions was compared with their inhibitory capacity during social assays. Social assays measured inhibitory capacity of focal strains after growing adjacent to modifier strains (orange). Social interactions could generate two different outcomes: (i) modifier strains could increase (III) the inhibitory capacity of focal strains (I → III), or (ii) they could suppress (IV) the inhibitory capacity of focal strains (II → IV). During social assays, each strain could serve as the focal strain, the target strain, or the modifier strain, leading to a total of 13 × 13 × 13 = 2,197 interactions. For each focal strain, asocial interactions form the baseline against which we identified the influence of modifier strains during social assays. Thus, if the blue focal strain inhibits the gray target strain, but only when grown in the context of the orange modifier strain, this would indicate that the blue strain is responding to a cue produced by the orange strain (as in III). Alternatively, if the focal blue strain becomes incapable of killing the gray target strain when grown in the presence of the orange strain, this would indicate that the orange strain is suppressing the blue strain (as in IV). (B) Mean inhibitory capacity of strains during asocial and social assays. Asocial inhibition is scored as the fraction of strains inhibited in pairwise interactions, whereas social inhibition is scored as the average reduction/increase in the fraction of strains that are inhibited following either suppression or response to cues. (C) Mean proportional change in inhibition due to cues and suppression compared with asocial inhibition. Values correspond to mean ± SEM.
Fig. 2.
Fig. 2.
Competitive (black) and synergistic (white) inhibition during pairwise social interactions in (Left) GA (A) and (Right) soil (B). Competitive inhibition between a pair of strains is indicated when the inhibitory capacity of either strain is reduced during social (AB = A grown in the presence of B) vs. asocial (A = A grown alone) assays (AB ≤ A or BA ≤ B). Synergism, is indicated when the joint inhibitory capacity of the two strains together in social assays exceeds the sum of their inhibition when grown alone (AB > A and BA > B) (27). Skulls refer to the cases where strains on the rows induce antibiotic production in competitors during social assays to which they are themselves susceptible; i.e., they are self-damaging. The two matrices are symmetrical with respect to the first diagonal (except for the self-damaging relationships), and the relationships with self are not assessed (white squares cut with a diagonal line).
Fig. 3.
Fig. 3.
(A) Differential effects on biodiversity of social and asocial interactions during simulations. One strain excludes the other during aggressive interactions, whereas during neutral interactions both strains coexist. Aggressive interactions during asocial simulations can be converted, by cues and suppression, to neutral interactions during social simulations that facilitate coexistence. (B) Average strain richness (mean ± SEM) during asocial and social simulations in both resource environments. In GA, there is a significant increase in the richness of surviving communities in social vs. asocial simulations (from 2 to 10.8; ANOVA: F1,199 = 21,376.13, P < 0.001) also reflected in Shannon diversity (from 0.58 to 1.88; ANOVA: F1,199 = 32,194.18, P < 0.001), whereas in soil there is a marginal decline in strain richness (from 4 to 3; ANOVA: F1,199 = 406.4, P < 0.001) and a marginal increase in Shannon diversity (from 0.7 to 0.85; ANOVA: F1,199 = 274.24, P < 0.001). (C) A screenshot of the final time point of one simulation grid depicting spatial patterns formed by the surviving strains. (D) Increased diversity during social simulations in GA leads to significant positive (green) and negative (red) associations between neighboring pairs of surviving strains. Strains that associate at no greater or lesser frequency than expected by chance are shown in black. (Inset) Fragment of the simulation grid in C depicts the positive spatial association between strains 5 (light purple) and 6 (dark purple).
Fig. S1.
Fig. S1.
(A) Results of asocial and social assays in GA. On rows, each strain is presented as a focal or a modifier strain (13 × 13 rows), and targets are shown in columns. Inhibition in asocial assays is depicted in gray, and an absence of inhibition is depicted in orange. Suppression appears as blue, and responses to cues are shown in red. (B) Results of asocial and social assays in soil. On rows each strain is presented as a focal or a modifier strain (13 × 13 rows) and targets are shown in columns. Inhibition in asocial assays is depicted in gray, and an absence of inhibition is depicted in orange. Suppression appears as blue and responses to cues are shown in red.
Fig. S2.
Fig. S2.
Heat maps showing the magnitude of responses of strains to cues from each other strain in (A) GA and (B) soil and their ability to suppress each other strain in (C) GA and (D) soil. The color palette is scaled to the minimum and maximum values of each interaction assessed: (A) min = 0, max = 7; (B) min = 0, max = 11; (C) min = 0, max = 9; (D) min = 0, max = 5.
Fig. S3.
Fig. S3.
Bayesian maximum-likelihood tree based upon the concatenated sequences from partial 16S rDNA, ssgA, and rpoB from each isolate. S. coelicolor, S. griseus, and S. lividans are used as references, with Kitasatospora sp. as an outgroup. Posterior probabilities are shown on the nodes; nodes with less than 95% posterior probability were collapsed. We found no significant correlation between phylogenetic distance and either killing, response to cues, or suppression by any of the 13 strains in either soil or GA media (Mantel nonparametric test with 10,000 randomizations; P > 0.05 for all comparisons after Holm–Bonferroni correction).

Comment in

  • Antibiotics and the art of bacterial war.
    Cornforth DM, Foster KR. Cornforth DM, et al. Proc Natl Acad Sci U S A. 2015 Sep 1;112(35):10827-8. doi: 10.1073/pnas.1513608112. Epub 2015 Aug 24. Proc Natl Acad Sci U S A. 2015. PMID: 26305963 Free PMC article. No abstract available.

References

    1. Zhu H, Sandiford SK, van Wezel GP. Triggers and cues that activate antibiotic production by actinomycetes. J Ind Microbiol Biotechnol. 2014;41(2):371–386. - PubMed
    1. Davies J, Davies D. Origins and evolution of antibiotic resistance. Microbiol Mol Biol Rev. 2010;74(3):417–433. - PMC - PubMed
    1. Woolhouse M, Farrar J. Policy: An intergovernmental panel on antimicrobial resistance. Nature. 2014;509(7502):555–557. - PubMed
    1. Charlop-Powers Z, et al. Global biogeographic sampling of bacterial secondary metabolism. eLife. 2015;4:e05048. - PMC - PubMed
    1. Ling LL, et al. A new antibiotic kills pathogens without detectable resistance. Nature. 2015;517:455–459. - PMC - PubMed

Publication types

MeSH terms

Substances