. 2015 Aug 11;112(32):9902-7.
doi: 10.1073/pnas.1422401112. Epub 2015 Jul 27.

Rational design of antibodies targeting specific epitopes within intrinsically disordered proteins

Affiliations

Rational design of antibodies targeting specific epitopes within intrinsically disordered proteins

Pietro Sormanni et al. Proc Natl Acad Sci U S A. .

Abstract

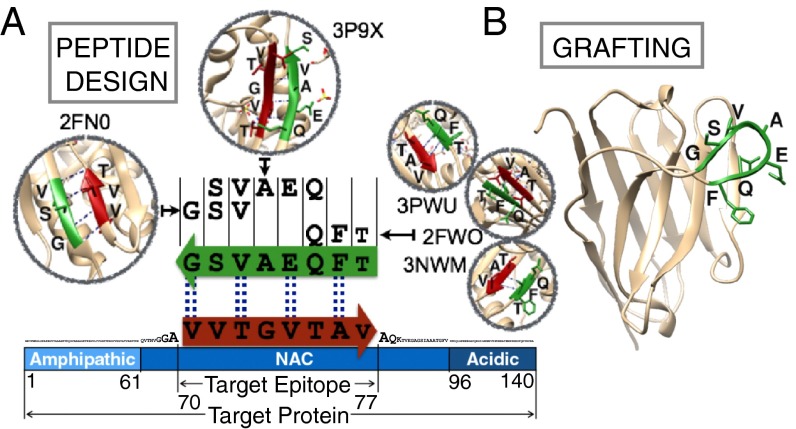
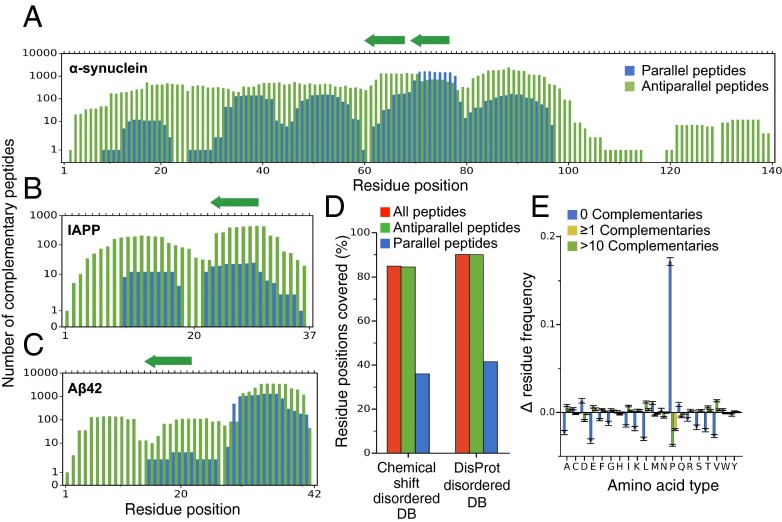
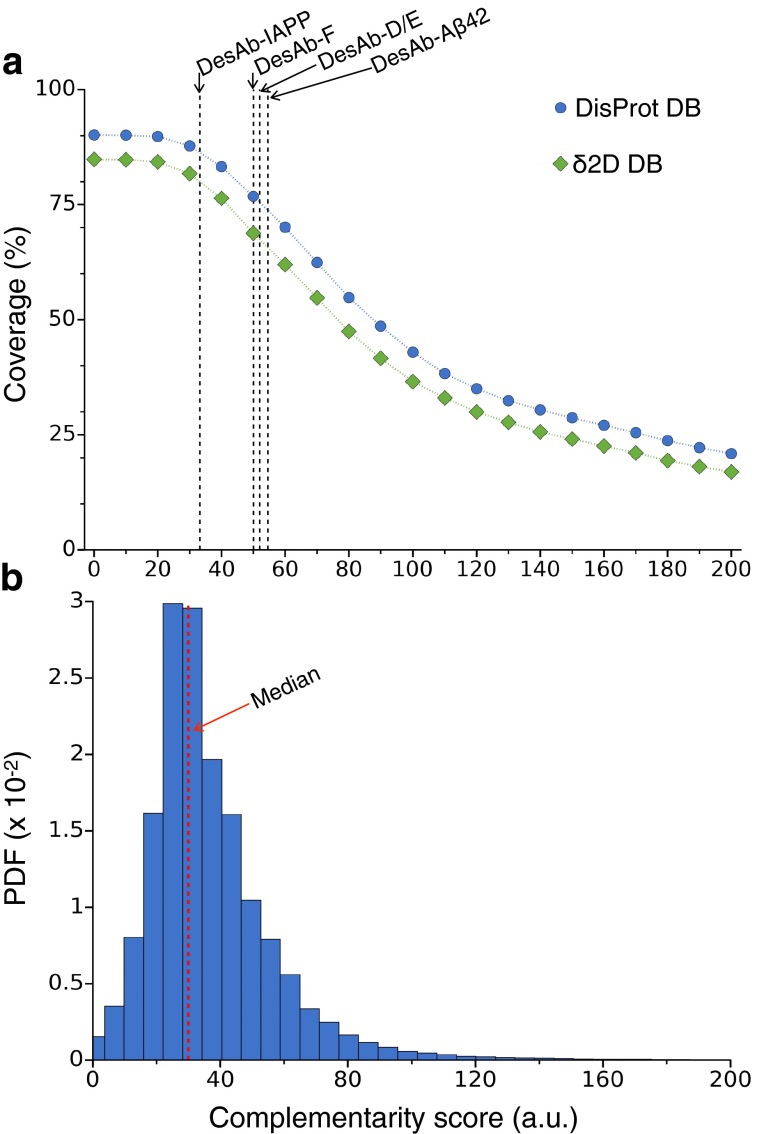
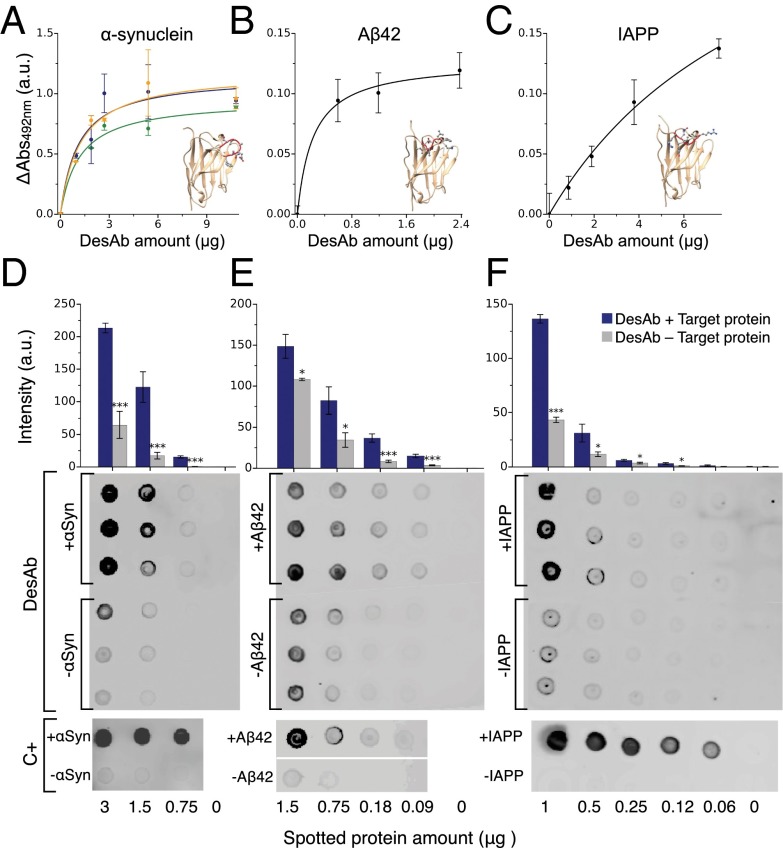
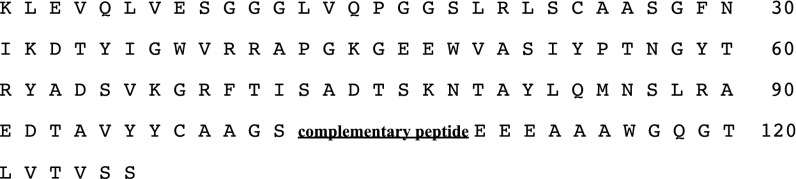
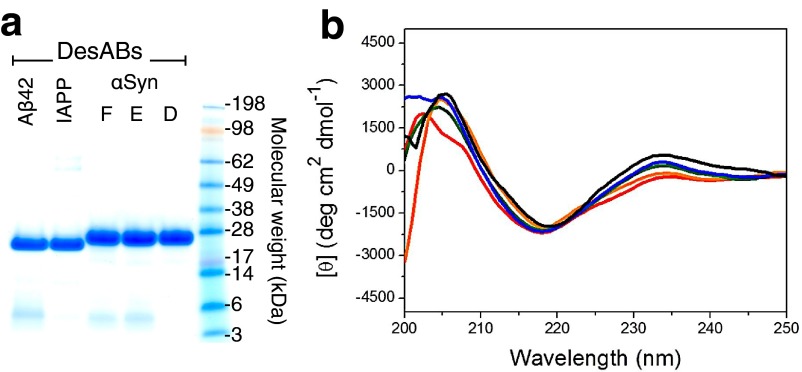
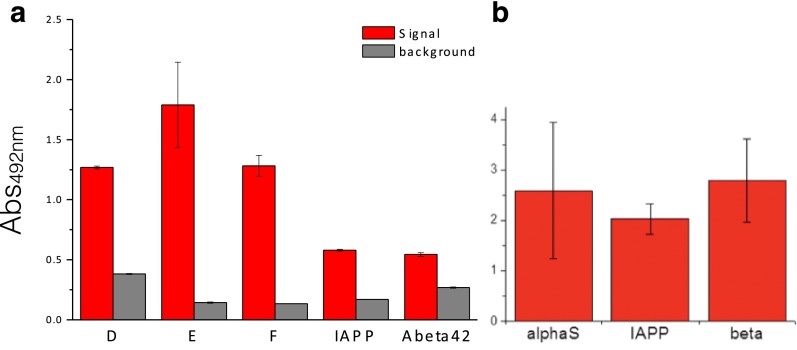
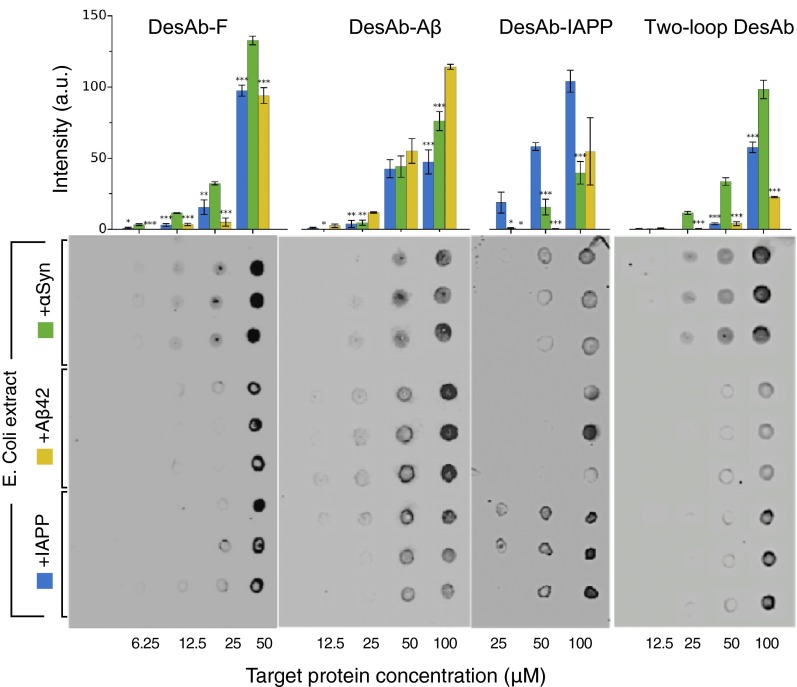
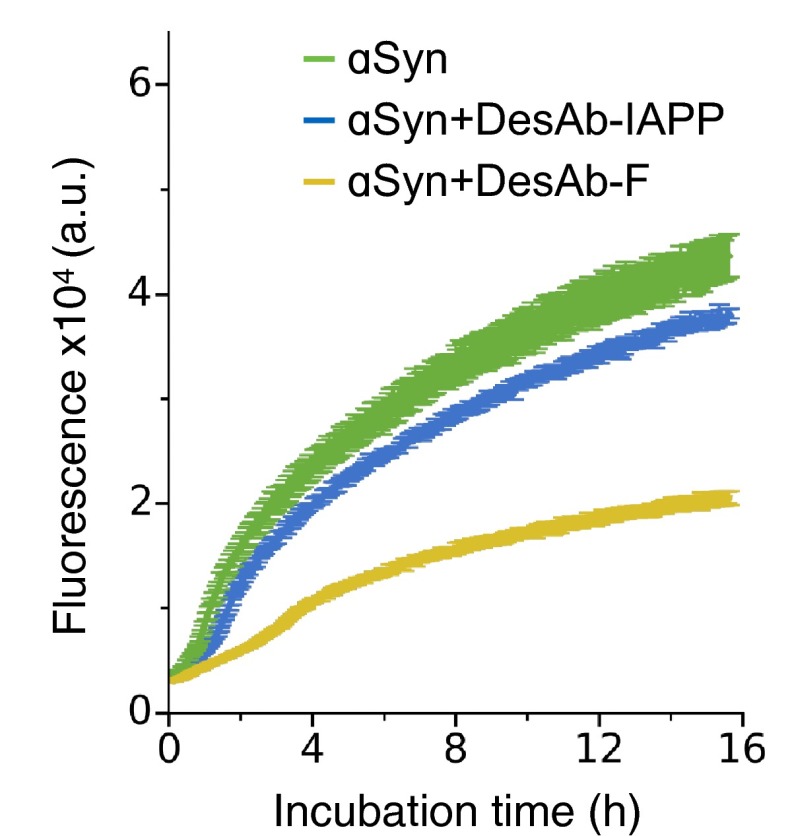
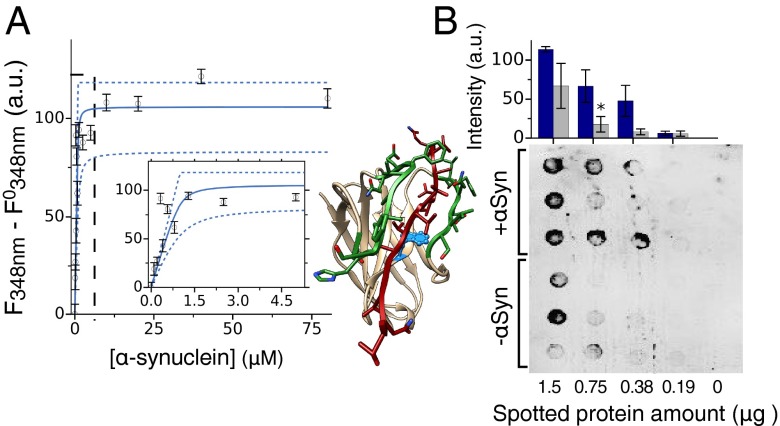
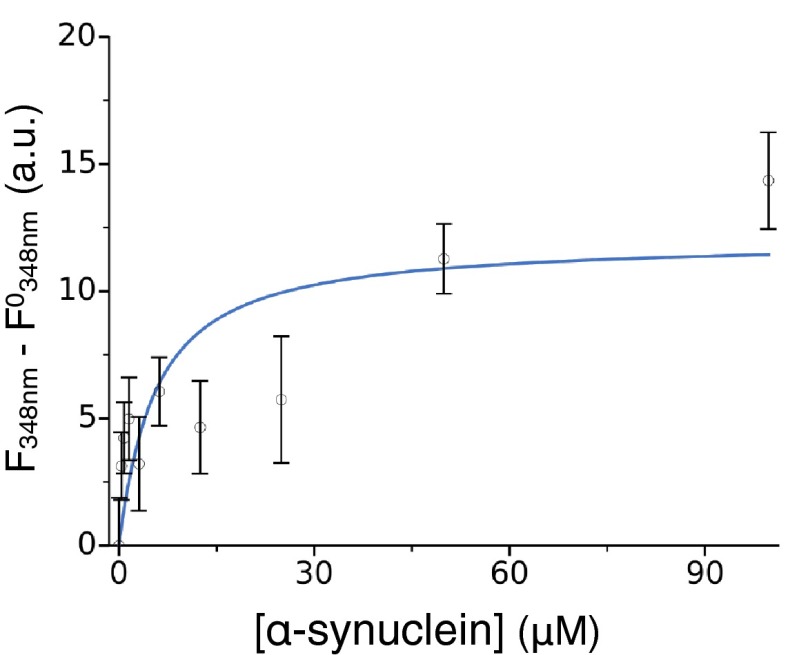
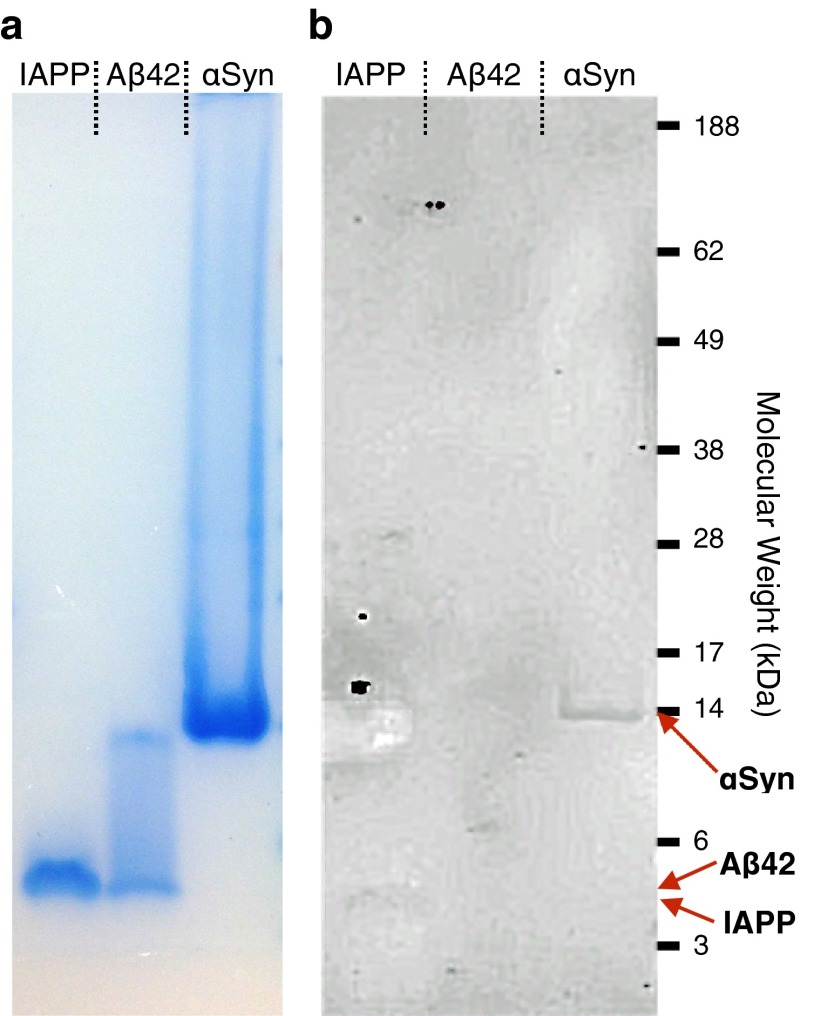
Antibodies are powerful tools in life sciences research, as well as in diagnostic and therapeutic applications, because of their ability to bind given molecules with high affinity and specificity. Using current methods, however, it is laborious and sometimes difficult to generate antibodies to target specific epitopes within a protein, in particular if these epitopes are not effective antigens. Here we present a method to rationally design antibodies to enable them to bind virtually any chosen disordered epitope in a protein. The procedure consists in the sequence-based design of one or more complementary peptides targeting a selected disordered epitope and the subsequent grafting of such peptides on an antibody scaffold. We illustrate the method by designing six single-domain antibodies to bind different epitopes within three disease-related intrinsically disordered proteins and peptides (α-synuclein, Aβ42, and IAPP). Our results show that all these designed antibodies bind their targets with good affinity and specificity. As an example of an application, we show that one of these antibodies inhibits the aggregation of α-synuclein at substoichiometric concentrations and that binding occurs at the selected epitope. Taken together, these results indicate that the design strategy that we propose makes it possible to obtain antibodies targeting given epitopes in disordered proteins or protein regions.

Keywords: complementary peptides; protein aggregation; protein design.


Conflict of interest statement

The authors declare no conflict of interest.

Figures

Fig. 1.
Fig. 1.
Illustration of the method of designing antibodies targeting specific epitopes within disordered proteins. (A) Sequence-based design of complementary peptides. Sequence fragments in β-strand conformations are extracted from the PDB and combined using the cascade method to generate a peptide complementary to the target epitope (SI Materials and Methods). The example shows an antiparallel peptide for an epitope (residues 70–77) in the NAC region of α-synuclein. Dashed lines connect the amino acids predicted to form backbone-backbone hydrogen bonds. (B) The designed peptide is then grafted in place of the CDR loop of an antibody. In this example it is grafted in place of the CDR3 of a human single domain antibody scaffold (SI Materials and Methods). This example corresponds to DesAb-F in Table 1.
Fig. S1.
Fig. S1.
Example of results from the cascade procedure. The sequences shown are the ones that we have selected for the experimental validation (Figs. 3–5 and Table 1). The first target sequence from the top belongs to the IAPP peptide, the second to Aβ42, and the last three to α-synuclein. In bold is the sequence of the complementary peptide that we actually grafted on the single domain antibody scaffold; a colon marks the residues predicted to participate in backbone-backbone hydrogen bonding with the target sequence.
Fig. 2.
Fig. 2.
Generality of the cascade method. (A–C) Coverage of α-synuclein (A), Aβ42 (B), and IAPP (C). For each residue in the sequence (x axis) we report the number of different complementary 8-residue peptides predicted to bind an epitope containing it. Peptides built from parallel β-strands are in blue and from antiparallel ones in green. The arrows on the top axis mark the positions of the peptides selected for experimental validation (Table 1). (D) Percentage of residues in the disordered regions of the δ2D database (37, 38) (Left) and of the DisProt database (36) (Right) covered by at least one complementary peptide. (E) Difference between the residue frequencies (y axis) observed in three classes of sequence regions within the two databases considered in D and those of the databases themselves. The classes are regions not covered by any complementary peptide (blue), by at least 1 complementary peptide (yellow) and by more than 10 complementary peptides (green).
Fig. S2.
Fig. S2.
Ranking the complementary peptides. (A) Variation of the complementary peptide coverage reported in Fig. 2D of the disordered regions in the DisProt database (blue) and the δ2D database (green) as a function of the complementarity score described in Ranking the Candidates. The dashed lines are the complementarity scores of the five peptides (Fig. S3) we grafted on the human sdAb scaffold for experimental validation (the one-loop DesAb variants). (B) Probability density function of the complementarity scores of all peptides covering the two databases; the red dashed line is the median value.
Fig. 3.
Fig. 3.
Binding and specificity of the designed antibodies (DesAb). (A–C) ELISA test of the DesAbs in Table 1 with one complementary peptide grafted in the CDR3 that specifically target α-synuclein (A) (DesAb-D in green, DesAb-E in blue, and DesAb-F in orange), Aβ42 (B) (DesAb-Aβ), and IAPP (C) (DesAb-IAPP); the lines are a guide for the eye. Homology models of the structures of the designed antibodies are represented with the grafted complementary peptide in red. (D–F) Dot blot assay performed with three DesAb variants: DesAb-F (D), DesAb-Aβ (E), and DesAb-IAPP (F) and three commercially available antibodies used as a positive control (C+) for the binding to E. coli lysates from cell lines expressing the target protein (dots labeled with +, blue columns) and not expressing it (−, gray column). In the case of DesAb-IAPP, synthetic amylin peptide was mixed to the E. coli lysate (+IAPP) before performing the experiment, as a cell line expressing IAPP was not available. Protein amount is the micrograms of total protein (lysate) spotted on the membrane. The bar plot is a quantification of the intensities of the DesAb dot blots (SI Materials and Methods). Intensities are *>2 σeq away, ** > 3 σeq, and *** > 4 σeq, with σeq=SE+2+SE2 and SE being the standard error from the intensities of the three dots.
Fig. S3.
Fig. S3.
Sequence of the single domain antibody scaffold used in this work for all DesAb variants with one loop engineered. The different complementary peptides used in the CDR3 are listed in Table 1.
Fig. S4.
Fig. S4.
(A) SDS/PAGE analysis on the different purified DesAb variants. (B) Far-UV CD structural characterization of the DesAb variants (DesAb-D in blue, DesAb-E in green, DesAb-F in red, DesAb-IAPP in orange, DesAb-Aβ in black).
Fig. S5.
Fig. S5.
Control experiments for the ELISA tests. (A) Cross-reactivity of primary and secondary antibodies in the ELISA test. The bar plot represents the absorbance at 492 nm of ELISA wells coated with the DesAb variants (x axis; Table 1 and SI Materials and Methods) in the presence (red) and absence (gray) of the antigen protein of the DesAbs. The coated amounts were 10 μg for DesAb D, E, and F, 2.4 μg for DesAb-Aβ, and 7 μg for DesAb-IAPP. (B) Reactivity of the primary antibodies in the ELISA for their specific target.
Fig. S6.
Fig. S6.
Dot blot assay for the specificity of the designed antibodies. Dot blot assay for the binding (from left to right) of DesAb-F DesAb-Aβ, DesAb-IAPP, and two-loop DesAb to same concentrations (x axis) of purified αSyn (green bars, top three lines of dots), synthetic Aβ42 (yellow bars, middle three lines of dots), and IAPP (blue bars, lower three lines of dots) mixed to an E. coli lysate. The bar plot is a quantification of the intensities of the DesAb dot blots (SI Materials and Methods). Intensities are *>2 σeq away, ** > 3 σeq, and *** > 4 σeq with σeq=SE+2+SE2, SE being the standard error from the intensities of the three dots.
Fig. 4.
Fig. 4.
Comprehensive characterization of the designed antibody DesAb-F. (A) The binding of DesAb-F to its target α-synuclein is much stronger than that for Aβ42 and IAPP; in the ELISA, we report the increase in the Abs490nm in the three cases. (B) Fluorescence titration with dansylated α-synuclein in the presence of increasing concentrations of DesAb-F (following the red shift of λmax). The solid blue line represents the best fit (Kd = 18 μM) using a single-binding model, and the broken lines the 95% CI on the fitting parameters (Kd between 11 and 27 μM). (C) Fluorescence competition assay; the y axis report the fraction of complex dansyl-α-synuclein:DesAb-F in the absence (blue) and presence of nonlabeled α-synuclein (red) or α-synuclein-P73 (purple). In A and C, the statistical significance of the difference with the first column was assessed with a Welch's t test (*P < 0.05).
Fig. 5.
Fig. 5.
The designed antibody DesAb-F inhibits α-synuclein aggregation. (A) Analysis on the soluble fraction of α-synuclein during its aggregation in the absence (black line) and presence (red line) of 1:10 molar ratio of DesAb-F:α-synuclein. (B) Seeded aggregation assay (3% seeds) at increasing molar ratios of DesAb-F (reported on the right axis). Different replicates for each condition are reported. (C) Initial growth rates over the molar ratios of single domain antibody scaffold. (D) Initial growth rate over the percentage of seeds in the presence of a fixed ratio of antibody (1:5).
Fig. S7.
Fig. S7.
α-Synuclein aggregation with a control DesAb. Seeded aggregation assay (3% seeds) of 70 μM α-synuclein alone (green) and in the presence of DesAb-F (yellow) and DesAb-IAPP (blue). The DesAb:α-synuclein monomer ratio is 1:2 for both DesAb variants. Error bars are SEs over three replicates.
Fig. 6.
Fig. 6.
Binding and specificity of the 2-loop DesAb. (A) Intrinsic fluorescence (Trp) titration assay performed at a constant concentration of two-loop DesAb (1 μM) and increasing concentration of α-synuclein (x axis). The solid blue line represents the best fit (Kd = 45 nM) and the broken lines the 95% CI on the fitting parameters (Kd up to 185 nM). (Inset) Zoom of the region highlighted by the dashed-black line. (B) Dot blot assay for the binding of the two-loop DesAb variant to an E. coli lysate from a cell line expressing α-synuclein (top three rows, blue column) and not expressing it (bottom three rows, gray columns). The structure shown is a coarse-grained model to illustrate the concept of two loops grafted into the sdAb scaffold, the complementary peptides are in green and the α-synuclein epitope (residues 64–80) in red, and Trp-47 is shown in light blue.
Fig. S8.
Fig. S8.
Design of the two-loop DesAb variant. (A–D) structures of three nanobodies (A–C) and the HEL4 human single domain antibody (D) used for the design of the two-loop construct; loops containing the CDR3 and CDR2 are colored in dark gray, and disulphide bridges stabilizing the CDR3 are highlighted in cyan when present. (A) Structure of a nanobody (1RI8) with the ligand that binds between the CDR3 and the CDR2 shown in transparent orange. (B) Structure of a nanobody (2X6M) bound to the C-terminal peptide of α-synuclein (orange), Lys105 and Asn52 are colored in magenta, and their hydrogen bond network with the backbone of the CDR3 loop is drawn (formed hydrogen bonds are in dark blue, possible ones in light blue). (C) Structure of a nanobody (4KRP) showing Asn52 in magenta, Ala33 in yellow and Tyr122-Asp123-Tyr124 on the stem of the CDR3 in green. (E) Structural integrity of the two-loop DesAb assessed with far-UV CD. (F) Alignment of the four template sequences with the two-loop DesAb sequence (named 2Loops) with the grafted CDR sequences underlined and the complementary peptides colored in green; the sequence of the one-loop DesAb scaffold is also reported (1Loop), and the residues in the two-loop DesAb sequence that differ from those in the one-loop DesAb outside the CDR loops are highlighted in yellow. These residues are also those colored in the corresponding template structures (A–C) with the exception of Glu130, which was selected from ref. . (G) Representation of the pincer-like binding to α-synuclein of the complementary peptides grafted in the CDR2 and CDR3 loops of the two-loop DesAb construct; equal signs mark residues predicted to be involved in backbone-backbone hydrogen bonding and arrows denote the N to C terminus direction. (H) Results from the cascade method for the two peptides grafted in the two-loop DesAb scaffold; grafted sequences are shown in bold.
Fig. S9.
Fig. S9.
DesAb-F intrinsic fluorescence. Intrinsic fluorescence (Trp) titration assay performed at a constant concentration of DesAb-F (1 μM) and increasing concentration of α-synuclein (x axis). The solid blue line represents the best fit (Kd = 5 μM).
Fig. S10.
Fig. S10.
Western blot analysis of the reactivity of the two-loop DesAb for α-synuclein, Aβ42, and IAPP. SDS/PAGE (A) and corresponding Western blot (B) of samples at the same concentration (200 μM) of α-synuclein (αSyn), Aβ42, and IAPP probed with two-loop DesAb as a primary antibody. Different intensities in A are caused by differences in protein sizes.
Fig. S11.
Fig. S11.
Distribution of Kd values in the Structural Antibody Database (SAbDab). Histogram of 211 Kd values deposited in the SAbDab (53). The distribution includes Kd values from a wide range of antibody types (from full length to nanobodies) obtained with a variety of methods (from immunogenization to in vitro affinity maturation). The vertical dashed lines mark our estimates for the Kd values of DesAb-F (18 μM) and two-loop DesAb (45 nM).

References

    1. Carter PJ. Introduction to current and future protein therapeutics: A protein engineering perspective. Exp Cell Res. 2011;317(9):1261–1269. - PubMed
    1. Elvin JG, Couston RG, van der Walle CF. Therapeutic antibodies: Market considerations, disease targets and bioprocessing. Int J Pharm. 2013;440(1):83–98. - PubMed
    1. Goodman M. Market watch: Sales of biologics to show robust growth through to 2013. Nat Rev Drug Discov. 2009;8(11):837–837. - PubMed
    1. Leader B, Baca QJ, Golan DE. Protein therapeutics: A summary and pharmacological classification. Nat Rev Drug Discov. 2008;7(1):21–39. - PubMed
    1. Pavlou AK, Reichert JM. Recombinant protein therapeutics: Success rates, market trends and values to 2010. Nat Biotechnol. 2004;22(12):1513–1519. - PubMed

MeSH terms