. 2015 Sep 8;112(36):11389-94.
doi: 10.1073/pnas.1513047112. Epub 2015 Jul 27.

Mitochondrial calcium overload is a key determinant in heart failure

Affiliations

Mitochondrial calcium overload is a key determinant in heart failure

Gaetano Santulli et al. Proc Natl Acad Sci U S A. .

Abstract

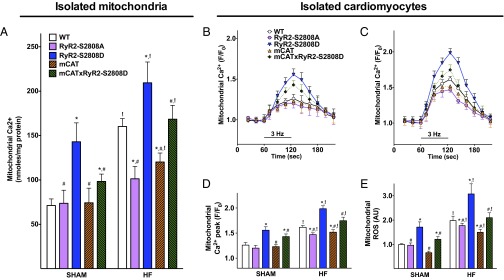
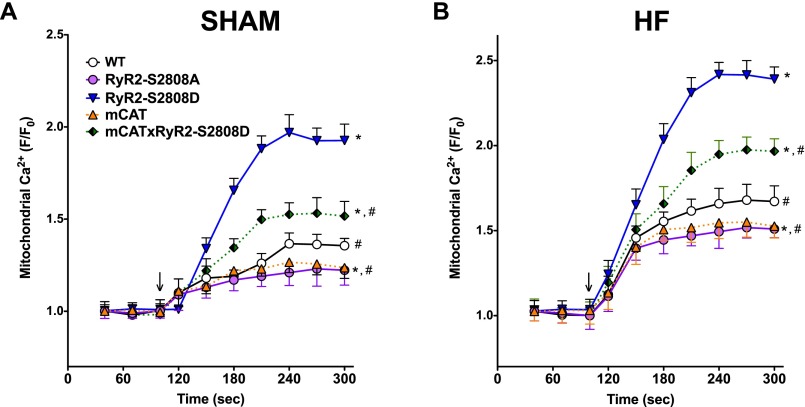
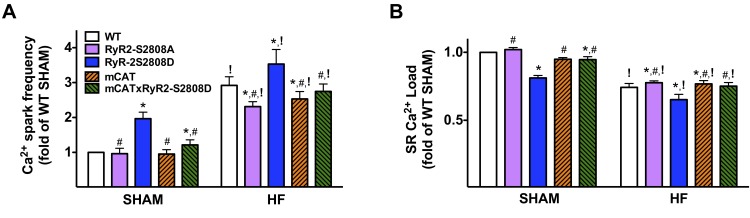
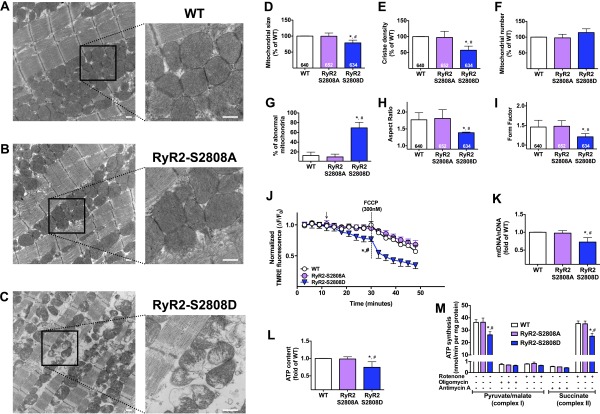
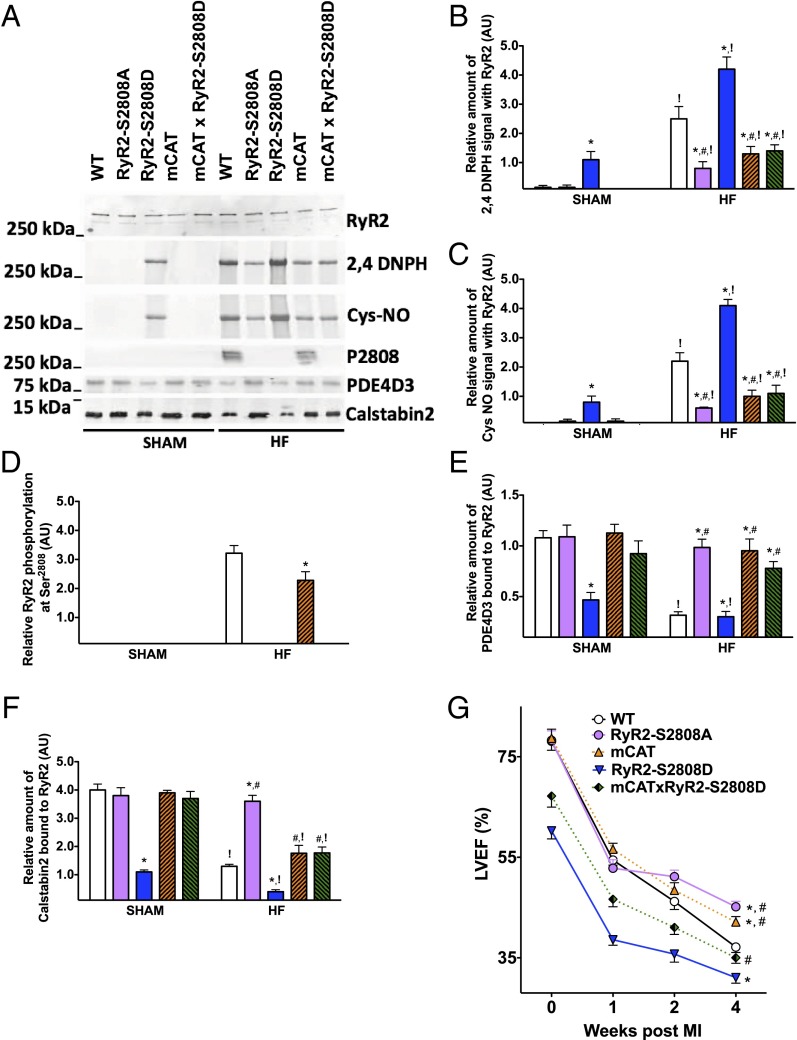
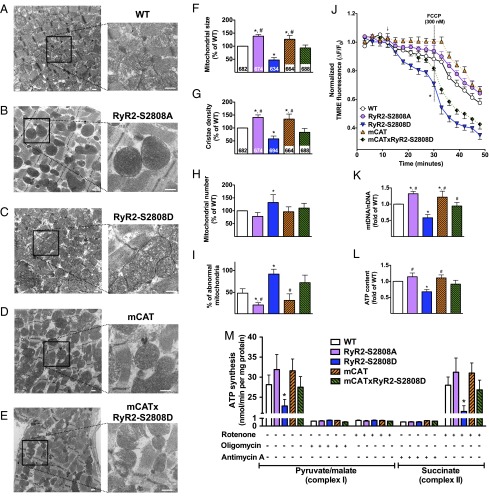
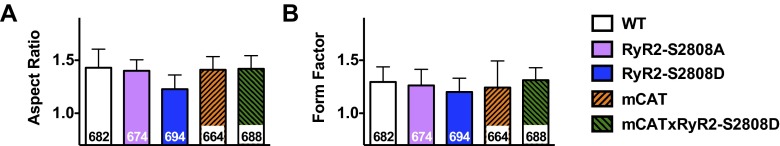
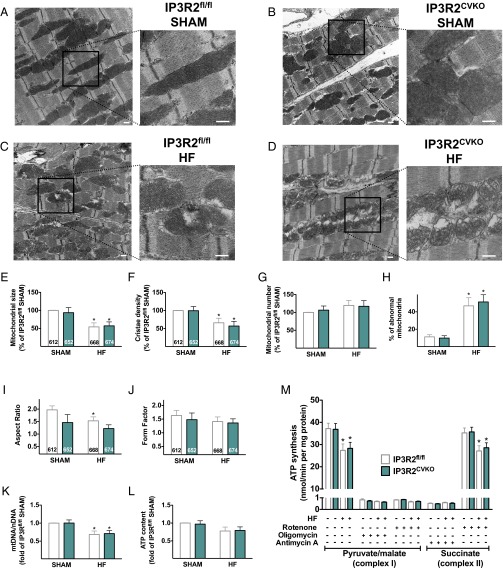
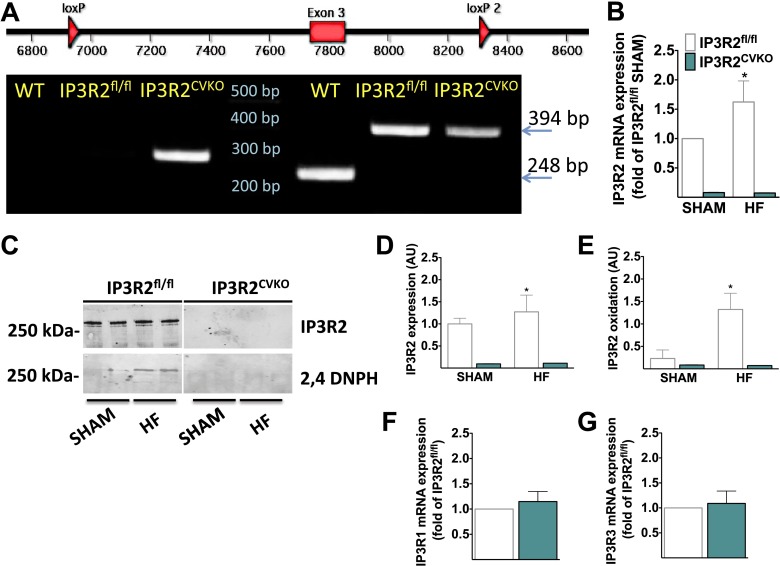
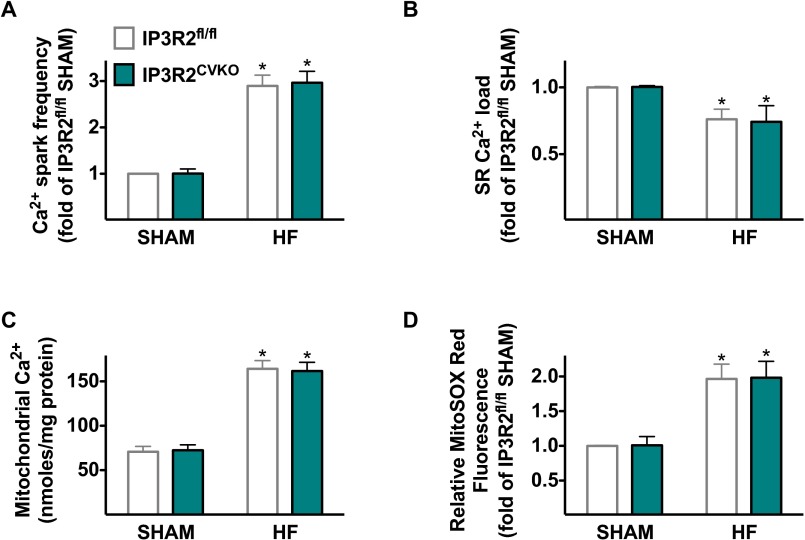
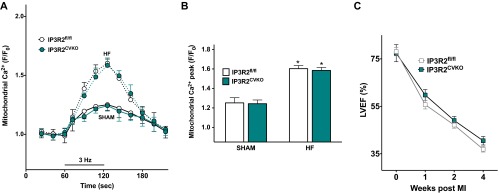
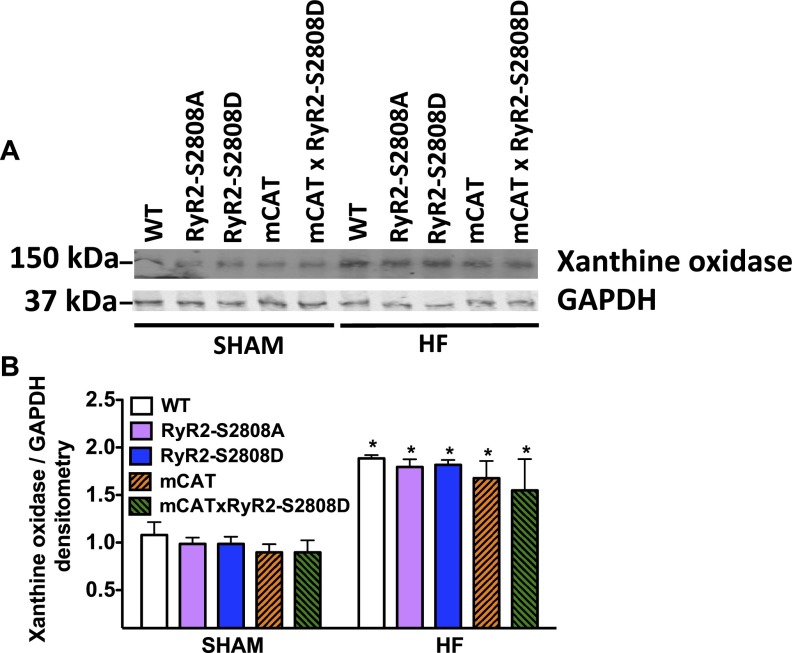
Calcium (Ca2+) released from the sarcoplasmic reticulum (SR) is crucial for excitation-contraction (E-C) coupling. Mitochondria, the major source of energy, in the form of ATP, required for cardiac contractility, are closely interconnected with the SR, and Ca2+ is essential for optimal function of these organelles. However, Ca2+ accumulation can impair mitochondrial function, leading to reduced ATP production and increased release of reactive oxygen species (ROS). Oxidative stress contributes to heart failure (HF), but whether mitochondrial Ca2+ plays a mechanistic role in HF remains unresolved. Here, we show for the first time, to our knowledge, that diastolic SR Ca2+ leak causes mitochondrial Ca2+ overload and dysfunction in a murine model of postmyocardial infarction HF. There are two forms of Ca2+ release channels on cardiac SR: type 2 ryanodine receptors (RyR2s) and type 2 inositol 1,4,5-trisphosphate receptors (IP3R2s). Using murine models harboring RyR2 mutations that either cause or inhibit SR Ca2+ leak, we found that leaky RyR2 channels result in mitochondrial Ca2+ overload, dysmorphology, and malfunction. In contrast, cardiac-specific deletion of IP3R2 had no major effect on mitochondrial fitness in HF. Moreover, genetic enhancement of mitochondrial antioxidant activity improved mitochondrial function and reduced posttranslational modifications of RyR2 macromolecular complex. Our data demonstrate that leaky RyR2, but not IP3R2, channels cause mitochondrial Ca2+ overload and dysfunction in HF.

Keywords: IP3 receptor; calcium; heart failure; mitochondria; ryanodine receptor.


Conflict of interest statement

Conflict of interest statement: A.R.M. is a consultant and member of the board of ARMGO, which is targeting RyR channels for therapeutic purposes.

Figures

Fig. 1.
Fig. 1.
Increased mitochondrial Ca2+ in post-MI heart failure. (A) Direct measurement of total Ca2+ content in mitochondria isolated from sham or failing ventricular samples of 6-mo-old WT, RyR2-S2808A, RyR2-S2808D, mCAT, and mCAT × RyR2-S2808D mice. Mitochondria were purified from ≥6 mice in each experimental group. (BD) Mitochondrial Ca2+ dynamics in response to 3 Hz in cardiomyocytes (n = 22–35) enzymatically isolated from at least 7 mice per group isolated from the indicated groups. (E) Mitochondrial ROS generation in ventricular cardiomyocytes isolated from the indicated mice using the mitochondria-targeted fluorescent indicator of superoxide production MitoSOX Red; n > 120 ventricular myocytes from ≥4 mice in each group. Data shown represent mean ± SEM from triplicate experiments. *P < 0.05 vs. WT; #P < 0.05 vs. RyR2-S2808D, ANOVA, Tukey–Kramer post hoc test; !P < 0.05 vs. SHAM, two-tailed t test. AU, arbitrary units; ROS, reactive oxygen species.
Fig. S1.
Fig. S1.
Mitochondrial Ca2+ dynamics in isolated cardiomyocytes following pharmacologically triggered intracellular Ca2+ leak via RyR2. (A and B) Mitochondrial Ca2+ in response to FK506 (5 μM, arrow) was evaluated in cardiomyocytes (n = 20–35) enzymatically isolated from at least seven mice per group in SHAM (A) and HF (B) conditions. Data are shown as mean ± SEM; *P < 0.05 vs. WT; #P < 0.05 vs. RyR2-S2808D; ANOVA repeated measures.
Fig. S2.
Fig. S2.
Evaluation of intracellular Ca2+ leak in ventricular cardiomyocytes. (A) Average Ca2+ spark activity and (B) SR Ca2+ load, in ventricular cardiomyocytes (n = 20∼22 cells per condition) enzymatically isolated from at least seven mice/group in SHAM and HF conditions. Data are shown as mean ± SEM, *P < 0.05 vs. WT; #P < 0.05 vs. RyR2-S2808D, ANOVA, Tukey–Kramer post hoc test; !P < 0.05 vs. SHAM, two-tailed t test.
Fig. S3.
Fig. S3.
Cardiac mitochondrial abnormalities and intracellular Ca2+ leak. (AC) Representative transmission electron micrographs of cardiac mitochondria from 6-mo-old WT (A), RyR2-S2808A (B), and RyR2-S2808D (C), n ≥ 5 per group. (Magnification: AC, 15,000×; Insets, 50,000×.) (Scale bars: 500 nm.) (DI) Morphometric analyses of mitochondria show abnormalities in RyR2-S2808D mice with leaky RyR2 channels. Mitochondrial size (D) and cristae density (E). Numbers in the bars indicate the number of mitochondria analyzed. Quantification of mitochondrial number per image (F) and percentage of abnormal mitochondria per image at 15,000× (G); mitochondria were defined as abnormal when a loss of electron density was detectable in more than 20% of the area of a mitochondrion. Aspect ratio (H) and form factor (I), See SI Materials and Methods for details. (JM) Evaluation of mitochondrial function. Assessment of mitochondrial membrane potential (Δψm, J); the arrow denotes addition of H2O2 (100 μM); FCCP, carbonylcyanide-p-trifluoro-methoxy-phenyl-hydrazone; the * indicates significant difference (P < 0.05, ANOVA repeated measures, Tukey–Kramer post hoc test) between the RyR2-S2808D group (n = 8) compared with WT (n = 9) and to RyR2-S2808A (n = 8). Mitochondrial DNA (mtDNA)/nuclear DNA (nDNA) copy number was assessed in left ventricular samples (K). Measurement of ATP content in left ventricle (L, n = 8 per group) and ATP synthesis rates in isolated cardiac mitochondria (M) driven by complex I (pyruvate/malate, 5 mM) and complex II (succinate 5 mM). The specificity of the measurements was verified using inhibitors (0.5 μM) of the respiratory complex, as indicated (n = 5 per group, triplicate measurements per sample). Data are shown as mean ± SEM, *P < 0.05 vs. WT; #P < 0.05 vs. RyR2-S2808A.
Fig. 2.
Fig. 2.
Posttranslational modifications of RyR2 complex and HF progression post-MI. (A) Biochemical evaluation of RyR2 macromolecular complex in left ventricular samples from sham and heart failure (HF) mice. To determine channel oxidation, the carbonyl groups in the protein side chains of immunoprecipitated RyR2 were derivatized to 2,4 dinitrophenylhydrazone (2,4 DNPH) by reaction with 2,4 dinitrophenylhydrazine. The 2,4 DNPH signal associated with RyR2 was determined by anti-DNP antibody (specificity for RyR2 was achieved due to immunoprecipitation of the protein). Anti-Cys NO antibody analysis of immunoprecipitated RyR2 was used to measure RyR2 nitrosylation. Quantification of RyR2 oxidation (B), Cys-nitrosylation (C), phosphorylation at Ser2808 (D), PDE4D3 (E), and calstabin2 (F) bound to RyR2; note that constitutive phosphorylation of Ser2808, mimicked by the aspartate residue substitution in RyR2-S2808D mice, cannot be detected. Data shown represent mean ± SEM from triplicate experiments. *P < 0.05 vs. WT; #P < 0.05 vs. RyR2-S2808D, ANOVA, Tukey–Kramer post hoc test; !P < 0.05 vs. SHAM, two-tailed t test. (G) Progressive cardiac dysfunction after myocardial infarction (MI) assessed by serial echocardiographic analyses. LVEF, left ventricular ejection fraction. Data are shown as mean ± SEM; *P < 0.05 vs. WT; #P < 0.05 vs. RyR2-S2808D; ANOVA repeated measures; n = 16–20 per group. AU, arbitrary units. See also Table S1.
Fig. 3.
Fig. 3.
Leaky RyR2 channels and mitochondrial dysfunction in heart failure. (AE) Representative transmission electron micrographs of cardiac mitochondria post myocardial infarction from WT (A), RyR2-S2808A (no leak) (B), RyR2-S2808D (leaky) (C), mCAT (D), mCAT × RyR2-S2808D (E), n = 5 per group. (Magnification: AE, 15,000×; Insets, 50,000×.) (Scale bars: 500 nm.) Note the diffuse myofibrillar disarray. (FI) Quantification of ultrastructural mitochondrial alterations depicted in AE. Mitochondrial size (F) and cristae density (G). Numbers in the bars indicate the number of mitochondria analyzed. Quantification of mitochondrial number per image (H) and percentage of abnormal mitochondria per image at 15,000× (I). Relative number of damaged mitochondria was quantified by blinded observers from 8 to 10 images from different fields. Data are shown as mean ± SEM, *P < 0.05 vs. WT; #P < 0.05 vs. RyR2-S2808D, ANOVA, Tukey–Kramer post hoc test. (J) Assessment of the inner mitochondrial membrane potential (Δψm); the arrow denotes addition of H2O2 (100 μM). FCCP, carbonylcyanide-p-trifluoro-methoxy-phenyl-hydrazone. The * indicates significant difference (P < 0.05, ANOVA repeated measures, Tukey–Kramer post hoc test) of the WT group (n = 8) compared with RyR2-S2808D (n = 7), mCAT × RyR2-S2808D (n = 7), and mCAT (n = 6), or between RyR2-S2808D and mCAT × RyR2-S2808D groups. (K) Mitochondrial DNA (mtDNA)/nuclear DNA (nDNA) copy number and (L) ATP content assessed in left ventricle (n = 8 per group). (M) Measurement of ATP synthesis rates in cardiac mitochondria isolated from failing hearts of the indicated groups. ATP synthesis was driven by complex I (pyruvate/malate, 5 mM) and complex II (succinate 5 mM). The specificity of the measurements was verified using inhibitors (0.5 μM) of respiratory complex, as indicated (n = 3 per group, triplicate measurements per sample). All data are shown as mean ± SEM, *P < 0.05 vs. WT; #P < 0.05 vs. RyR2-S2808D, ANOVA, Tukey–Kramer post hoc test.
Fig. S4.
Fig. S4.
Assessment of mitochondrial morphological dynamism in HF. (A) Aspect ratio and (B) form factor were measured as described in SI Materials and Methods in cardiac mitochondria from 6-mo-old WT, RyR2-S2808A, RyR2-S2808D, mCAT, and mCAT × RyR2-S2808D mice, 4 wk after myocardial infarction; n ≥ 5 per group; see also Fig. 3 AE. All data are shown as mean ± SEM; numbers in the bars indicate the number of mitochondria analyzed.
Fig. 4.
Fig. 4.
Cardiac ablation of IP3R2 does not rescue mitochondrial abnormalities observed in failing hearts. (AD) Representative transmission electron micrographs of cardiac mitochondria in SHAM conditions (A and B) and post myocardial infarction (C and D) from IP3R2fl/fl (A and C) and IP3R2CVKO mice (B and D), n = 5 per group. (Magnification: AD, 15,000×; Insets, 50,000×.) (Scale bars: 500 nm.) (EJ) Morphometric analysis of mitochondrial ultrastructure. Mitochondrial size (E) and cristae density (F). Quantification of mitochondrial number per image (G) and percentage of abnormal mitochondria per image at 15,000× (H). Evaluation of aspect ratio (I) and format form (J) (see SI Materials and Methods for details). (K) Mitochondrial DNA (mtDNA)/nuclear DNA (nDNA) copy number assessed in left ventricular tissue. (L) Assessment of ATP content in left ventricle (n = 6 per group) and (M) measurement of ATP synthesis rates in isolated mitochondria in sham conditions and 4 wk after coronary artery ligation, as described in Fig. 3M. All data are shown as mean ± SEM, *P < 0.05 vs. SHAM; two-tailed t test. Numbers in the bars indicate the number of mitochondria analyzed.
Fig. S5.
Fig. S5.
Generation of cardiac specific ablation of IP3R2. (A) Schematic illustration of the generation of the IP3R2 floxed mouse (Top) and representative PCR for the genotype detection of WT, IP3R2fl/fl, and IP3R2KO mice. (B) Determination of IP3R2 mRNA levels by real time quantitative reverse transcription PCR (RT-qPCR) analysis of total RNA from isolated cardiomyocytes, using actin as internal standard; each bar represents mean ± SEM of four independent experiments, in each of which reactions were performed in triplicate using the pooled total RNAs from five mice per group. (C) IP3R2 from isolated ventricular cardiomyocytes was immunoprecipitated and immunoblotted. 2,4 DNPH, 2,4-dinitrophenylhydrazone. (D and E) Quantification of data shown in C. Data shown represent means ± SEM from triplicate experiments. *P < 0.05 vs. IP3R2fl/fl, two-tailed t test. (F and G) Levels of IP3R isoforms after cardiac-specific ablation of IP3R2. Determination of IP3R1 (F) and IP3R3 (G) mRNA levels by RT-qPCR analysis of total RNA from isolated cardiomyocytes, using actin as internal standard; each bar represents mean ± SEM of four independent experiments, in each of which reactions were performed in triplicate using the pooled total RNAs from five mice/group.
Fig. S6.
Fig. S6.
Effects of cardiac ablation of IP3R2 on Ca2+ spark frequency, SR Ca2+ load, mitochondrial Ca2+ content, and ROS production. (A) Average Ca2+ spark frequency, (B) SR Ca2+ load, and (C) mitochondrial Ca2+ in ventricular cardiomyocytes (n = 20∼22 cells) isolated from at least six mice per group in SHAM and HF conditions. Data are shown as mean ± SEM. (D) Evaluation of mitochondrial ROS generation in ventricular cardiomyocytes using the mitochondria-targeted fluorescent indicator of superoxide production MitoSOX Red. n > 100 ventricular myocytes from at least four mice in each group. AU, arbitrary units. Data are shown as mean ± SEM, *P < 0.05 vs. WT; one-way ANOVA, Tukey–Kramer post hoc test.
Fig. S7.
Fig. S7.
Effects of cardiac ablation of IP3R2 on mitochondrial Ca2+ dynamics and HF progression after myocoardial infarction. (A) Mitochondrial Ca2+ in response to 3 Hz stimulation was evaluated in cardiomyocytes (n = 25–30) enzymatically isolated from at least seven mice per group in SHAM (solid lines) and HF (dotted lines) conditions. (B) The mitochondrial Ca2+ peak. Data are shown as means ± SEM, *P < 0.05 vs. SHAM, two-tailed t test. (C) Progressive cardiac dysfunction after left anterior coronary artery ligation assessed by serial ultrasound in IP3R2fl/fl and IP3R2CVKO. LVEF, left ventricular ejection fraction; n = 16–18 per group. See also Table S1.
Fig. S8.
Fig. S8.
Xanthine oxidase expression is increased in failing hearts, and in vivo genetic enhancement of mitochondrial antioxidant activity does not prevent such increase. (A) Representative immunoblots showing xanthine oxidase levels in cardiomyocytes enzymatically isolated from at least seven mice per group in SHAM and HF conditions. GAPDH was used as loading control. (B) Densitometry quantification from triplicate experiments; data are shown as mean ± SEM, *P < 0.05 vs. SHAM.

Comment in

References

    1. Santulli G, Marks AR. Essential roles of intracellular calcium release channels in muscle, brain, metabolism, and aging. Curr Mol Pharmacol. 2015 in press. - PubMed
    1. Marks AR. Calcium cycling proteins and heart failure: Mechanisms and therapeutics. J Clin Invest. 2013;123(1):46–52. - PMC - PubMed
    1. Moschella MC, Marks AR. Inositol 1,4,5-trisphosphate receptor expression in cardiac myocytes. J Cell Biol. 1993;120(5):1137–1146. - PMC - PubMed
    1. Ventura-Clapier R, Garnier A, Veksler V. Energy metabolism in heart failure. J Physiol. 2004;555(Pt 1):1–13. - PMC - PubMed
    1. Whelan RS, et al. Bax regulates primary necrosis through mitochondrial dynamics. Proc Natl Acad Sci USA. 2012;109(17):6566–6571. - PMC - PubMed

Publication types

MeSH terms

Substances