. 2015 Oct;35(19):3354-69.
doi: 10.1128/MCB.00520-15. Epub 2015 Jul 27.

Structures and Functions of the Multiple KOW Domains of Transcription Elongation Factor Spt5

Affiliations

Structures and Functions of the Multiple KOW Domains of Transcription Elongation Factor Spt5

Peter A Meyer et al. Mol Cell Biol. 2015 Oct.

Abstract

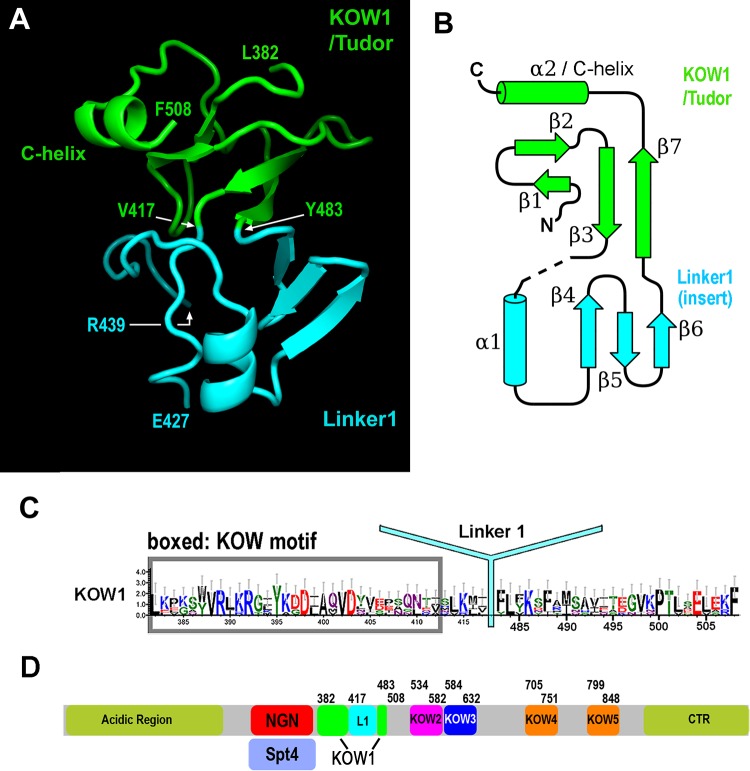
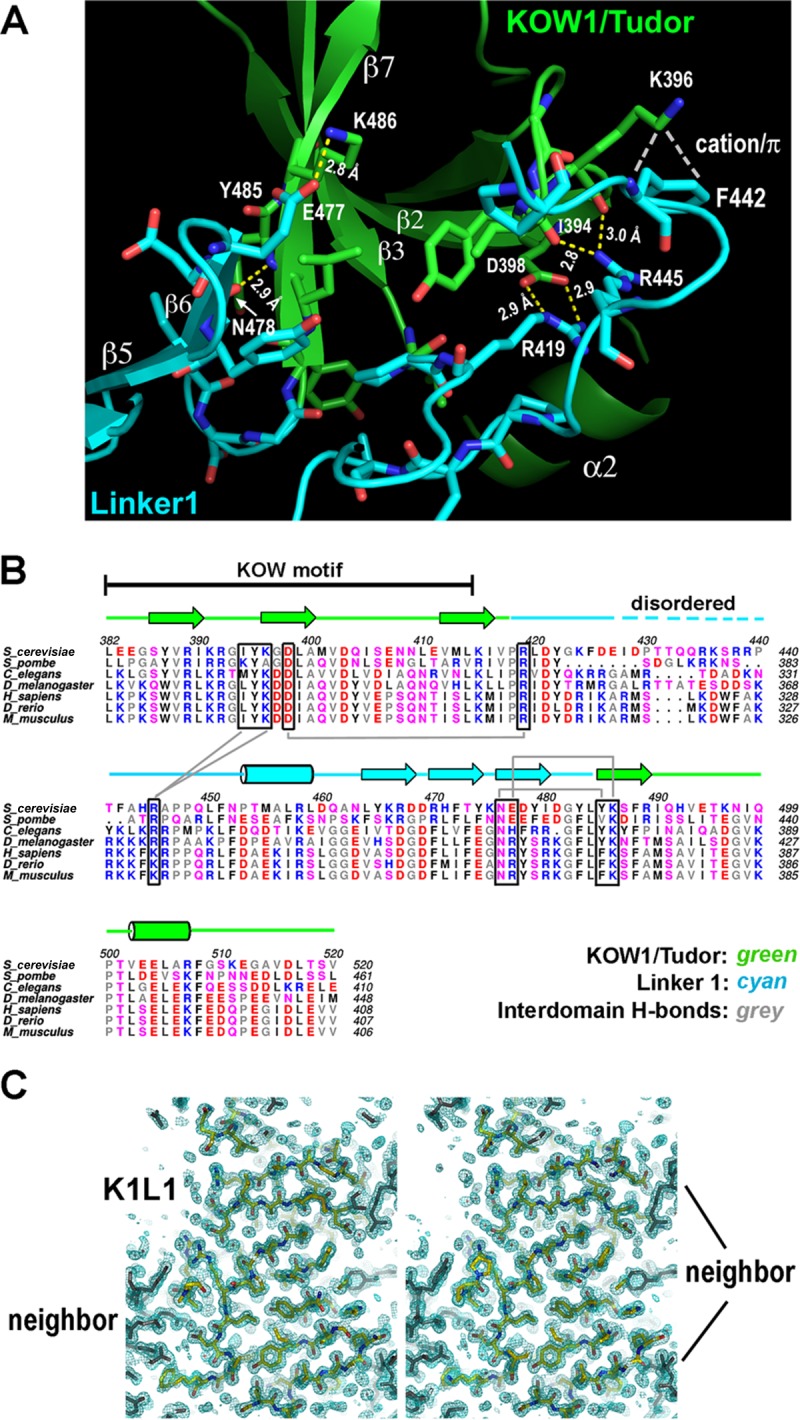
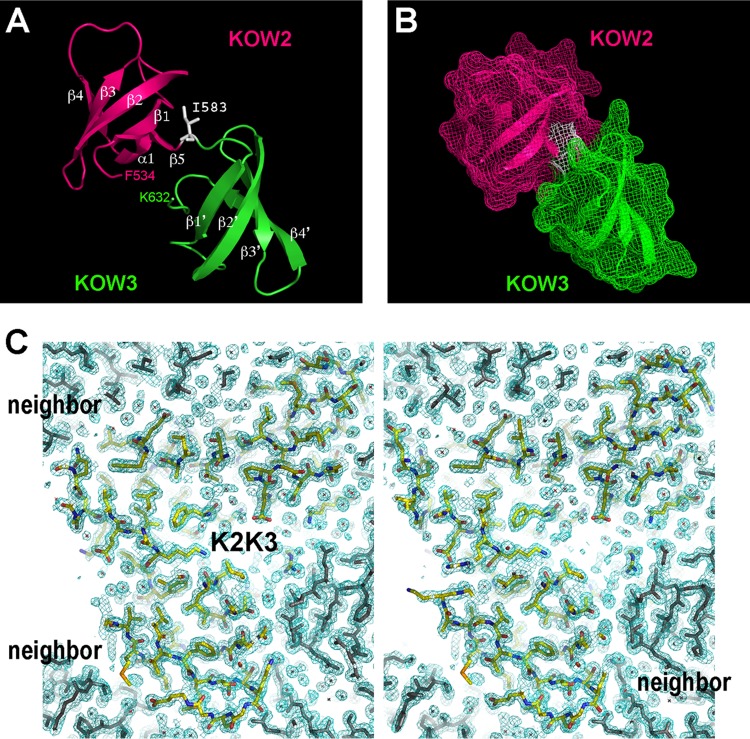
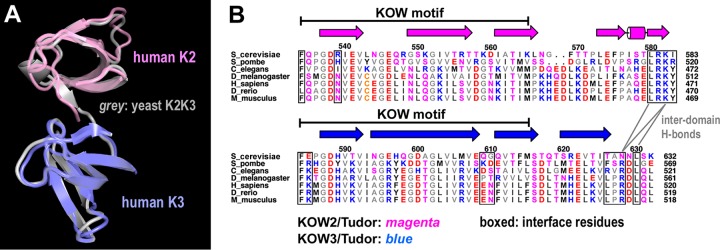
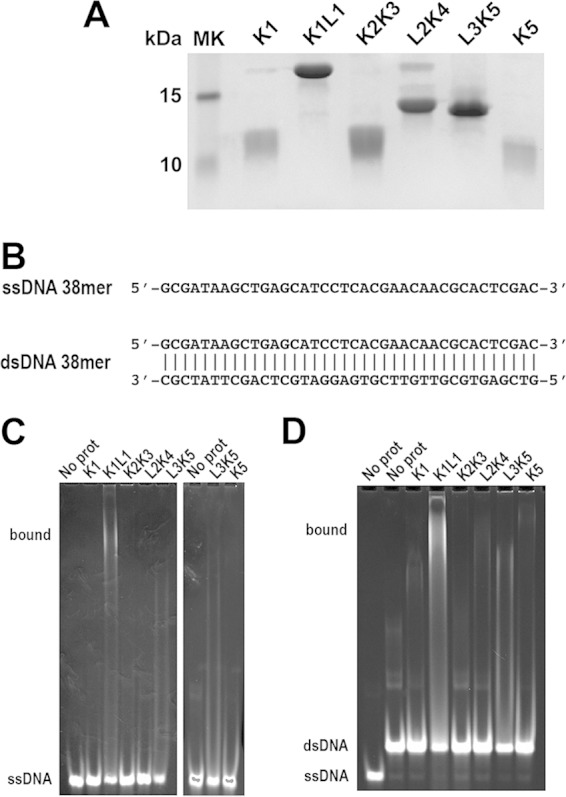
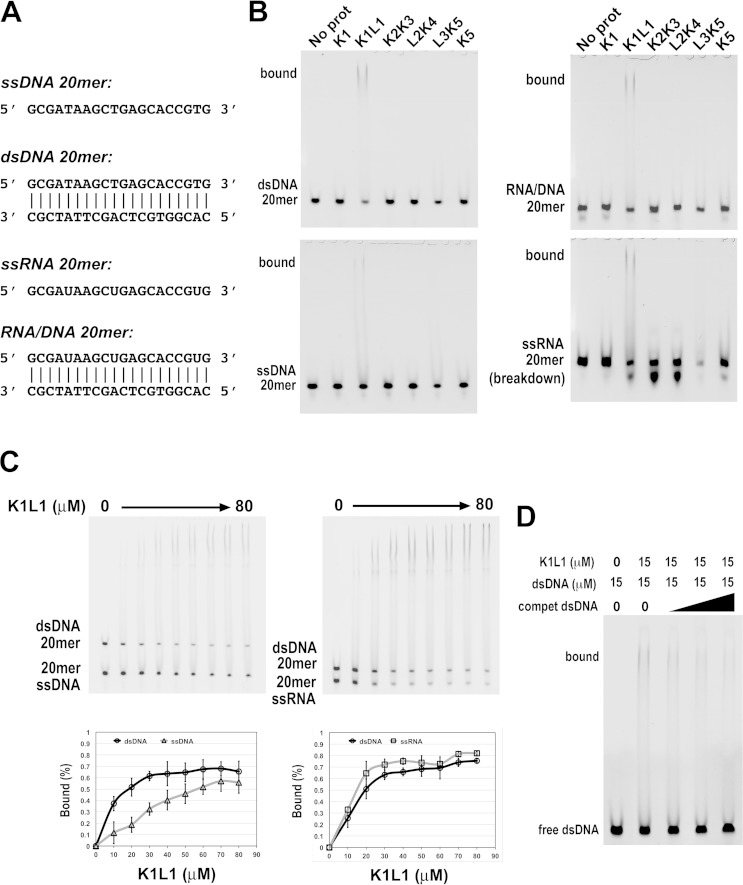
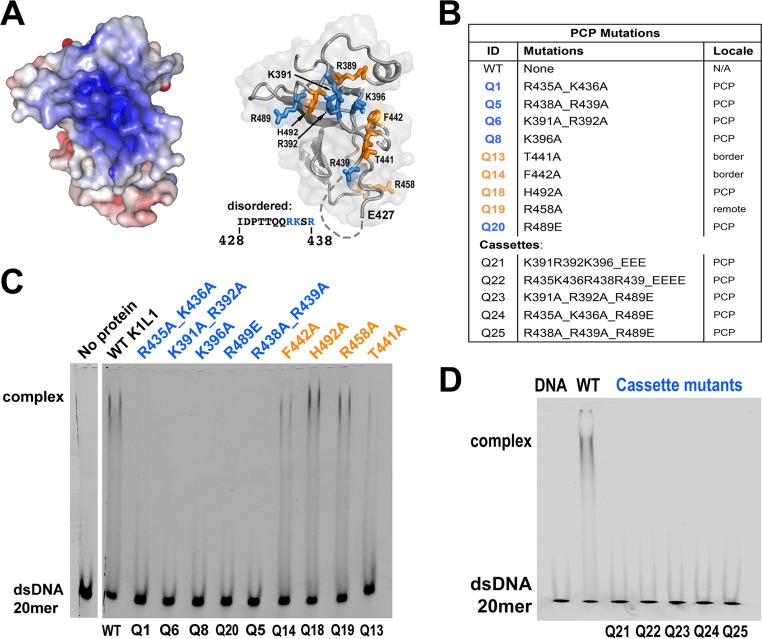
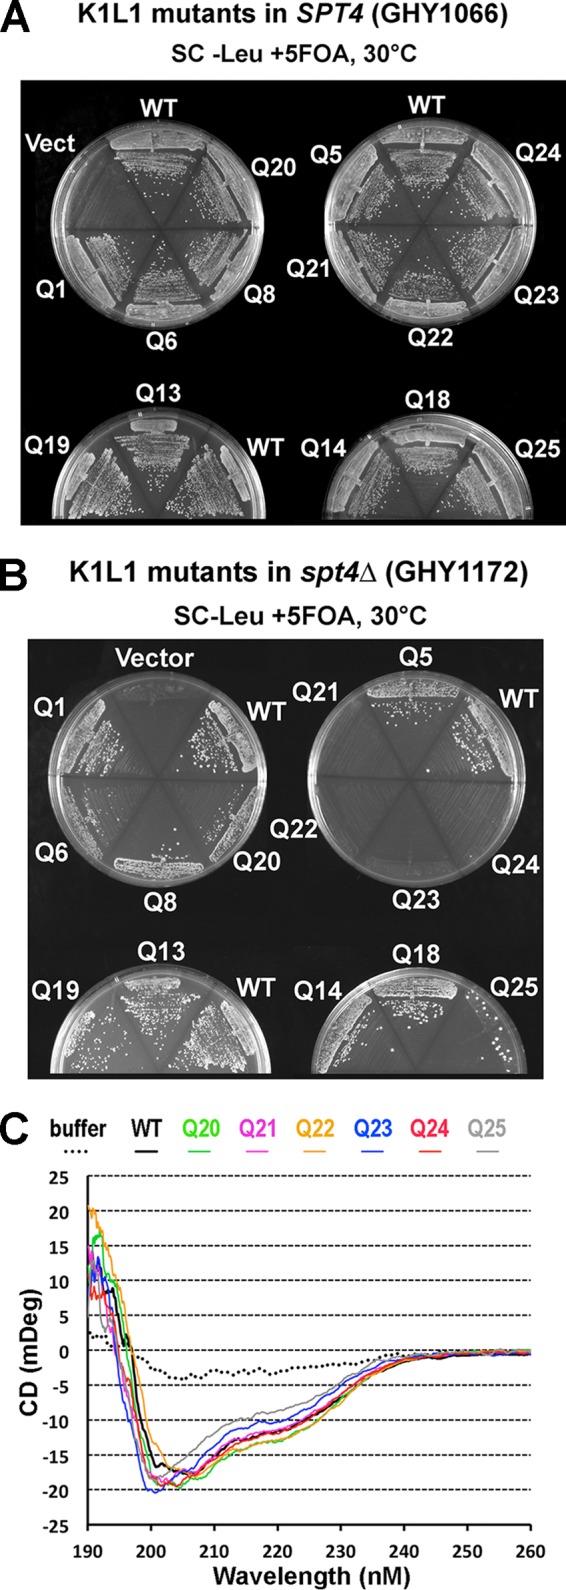
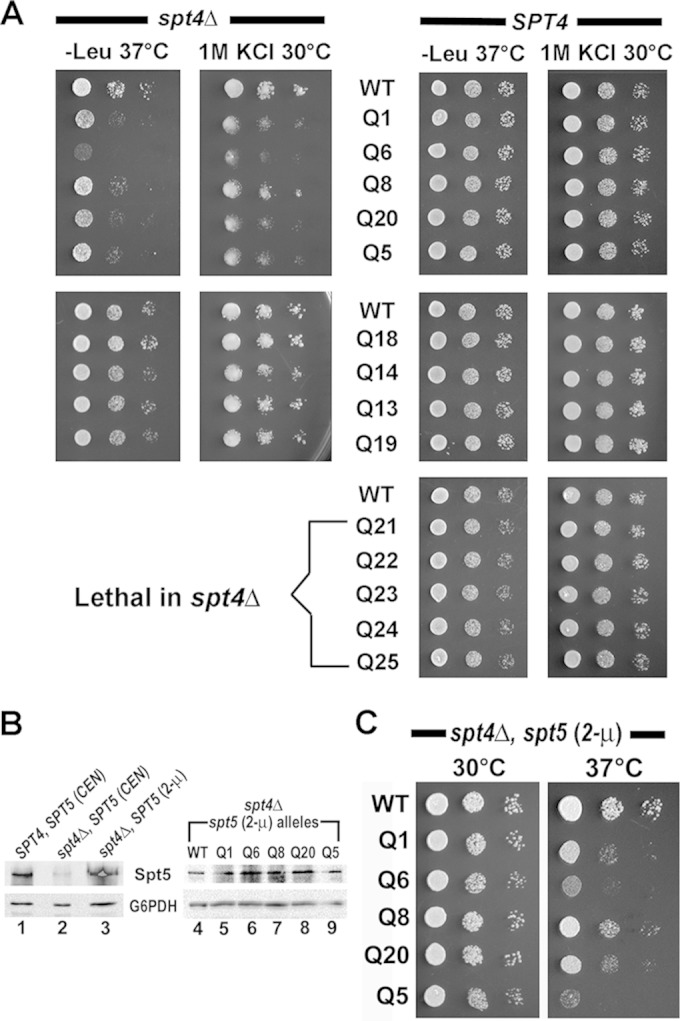
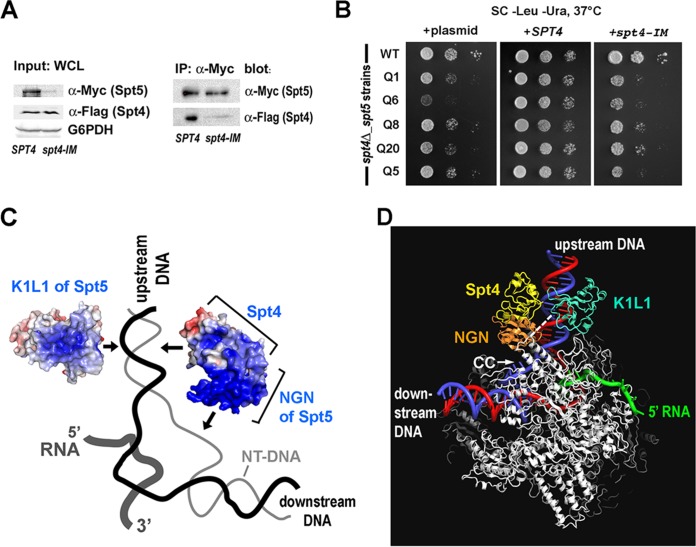
The eukaryotic Spt4-Spt5 heterodimer forms a higher-order complex with RNA polymerase II (and I) to regulate transcription elongation. Extensive genetic and functional data have revealed diverse roles of Spt4-Spt5 in coupling elongation with chromatin modification and RNA-processing pathways. A mechanistic understanding of the diverse functions of Spt4-Spt5 is hampered by challenges in resolving the distribution of functions among its structural domains, including the five KOW domains in Spt5, and a lack of their high-resolution structures. We present high-resolution crystallographic results demonstrating that distinct structures are formed by the first through third KOW domains (KOW1-Linker1 [K1L1] and KOW2-KOW3) of Saccharomyces cerevisiae Spt5. The structure reveals that K1L1 displays a positively charged patch (PCP) on its surface, which binds nucleic acids in vitro, as shown in biochemical assays, and is important for in vivo function, as shown in growth assays. Furthermore, assays in yeast have shown that the PCP has a function that partially overlaps that of Spt4. Synthesis of our results with previous evidence suggests a model in which Spt4 and the K1L1 domain of Spt5 form functionally overlapping interactions with nucleic acids upstream of the transcription bubble, and this mechanism may confer robustness on processes associated with transcription elongation.


Figures

FIG 1
FIG 1
Structure of K1L1 and domain organization of Spt5. (A) The crystal structure of K1L1 comprises a Tudor domain barrel encompassing most of the KOW region and an insertion domain with a novel fold formed mainly from the Linker1 region. The N and C termini of K1L1 correspond to L382 and F508, respectively. A disordered region (I428 to R438) is found between the indicated residues E427 and R439. (B) Secondary-structure diagram drawn from the K1L1 structure and colored similarly to panel A. α-Helices are shown as cylinders, β-strands as block arrows, and loops as solid lines. (C) Updated KOW1 consensus sequence modified from the previous KOW1 consensus shown in Fig. S2B in the supplemental material. L1 is marked at its inserted position within K1. (D) Updated Spt5 domain organization with the K1L1 region delineated according to the crystal structure, modified from Fig. S2A in the supplemental material.
FIG 2
FIG 2
K1L1 forms a rigid-body structure with a flexible segment. (A) An extensive interface between the KOW1-Tudor and Linker1 lobes. Hydrogen bonds between K1 and L1 residues are shown with yellow dashed lines, a cation-π electron interaction is shown with white dashes, and van der Waals interactions are not shown. The interface buries a total of 1,145 Å2 of solvent-accessible surface. (B) Conservation of hydrogen bond-forming residues (boxed) in the interface. Secondary-structural elements are shown above the multiple aligned eukaryotic sequences, and the interdomain hydrogen bonds are indicated with gray lines. Basic, blue; acidic, red; polar, pink; hydrophobic, gray and black. (C) The K1L1 electron density at 1.09 Å (2Fo-Fc omit map contoured at 1.0 σ [green mesh; Fo, observed structure factor amplitudes; Fc, calculated structure factor amplitudes; omit map, model-omitted electron density map; σ, standard deviation of electron density]) is of high quality. Shown is a stereo plot of a slab through the middle of the structure. The K1L1 model is colored by atom type, and neighboring molecules in the crystal lattice are colored gray. Atomic features, such as phenol rings and carbonyl groups (red), are resolved.
FIG 3
FIG 3
The KOW2 and KOW3 domains form a rigid-body structure of tandem Tudor barrels. (A) Ribbon models of K2 and K3, with the secondary-structural elements labeled in white. A single residue (I583) links the two domains. (B) Surface representation showing that K2 and K3 interact intimately to bury 541 Å2 of solvent-accessible surface. (C) Stereo plot of a central slab of the K2K3 electron density at 1.6 Å (2Fo-Fc omit map at 1.0 σ [green mesh]). The model is colored by atom type, and lattice-packing neighbors are shown in gray.
FIG 4
FIG 4
The tandem organization of K2K3 structure is conserved in eukaryotic Spt5. (A) Superposition of human K2 (PDB ID 2e6z) and K3 (2do3) with the yeast K2K3 model. (B) Sequence conservation of the hydrogen-bonded residues (boxed) between K2 and K3. The interdomain hydrogen bonds are indicated, and secondary elements are marked above the aligned sequences.
FIG 5
FIG 5
Differential DNA binding by the different KOW domains of Spt5. (A) SDS-PAGE analysis of purified recombinant KOW proteins (labeled above the lanes) with Coomassie blue staining. (B) ssDNA and dsDNA of a randomly chosen sequence used as a binding substrate for the Spt5 proteins. The DNAs were 5′ labeled with TAMRA (IDT). (C and D) Gel mobility shift assays to test the different Spt5 domains in binding ssDNA and dsDNA, respectively. Each binding reaction mixture contained 5 μM DNA probe, 50 μM the indicated Spt5 domain, and the buffer. The gels were stained with ethidium bromide and imaged with UV light. The positions of the free probe and bound complex are indicated on the left of the gels. In addition to binding by K1L1, note the disappearance of free probes due to L3K5 and the slower-migrating smear above the ssDNA and dsDNA bands in the L3K5 lanes, which may suggest low-affinity binding to ssDNA and dsDNA. Bands of the binding complex appeared persistently smeared, indicating heterogeneity in the binding stoichiometry due to the length of DNAs and/or partial dissociation of complexes during gel migration, and were also nonuniform due to adherence to the gel matrix (8% polyacrylamide with 0.2% agarose [see Materials and Methods]) of the loading wells.
FIG 6
FIG 6
Interactions of recombinant Spt5 domains with various forms of NA. (A) Sequences of the single-stranded and double-stranded NAs. The 5′ end of a single strand and the top strand of a double strand were synthesized (IDT) with a TAMRA fluorescent group for detection. (B) Gel shift images from the binding assays. The reaction mixtures each contained 5 μM NA probe, 80 μM protein domain, and the buffer. A name of an NA form (bottom left side) indicates a free probe, while the label “bound” indicates a species of protein-NA complex. The protein domain used in a binding reaction is identified above the gels. (C) Direct comparison between two forms of NA for K1L1 binding in the same binding mixture. NA forms (5 μM) are indicated (bottom left side), and protein concentrations varied from 0 to 80 μM, as indicated. Binding curves for the NA forms are shown below the gels, with each data point averaged from multiple experiments (see Materials and Methods). The error bars indicate mean errors. (D) Binding competition of unlabeled dsDNAs of the same length but different sequences. Gel bands of the unbound 20-mer probe and bound species are indicated, and the probe and protein concentrations are given at the top.
FIG 7
FIG 7
The in vitro NA-binding activity of K1L1 is mediated by its PCP. (A) (Left) The solvent-accessible surface of K1L1 is colored blue (+6 kT) to red (−6 kT) to show the electrostatic potential. (Right) The basic residues forming the PCP in K1L1 are shown in blue, and residues that are not in the center of the PCP (T441, F442, and R458) or are neutral (H492) are shown in orange. The disordered region is represented by dashes, with its sequence shown on the left. (B) Identification of the PCP and cassette mutations. (C and D) Gel shift assay showing losses of NA binding due to mutations of basic residues in the PCP. Each binding reaction mixture consisted of 5 μM probe, 22 μM a K1L1 protein variant, and the buffer. Free and bound NA species are indicated on the left, and K1L1 proteins are identified at the top with their mutation identifiers given at the bottom. The smeared appearance of bound complex bands is explained in the legend to Fig. 5.
FIG 8
FIG 8
The PCP of Spt5 is important for in vivo function. (A) Growth of yeast strains following plasmid shuffle in the SPT4 background. (B) Growth in the spt4Δ background. Note that Q25 promoted the emergence of rare suppressor-like colonies. (C) Far-UV CD spectra taken from purified mutant K1L1 proteins of the WT and Q20 through Q25 (with the color code indicated).
FIG 9
FIG 9
Functional overlap between Spt4 and the K1L1 domain of Spt5. (A) PCP mutations that cause losses of NA binding in vitro display Ts and Osm growth defects in the spt4Δ strain (left) but no defects in the SPT4 strain (right). Tenfold serial dilutions were spotted on SC−Leu plates and SC plates with 1.0 M KCl and incubated at the indicated temperatures. (B) Western blot showing cellular levels of Spt5 variants, with the anti-G6PDH blot serving as the loading control. Cell strains, the type of spt5-carrying plasmid (CEN or 2μ), and spt5 alleles are indicated at the top. (C) Overexpression of Spt5 does not affect the Ts defects associated with the PCP mutants. Growth of spt4Δ spt5-PCP (2μ) strains at 30° and 37°C on a solid medium (SC−Ura plus raffinose plus galactose) that is inductive for the spt5 alleles driven by the GAL10 promoter (see Materials and Methods).
FIG 10
FIG 10
Functional overlap between Spt4 and the K1L1 domain of Spt5 suggests iterated NA interactions located upstream of the transcription bubble. (A) The spt4-IM mutation (S58D_V60E) disrupts the recruitment of Spt4 to Spt5 in the cell. WCLs were made from the spt4Δ SPT5 strain transformed with pRS416-Flag-SPT4 or pRS416-Flag-spt4-IM. Protein levels (Input) were detected using Western blotting against the Myc tag on Spt5 and the Flag tag on Spt4, and anti-G6PDH served as a loading control. Spt5 was immunoprecipitated (IP) via the Myc tag borne by the pRS415 3Myc-SPT5 plasmid. (B) Masking of the spt5-PCP Ts phenotype by SPT4 requires an intact interface between Spt4 and the NGN domain of Spt5. The spt4Δ spt5-PCP mutant strains were transformed with pRS416 (URA3) alone (left), pRS416-Flag-SPT4 (middle), or pRS416-Flag-spt4-IM (right) and assayed for growth at 37°C on SC−Leu−Ura plates. (C) Mechanistic model showing interactions with the NAs (including DNA) upstream of the transcription bubble that are proposed to be shared between Spt4 and the K1L1 domain of Spt5. Electrostatic surfaces of the yeast K1L1 domain and the Spt4-NGN complex are shown relative to the NAs engaged in RNAP II. Blue, positively charged; red, negatively charged; black line, template DNA strand; thin gray line, nontemplate strand; thick gray line, RNA transcript. The arrows indicate the approximate locations of the proposed protein-DNA interactions. (D) Hypothetical three-dimensional model for the yeast holo-elongation complex, viewed from the back of panel C. The model highlights a potential location of the K1L1 domain relative to the RNAP (silver), the NGN domain, Spt4, and the upstream DNA (blue and red). A connector of 6 amino acids between NGN and K1L1 is indicated by the white dashes. The model was built on the basis of the semicrystallographic model of archaeal RNAP (26) and also incorporated the K1L1 placement suggested from the EM structure (34). Note that the location of NGN is the same as in the schematic model of Li et al. (11), and the K1L1 location is in a general agreement with that proposed in Li's model. CC, coiled-coil structural element of the Clamp module.

References

    1. Thomas MC, Chiang CM. 2006. The general transcription machinery and general cofactors. Crit Rev Biochem Mol Biol 41:105–178. doi:10.1080/10409230600648736. - DOI - PubMed
    1. Perales R, Bentley D. 2009. “Cotranscriptionality”: the transcription elongation complex as a nexus for nuclear transactions. Mol Cell 36:178–191. doi:10.1016/j.molcel.2009.09.018. - DOI - PMC - PubMed
    1. Hsin JP, Manley JL. 2012. The RNA polymerase II CTD coordinates transcription and RNA processing. Genes Dev 26:2119–2137. doi:10.1101/gad.200303.112. - DOI - PMC - PubMed
    1. Rondon AG, Jimeno S, Aguilera A. 2010. The interface between transcription and mRNP export: from THO to THSC/TREX-2. Biochim Biophys Acta 1799:533–538. doi:10.1016/j.bbagrm.2010.06.002. - DOI - PubMed
    1. Hartzog GA, Fu J. 2013. The Spt4-Spt5 complex: a multi-faceted regulator of transcription elongation. Biochim Biophys Acta 1829:105–115. doi:10.1016/j.bbagrm.2012.08.007. - DOI - PMC - PubMed

Publication types

MeSH terms

Substances