. 2015 Jul 7:9:251.
doi: 10.3389/fncel.2015.00251. eCollection 2015.

Active mechanistic target of rapamycin plays an ancillary rather than essential role in zebrafish CNS axon regeneration

Affiliations

Active mechanistic target of rapamycin plays an ancillary rather than essential role in zebrafish CNS axon regeneration

Heike Diekmann et al. Front Cell Neurosci. .

Abstract

The developmental decrease of the intrinsic regenerative ability of the mammalian central nervous system (CNS) is associated with reduced activity of mechanistic target of rapamycin (mTOR) in mature neurons such as retinal ganglion cells (RGCs). While mTOR activity is further decreased upon axonal injury, maintenance of its pre-injury level, for instance by genetic deletion of the phosphatase and tensin homolog (PTEN), markedly promotes axon regeneration in mammals. The current study now addressed the question whether active mTOR might generally play a central role in axon regeneration by analyzing its requirement in regeneration-competent zebrafish. Remarkably, regulation of mTOR activity after optic nerve injury in zebrafish is fundamentally different compared to mammals. Hardly any activity was detected in naïve RGCs, whereas it was markedly increased upon axotomy in vivo as well as in dissociated cell cultures. After a short burst, mTOR activity was quickly attenuated, which is contrary to the requirements for axon regeneration in mammals. Surprisingly, mTOR activity was not essential for axonal growth per se, but correlated with cytokine- and PTEN inhibitor-induced neurite extension in vitro. Moreover, inhibition of mTOR using rapamycin significantly reduced axon regeneration in vivo and compromised functional recovery after optic nerve injury. Therefore, axotomy-induced mTOR activity is involved in CNS axon regeneration in zebrafish similar to mammals, although it plays an ancillary rather than essential role in this regeneration-competent species.

Keywords: mTOR; optic nerve regeneration; pS6; rapamycin; zebrafish.


Figures
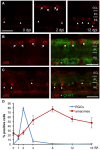
Figure 1
Figure 1
Retinal mTOR activation upon optic nerve injury. (A) Immunohistochemistry of phosphorylated S6 (pS6) on retinal cross sections at 0, 2 and 12 days post injury (dpi) indicates induction of mTOR activity in the ganglion cell (GCL, arrows) and inner nuclear (INL, arrowheads) layers after optic nerve axotomy. (B) Co-immunostaining of a retinal cross section (2 dpi) with pS6 (red) and acetylated tubulin (green) antibodies identifies pS6-positive cells as retinal ganglion cells (RGCs; arrows). (C) Co-immunostaining of a retinal cross section (0 dpi) with pS6 (red) and choline acetyl transferase (CHAT, green) antibodies identifies cholinergic amacrine cells (arrowheads). (D) Time course of pS6-positive RGCs (blue) and amacrines (red) after optic nerve crush. Data represent means ± SEM of two independent experiments. GCL = ganglion cell layer; IPL = inner plexiform layer; INL = inner nuclear layer. Scale bar = 25 μm.
Figure 2
Figure 2
Induction of mTOR activity in cultured RGCs. (A) Quantification of the percentage of retinal ganglion cells (RGCs) positive for phosphorylated S6 (pS6) at 2 and 6 hours (h) as well as 1, 2 and 4 days (d) in culture with or without ciliary neurotrophic factor (CNTF; 1 ng/ml) treatment. Data represent means ± SEM of three independent experiments, each with three repeats. Treatment effects: p < 0.001. (B) Representative pictures of cultured RGCs stained with pS6 (red) and acetylated tubulin (green) antibodies at 6 h in culture. Cells were either treated with vehicle (con), CNTF (1 ng/ml) or CNTF + rapamycin (Rap; 10 nM). Scale bar = 50 μm. (C) Percentage of pS6-positive RGCs at 6 h in culture after treatment with either vehicle (−), rapamycin (Rap; 10 nM), PTEN inhibitor bisperoxovanadium (bpV(phen); 10 nM), or bpV(phen) + Rap. Data represent means ± SEM of at least two independent experiments, each with three repeats. Treatment effects: p < 0.001.
Figure 3
Figure 3
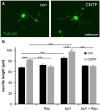
Correlation of mTOR activity with CNTF- and PTEN inhibitor-induced neurite growth of cultured RGCs. (A) Representative pictures of cultured retinal ganglion cells (RGCs) stained with acetylated tubulin antibody at 4 days in culture and exposure to vehicle (con) and ciliary neurotrophic factor (CNTF, 1 ng/ml), respectively. Scale bar = 50 μm. (B) Quantification of average RGC neurite length at 4 days in culture after treatment with either vehicle control (−), rapamycin (Rap; 10 nM), PTEN inhibitor bpV(phen) (10 nM), or bpV(phen) + Rap. Data represent means ± SEM of at least two independent experiments, each with three repeats. Treatment effects: p < 0.001.
Figure 4
Figure 4
Efficient inhibition of mTOR activity in zebrafish in vivo. (A, B, B′) Immunostaining of retinal cross sections with phosphorylated S6 (pS6, red) and acetylated tubulin (green) antibodies at 2 days post injury. Fish were either treated with DMSO (A) or 0.2 μM rapamycin (Rap, B) prior to tissue preparation. Rapamycin treatment abrogated pS6 staining in retinal ganglion cells (RGCs; arrows). (C,D,D′) Immunostaining of retinal cross sections with pS6 (red) and choline acetyl transferase (CHAT; green) antibodies at 6 days post injury. Fish were either treated with DMSO (C) or 0.2 μM rapamycin (Rap, D) prior to tissue preparation. Rapamycin treatment abolished pS6 staining in amacrines (arrowheads). GCL = ganglion cell layer; IPL = inner plexiform layer; INL = inner nuclear layer; Scale bar = 25 μm.
Figure 5
Figure 5
Compromised axon regeneration and functional recovery upon mTOR inhibition. (A,B) Maximum intensity projections (85 × 0.9 μm confocal z-sections) of wholemount optic nerves from DMSO- (A) and 0.2 μM rapamycin (Rap, B) -treated GAP43::GFP zebrafish at 2.5 days post injury (dpi). The lesion site is indicated with a dashed line, proximal is to the left. Scale bar = 200 μm. (A′,B′) Higher magnifications of the boxed areas in (A) and (B), respectively, using maximum intensity projections of 10 × 0.9 μm confocal stacks. Scale bar = 50 μm. (C) Quantification of axon profiles per mm optic nerve diameter on single z-sections at 200 and 500 μm posterior to the lesion site of DMSO- and rapamycin-treated zebrafish, respectively (for details see “Materials and Methods” Section). Data represent means ± SEM of 8 optic nerves from two independent experiments. Treatment effects compared to DMSO control: ***p < 0.001; *p < 0.05 (D) Quantitative real-time PCR for green fluorescent protein (gfp) and growth associated protein 43 (gap43) in relation to glyceraldehyde-3-phosphate dehydrogenase (gapdh) in retinae isolated from zebrafish 2 days post injury that were treated either with vehicle (DMSO) or 0.2 μM rapamycin (Rap), respectively. Data represent mean ΔΔCt ± SEM of at least three different fish per experimental group. ns = non-significant (E) Representative pictures of the swimming position of a naïve zebrafish and a fish 1 day post unilateral right optic nerve crush (1 dpi), respectively. (F) Quantification of the oblique swimming position of DMSO (blue)- and rapamycin (Rap; red)-treated zebrafish at 1, 4, 11, 13, 14 and 18 days post injury (dpi). In addition, some zebrafish received rapamycin-treatment only during the first 3 days of the experiment (RD; brown). Another group was initially held in DMSO (0–3 dpi) and then transferred to rapamycin for the remainder of the experiment (DR; green). Data represent means ± SEM of at least five zebrafish per group. Treatment effects compared to DMSO control: ***p < 0.001; **p < 0.01.
Figure 6
Figure 6
Schematic showing the ancillary contribution of mTOR activity to axon regeneration in adult zebrafish. (A) Upon optic nerve injury, diverse and prevalently unknown molecular mechanisms (gray arrow) are activated in adult zebrafish RGCs to enable axon growth and functional regeneration. Among others, cytokines such as LIF are released and activate the JAK/STAT and PI3K/AKT/mTOR pathways that contribute to axon regeneration. The initial burst of mTOR activity could then be quickly attenuated by negative feedback loops (red lines). (B) Inhibition of mTOR using rapamycin only partially reduces axon regrowth and compromises functional recovery, suggesting an ancillary rather than essential role of mTOR activity in zebrafish optic nerve regeneration.

References

    1. Abe N., Borson S. H., Gambello M. J., Wang F., Cavalli V. (2010). Mammalian target of rapamycin (mTOR) activation increases axonal growth capacity of injured peripheral nerves. J. Biol. Chem. 285, 28034–28043. 10.1074/jbc.M110.125336 - DOI - PMC - PubMed
    1. Becker C. G., Becker T. (2007). Growth and pathfinding of regenerating axons in the optic projection of adult fish. J. Neurosci. Res. 85, 2793–2799. 10.1002/jnr.21121 - DOI - PubMed
    1. Bernhardt R. R., Tongiorgi E., Anzini P., Schachner M. (1996). Increased expression of specific recognition molecules by retinal ganglion cells and by optic pathway glia accompanies the successful regeneration of retinal axons in adult zebrafish. J. Comp. Neurol. 376, 253–264. 10.1002/(sici)1096-9861(19961209)376:2<253::aid-cne7>3.0.co;2-2 - DOI - PubMed
    1. Bernhardt R. R. (1999). Cellular and molecular bases of axonal regeneration in the fish central nervous system. Exp. Neurol. 157, 223–240. 10.1006/exnr.1999.7059 - DOI - PubMed
    1. Bormann P., Roth L. W., Andel D., Ackermann M., Reinhard E. (1999). zfNLRR, a novel leucine-rich repeat protein is preferentially expressed during regeneration in zebrafish. Mol. Cell. Neurosci. 13, 167–179. 10.1006/mcne.1999.0742 - DOI - PubMed

LinkOut - more resources