. 2015 Jul 6:9:86.
doi: 10.3389/fncom.2015.00086. eCollection 2015.

Conduction block in myelinated axons induced by high-frequency (kHz) non-symmetric biphasic stimulation

Affiliations

Conduction block in myelinated axons induced by high-frequency (kHz) non-symmetric biphasic stimulation

Shouguo Zhao et al. Front Comput Neurosci. .

Abstract

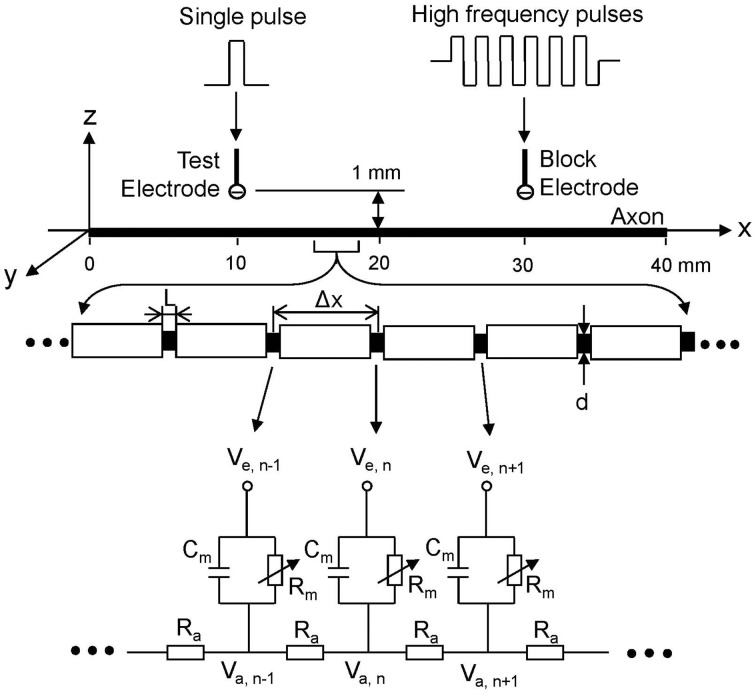
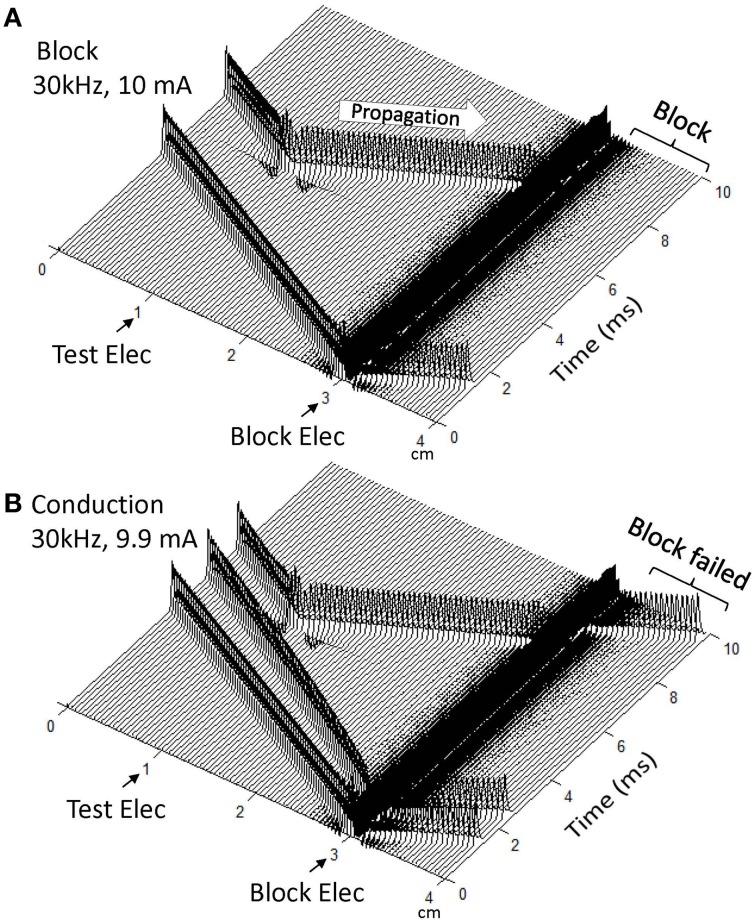
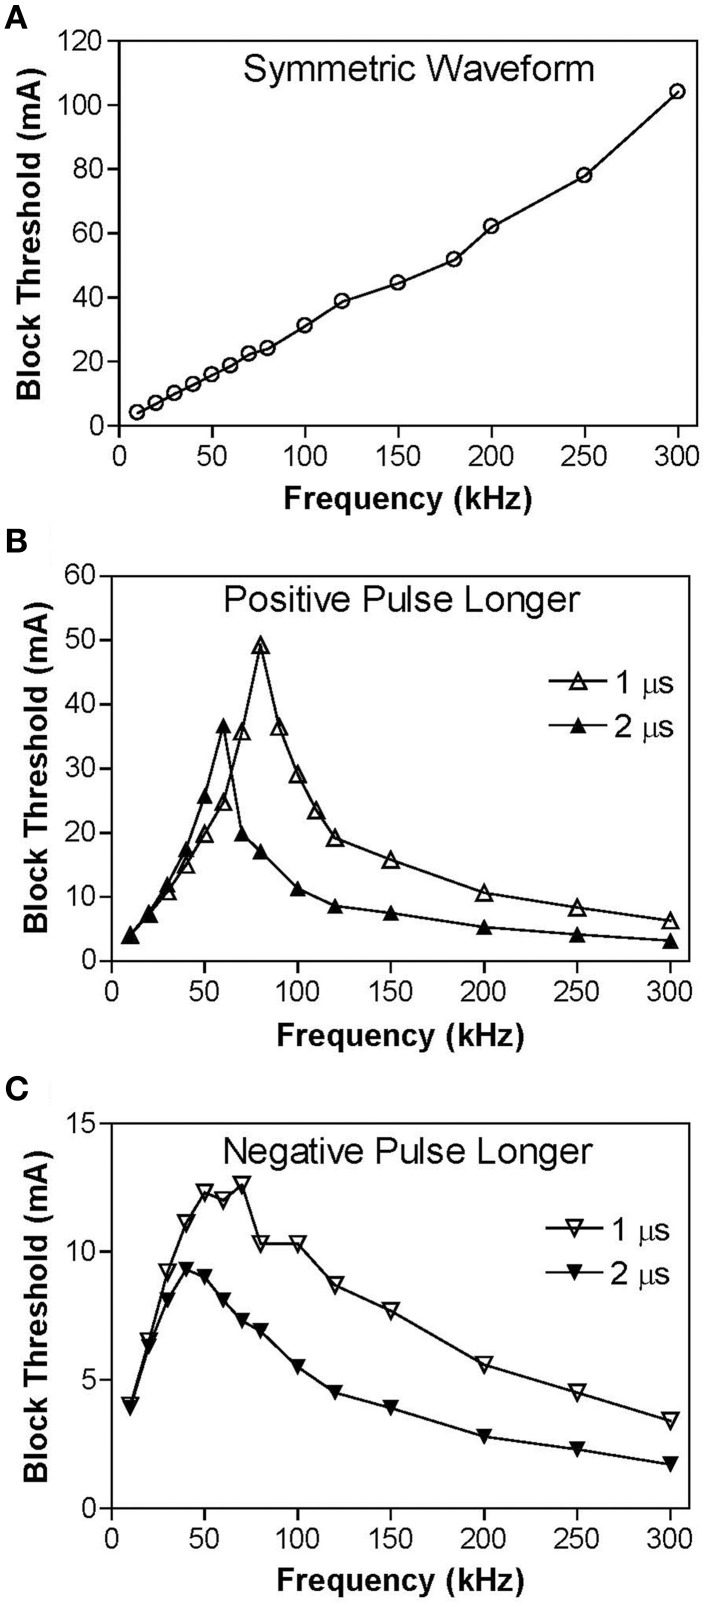
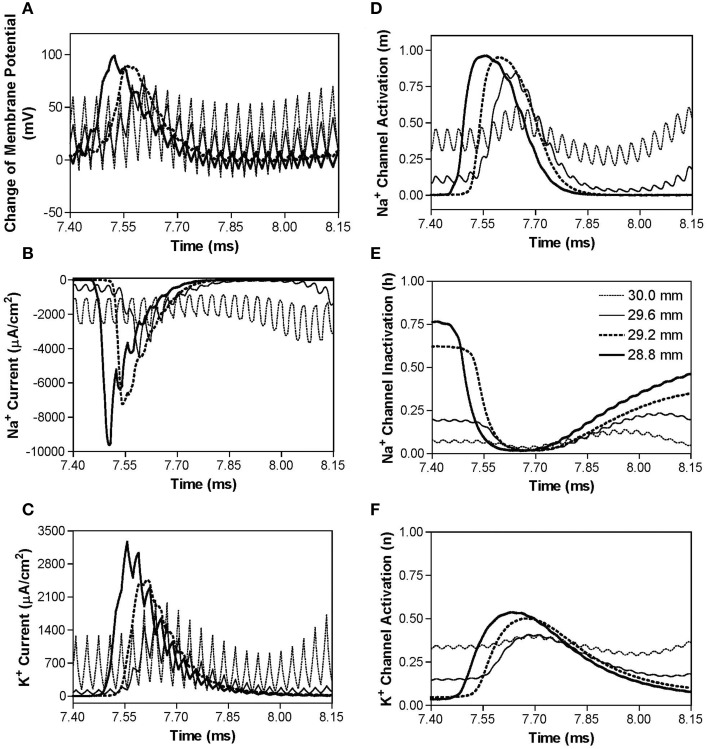
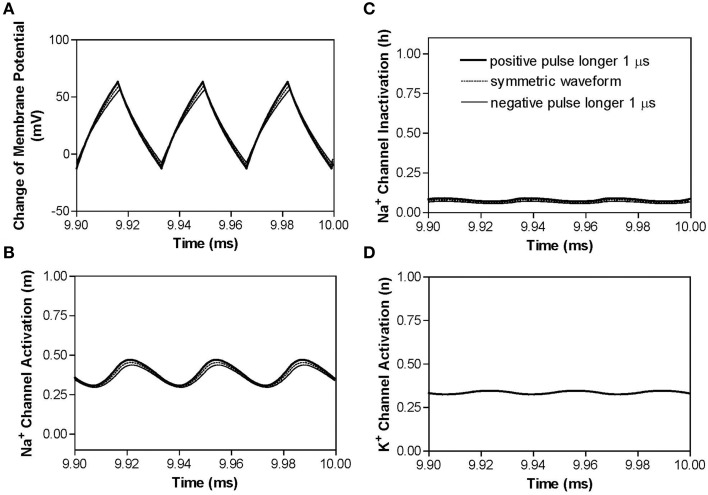
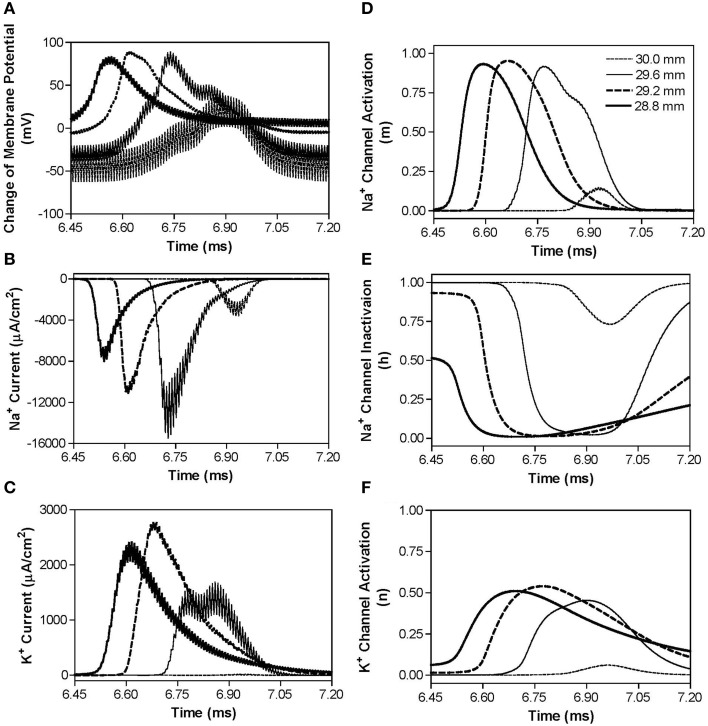
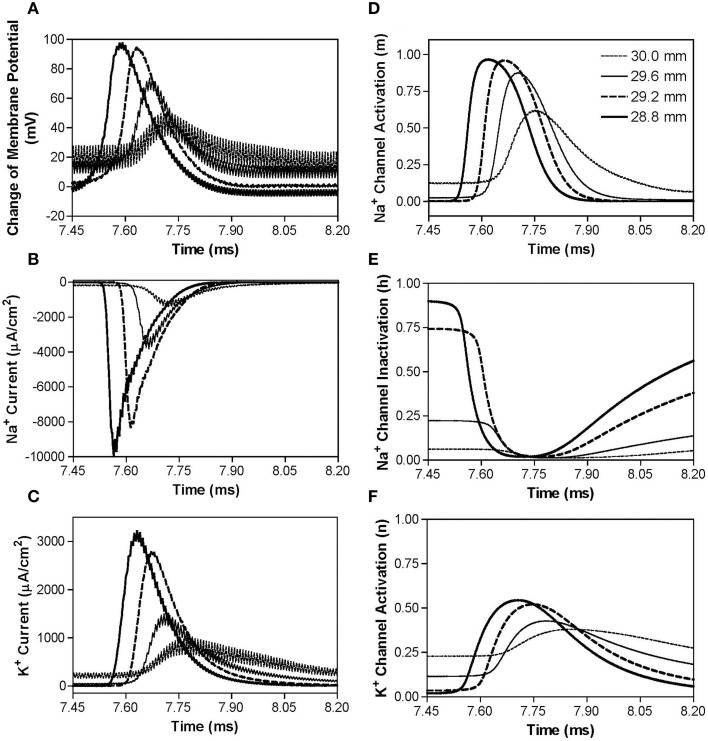
This study used the Frankenhaeuser-Huxley axonal model to analyze the effects of non-symmetric waveforms on conduction block of myelinated axons induced by high-frequency (10-300 kHz) biphasic electrical stimulation. The results predict a monotonic relationship between block threshold and stimulation frequency for symmetric waveform and a non-monotonic relationship for non-symmetric waveforms. The symmetric waveform causes conduction block by constantly activating both sodium and potassium channels at frequencies of 20-300 kHz, while the non-symmetric waveforms share the same blocking mechanism from 20 kHz up to the peak threshold frequency. At the frequencies above the peak threshold frequency the non-symmetric waveforms block axonal conduction by either hyperpolarizing the membrane (if the positive pulse is longer) or depolarizing the membrane (if the negative pulse is longer). This simulation study further increases our understanding of conduction block in myelinated axons induced by high-frequency biphasic electrical stimulation, and can guide future animal experiments as well as optimize stimulation parameters that might be used for electrically induced nerve block in clinical applications.

Keywords: block; high-frequency; model; nerve; simulation.


Figures

Figure 1
Figure 1
Myelinated axonal model used to simulate conduction block induced by high-frequency biphasic electrical current. The inter-node length Δx = 100 d; d is the axon diameter. L is the nodal length. Each node is modeled by a resistance-capacitance circuit based on the FH model. Ra, inter-nodal axoplasmic resistance; Rm, nodal membrane resistance; Cm, nodal membrane capacitance; Va,n, intracellular potential at the nth node; Ve,n, extracellular potential at the nth node.
Figure 2
Figure 2
Blocking the propagation of action potentials along a myelinated axon by high-frequency symmetric biphasic stimulation. High-frequency (30 kHz) stimulation is continuously delivered at the block electrode, which initiated an initial action potential in (A) and two initial action potentials in (B). Another action potential is initiated via the test electrode at 5 ms after starting the high-frequency stimulation, and propagates toward both ends of the axon. The 30 kHz stimulation blocks nerve conduction at the intensity of 10 mA (A), but not at 9.9 mA (B). Both symmetric and non-symmetric waveforms induced initial action potentials and axonal conduction block, which are dependent on stimulation frequency and intensity as shown previously [33]. The short arrows mark the locations of test and block electrodes along the axon. The white arrow indicates propagation of the action potential to the location of the 30 kHz blocking stimulation. Axon diameter: 2 μm.
Figure 3
Figure 3
The threshold intensity to block nerve conduction changes with the stimulation frequency. (A) For the symmetric waveform, the block threshold monotonically increases as the frequency increases. (B) If the positive pulse is longer (1 or 2 μs), the block threshold peaks at 60–80 kHz and then gradually decreases as the frequency increases. (C) If the negative pulse is longer (1 or 2 μs), the block threshold peaks at 40–70 kHz. Axon diameter: 2 μm.
Figure 4
Figure 4
The changes in membrane potential, ionic currents, and activation/inactivation of ion channels near the block electrode when conduction block occurs as shown in Figure 2A during stimulation with a symmetric waveform. The legends in (E) indicate the locations along the axon. The location at 30.0 mm is under the block electrode. (A) Change in membrane potential, (B) Na+ current, (C) K+ current, (D) Na+ channel activation, (E) Na+ channel inactivation, (F) K+ channel activation. Symmetric stimulation waveform: 30 kHz, 10 mA. Axon diameter: 2 μm. Abscissa: time in ms after the start of blocking stimulation.
Figure 5
Figure 5
The effects of non-symmetric waveforms on membrane potential and activation/inactivation of ion channels under the block electrode when stimulation frequency is 30 kHz. The legends in (C) indicate the types of waveforms: symmetric and non-symmetric with a 1 μs difference in pulse width between the positive and negative pulses. (A) Change of membrane potential, (B) Na+ channel activation, (C) Na+ channel inactivation, (D) K+ channel activation. Stimulation waveforms: 30 kHz at block threshold intensities. Axon diameter: 2 μm. Abscissa: time in ms after the start of blocking stimulation.
Figure 6
Figure 6
The changes in membrane potential, ionic currents, and activation/inactivation of ion channels near the block electrode when conduction block is induced by a 120 kHz non-symmetric waveform with the positive pulse 1 μs longer than the negative pulse. The legends in (D) indicate the locations along the axon. The location at 30.0 mm is under the block electrode. (A) Change in membrane potential, (B) Na+ current, (C) K+ current, (D) Na+ channel activation, (E) Na+ channel inactivation, (F) K+ channel activation. Non-symmetric stimulation waveform: 120 kHz, 19.2 mA. Axon diameter: 2 μm. Abscissa: time in ms after the start of blocking stimulation.
Figure 7
Figure 7
The changes in membrane potential, ionic currents, and activation/inactivation of ion channels near the block electrode when conduction block is induced by a 120 kHz non-symmetric waveform with the negative pulse 1 μs longer than the positive pulse. The legends in (D) indicate the locations along the axon. The location at 30.0 mm is under the block electrode. (A) Change in membrane potential, (B) Na+ current, (C) K+ current, (D) Na+ channel activation, (E) Na+ channel inactivation, (F) K+ channel activation. Non-symmetric stimulation waveform: 120 kHz, 8.7 mA. Axon diameter: 2 μm. Abscissa: time in ms after the start of blocking stimulation.

Similar articles

Cited by

References

    1. Ackermann D. M., Bhadra N., Gerges M., Thomas P. J. (2011). Dynamics and sensitivity analysis of high-frequency conduction block. J. Neural Eng. 8, 1–14. 10.1088/1741-2560/8/6/065007 - DOI - PMC - PubMed
    1. Bhadra N., Kilgore K. (2005). High-frequency electrical conduction block of mammalian peripheral motor nerve. Muscle Nerve 32, 782–790. 10.1002/mus.20428 - DOI - PubMed
    1. Bhadra N., Lahowetz E., Foldes S., Kilgore K. (2007). Simulation of high-frequency sinusoidal electrical block of mammalian myelinated axons. J. Comput. Neurosci. 22, 313–326. 10.1007/s10827-006-0015-5 - DOI - PubMed
    1. Bowman B. R., McNeal D. R. (1986). Response of single alpha motoneurons to high-frequency pulse train: firing behavior and conduction block phenomenon. Appl. Neurophysiol. 49, 121–138. 10.1159/000100137 - DOI - PubMed
    1. Boyce W. E., Diprima R. C. (1997). Elementary Differential Equations and Boundary Value Problems, 6th Edn. Hoboken, NJ: John Wiley & Sons, Inc.