

Mild Cognitive Impairment: Structural, Metabolical, and Neurophysiological Evidence of a Novel EEG Biomarker
- PMID: 26217299
- PMCID: PMC4491619
- DOI: 10.3389/fneur.2015.00152
Mild Cognitive Impairment: Structural, Metabolical, and Neurophysiological Evidence of a Novel EEG Biomarker
Abstract
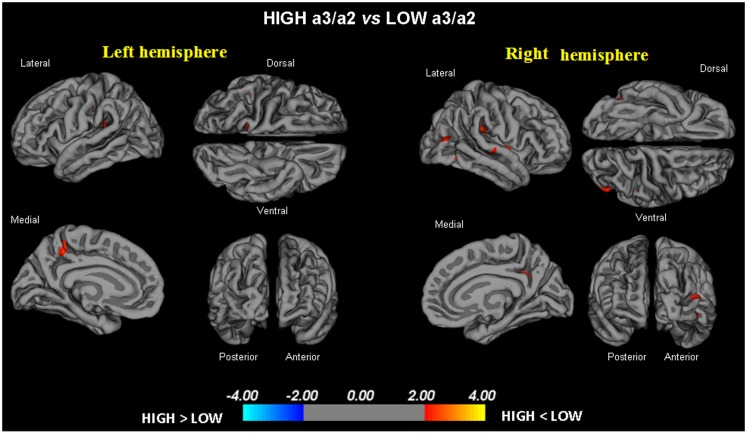
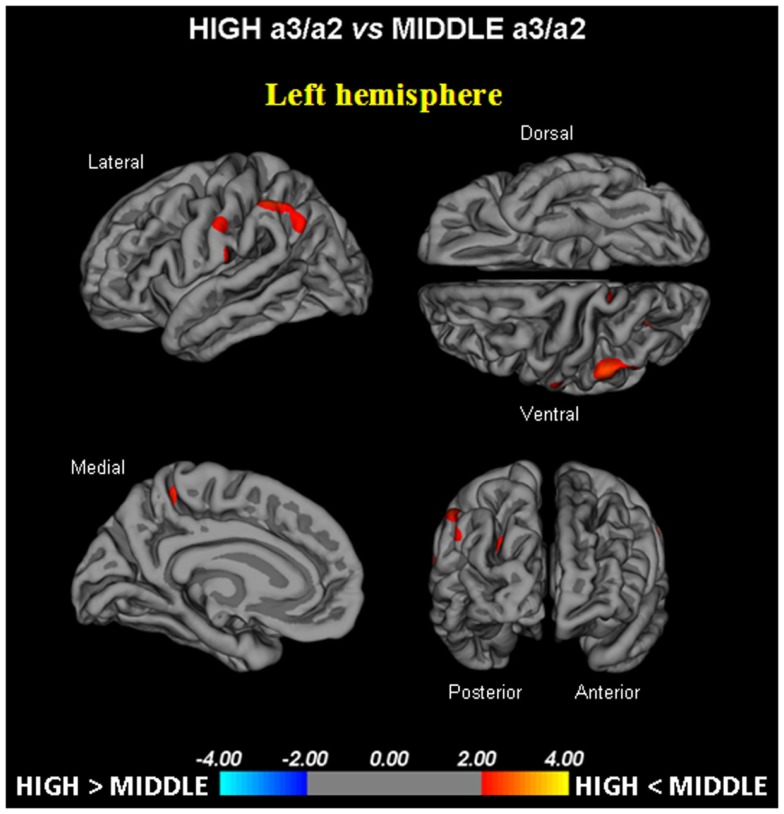
Background: Recent studies demonstrate that the alpha3/alpha2 power ratio correlates with cortical atrophy, regional hypoperfusion, and memory impairment in subjects with mild cognitive impairment (MCI).
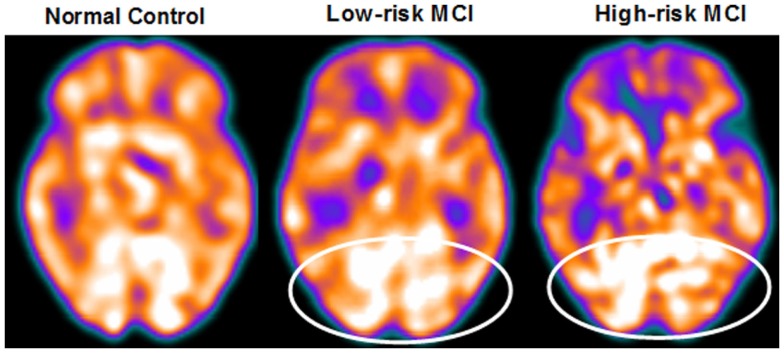
Methods: Evidences were reviewed in subjects with MCI, who underwent EEG recording, magnetic resonance imaging (MRI) scans, and memory evaluation. Alpha3/alpha2 power ratio (alpha2 8.9-10.9 Hz range; alpha3 10.9-12.9 Hz range), cortical thickness, linear EEG coherence, and memory impairment have been evaluated in a large group of 74 patients. A subset of 27 subjects within the same group also underwent single photon emission computed tomography (SPECT) evaluation.
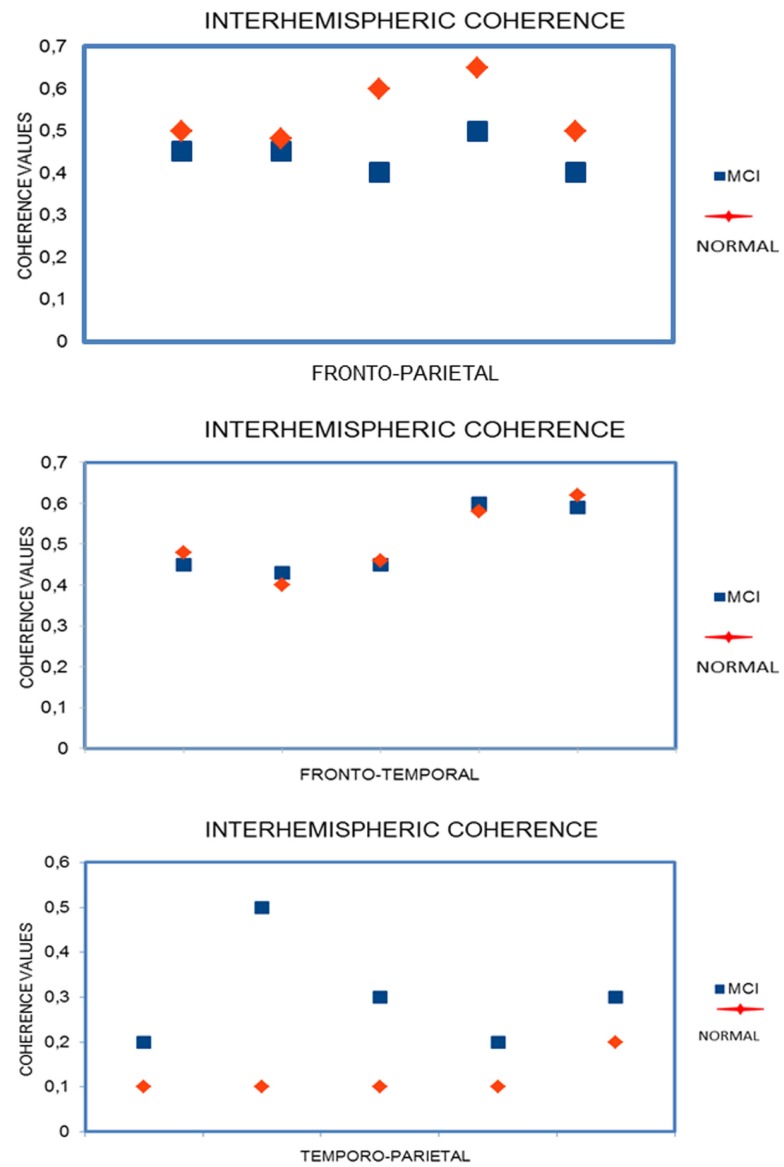
Results: In MCI subjects with higher EEG upper/low alpha power ratio, a greater temporo-parietal and hippocampal atrophy was found as well as a decrease in regional blood perfusion and memory impairment. In this group, an increase of theta oscillations is associated with a greater interhemispheric coupling between temporal areas.
Conclusion: The increase of alpha3/alpha2 power ratio is a promising novel biomarker in identifying MCI subjects at risk for Alzheimer's disease.
Keywords: EEG; MRI; SPECT; coherence; memory.
Figures
References
-
- Dubois B, Feldman HH, Jacova C, Dekosky ST, Barberger-Gateau P, Cummings J, et al. Research criteria for the diagnosis of Alzheimer’s disease: revising the NINCDS-ADRDA criteria. Lancet Neurol (2007) 6(8):734–46. Review. Alzheimers Dement. 2011 May;7(3):270-9,10.1016/S1474-4422(07)70178-3 - DOI - PubMed
-
- Albert MS, DeKosky ST, Dickson D, Dubois B, Feldman HH, Fox NC, et al. The diagnosis of mild cognitive impairment due to Alzheimer’s disease: recommendations from the National Institute on Aging-Alzheimer’s Association workgroups on diagnostic guidelines for Alzheimer’s disease. Alzheimers Dement (2011) 7(3):270–9.10.1016/j.jalz.2011.03.008 - DOI - PMC - PubMed
Publication types
LinkOut - more resources
Full Text Sources
Other Literature Sources