. 2015 Jul 6:6:345.
doi: 10.3389/fimmu.2015.00345. eCollection 2015.

Transcription Factor T-Bet in Atlantic Salmon: Characterization and Gene Expression in Mucosal Tissues during Aeromonas Salmonicida Infection

Affiliations

Transcription Factor T-Bet in Atlantic Salmon: Characterization and Gene Expression in Mucosal Tissues during Aeromonas Salmonicida Infection

Jaya Kumari et al. Front Immunol. .

Abstract

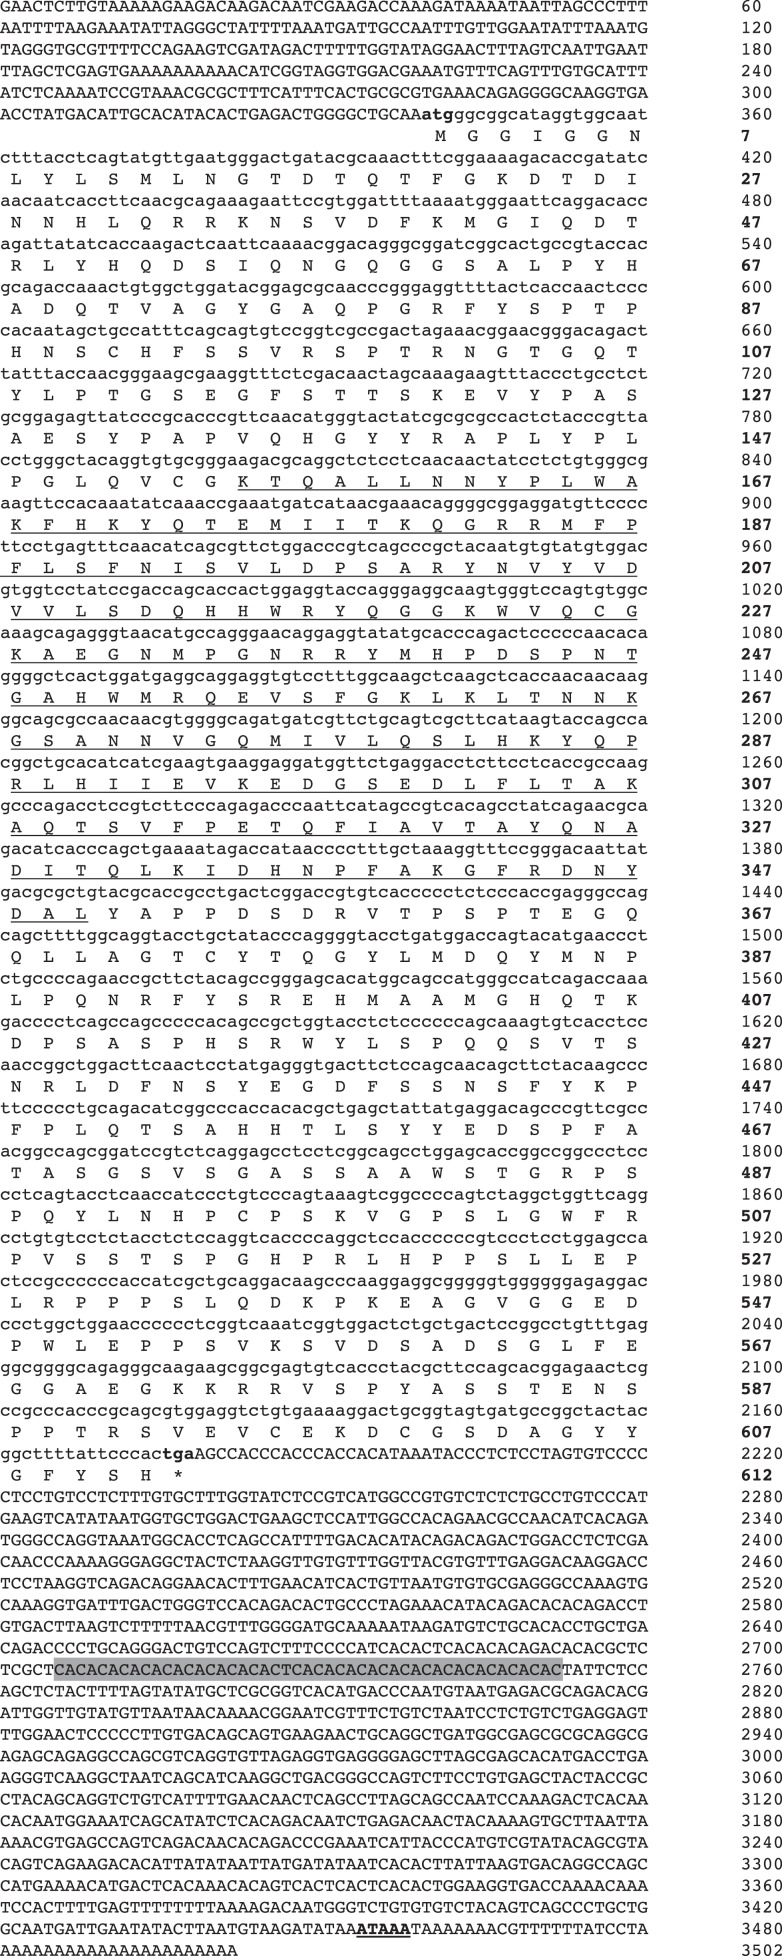
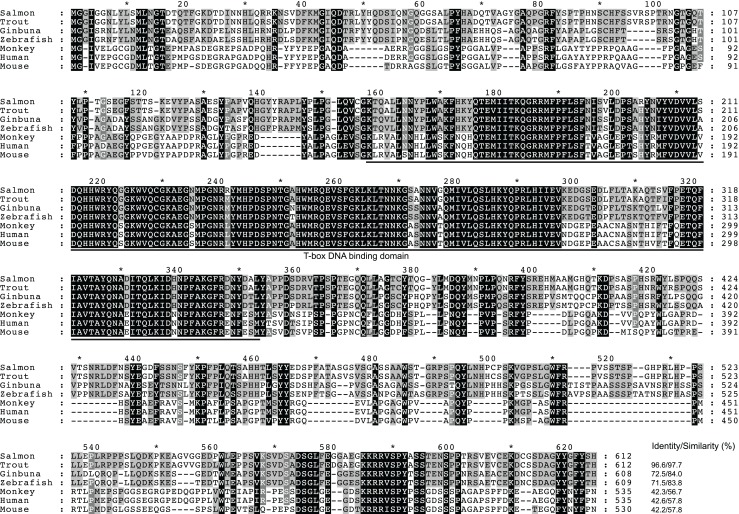
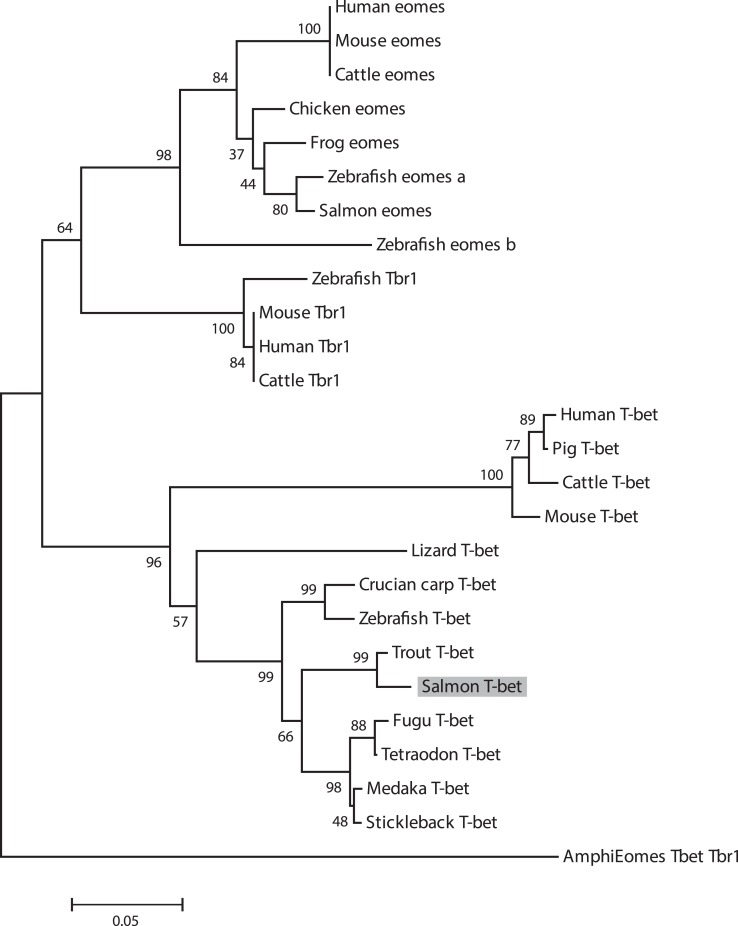
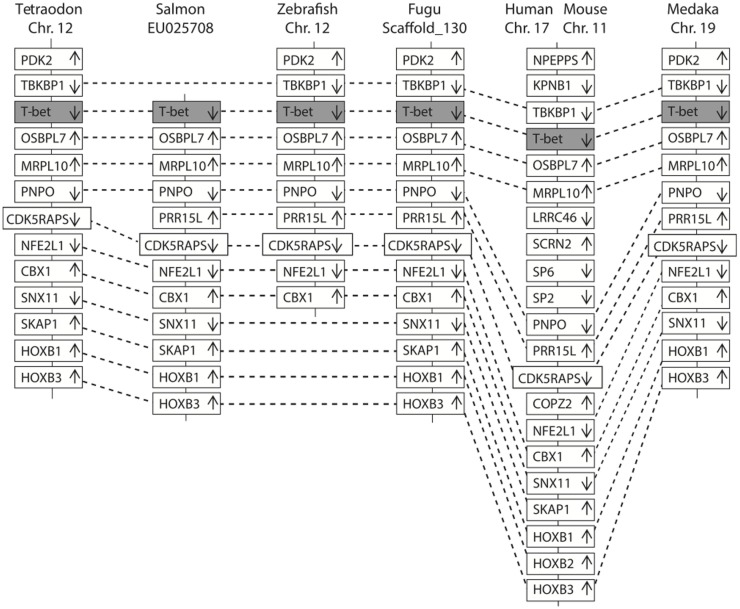
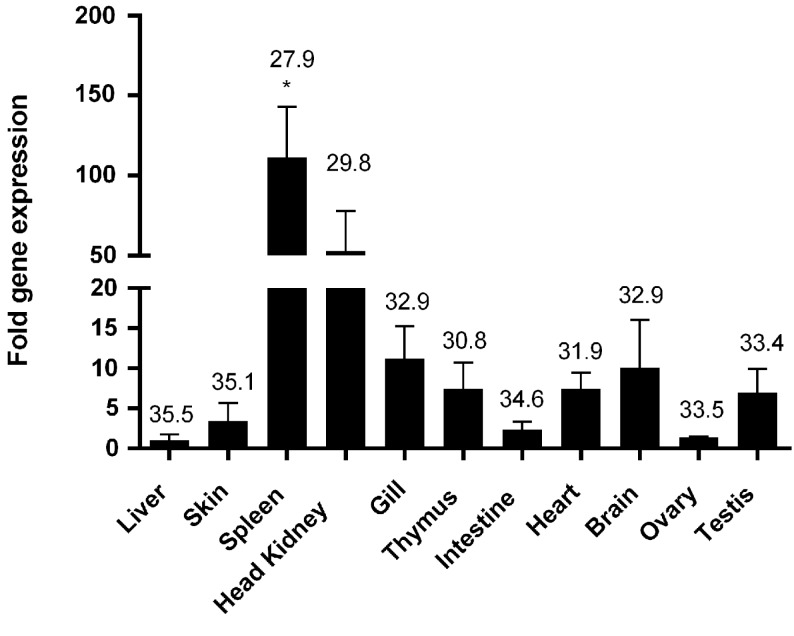
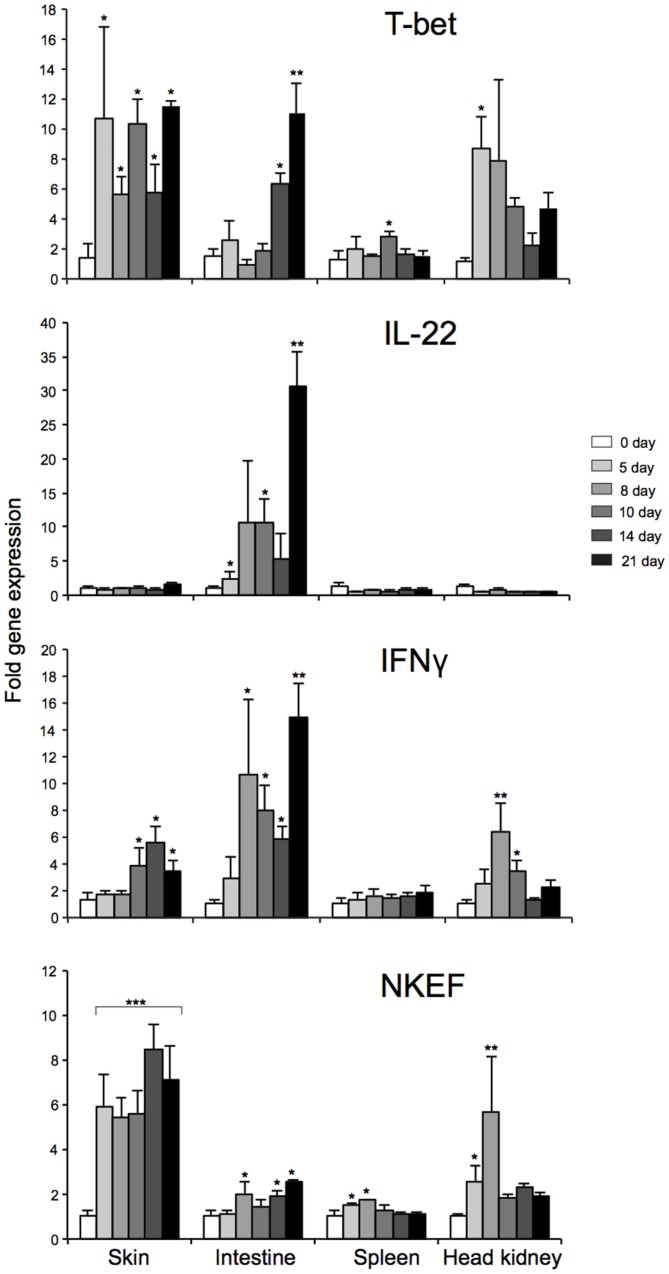
The T-box transcription factor T-bet is expressed in a number of hematopoietic cell types in mammals and plays an essential role in the lineage determination of Th1 T-helper cells and is considered as an essential feature for both innate and adaptive immune responses in higher vertebrates. In the present study, we have identified and characterized the full-length Atlantic salmon T-bet cDNA (3502 bp). The putative primary structure of the polypeptide deduced from the cDNA sequence contained 612 aa, which possessed a T-box DNA binding domain. Phylogenetic study and gene synteny revealed it is as a homolog to mammalian T-bet. Quantitative PCR analysis of different tissues in healthy fish showed that salmon T-bet gene was highly expressed in spleen, followed by head kidney, and was expressed in intestine, skin, and liver at lower levels. Moreover, the time-dependent expression profile of T-bet, interferon gamma (IFNγ), interleukin-22 (IL-22), and natural killer enhancement factor in mucosal tissues during water-borne infection with live Aeromonas salmonicida, indicated the involvement of T-bet in mucosal immune response in Atlantic salmon.

Keywords: A. salmonicida; Atlantic salmon; T-bet; gene expression; mucosal immunity.


Figures

Figure 1
Figure 1
Nucleotide and deduced amino acid sequence of Atlantic salmon T-bet cDNA. Uppercase denotes the UTR’s and lowercase denotes the coding regions. The T-box DNA binding domain is underlined. Start and stop codons are marked with bold letters. The asterisk indicates the stop codon. The putative polyadenylation signal is bold and underlined. A region of repeat with 23 copies of the consensus sequences CA (2 bp) is shaded.
Figure 2
Figure 2
Multiple sequence alignment of the deduced amino acid sequences from salmon T-bet and other vertebrates by the ClustalW2 program. Residues shaded in black are completely conserved across all species aligned, and residues shaded in gray refer to 60–80% identity. Dashes indicate gaps. The T-box DNA binding domain is indicated by solid line below the alignment. Accession numbers are given in Figure 3.
Figure 3
Figure 3
Phylogenetic tree showing the relationship of salmon T-bet gene with other known vertebrate members of the Tbr1 subfamily. The phylogram was constructed on ClustalX2 and MEGA 4.1. The neighbor-joining (N-J) method with bootstrap values of 1000 replications was adopted. Accession numbers or ENSEMBL gene IDs are as follows: Human (Homo sapiens) Eomes, NP_005433; Mouse (Mus musculus) Eomes, NP_034266; Cattle (Bos taurus) Eomes, NP_001178117; Frog (Xenopus laevis) Eomes, NP_001081810; Chicken (Gallus gallus), Eomes, XP_426003; Zebrafish (Danio rerio) Eomes a, NP_571754; Zebrafish Eomes b, NP_001077044; Salmon (Salmo salar) Eomes, EU418014; Amphioxus (Branchiostoma floridae) Eomes/Tbr1/Tbx21, AF262568; Human Tbr1, NP_006584; Mouse Tbr1, NP_033348.2; Cattle Tbr1, NP_001178978; Zebrafish Tbr1, NP_001108562; Human T-bet, NP_037483; Mouse T-bet, NP_062380; Cattle T-bet, NP_001179069; Pig (Sus scrofa) T-bet, ENSSSCP00000018565; Frog T-bet, NP_001088247; Lizard (Anolis carolinensis) T-bet, ENSACAP00000006911; Medaka (Oryzias latipes) T-bet, ENSORLP00000015259; Fugu (Takifugu rubripes) T-bet, ENSTRUP00000032964; Stickleback (Gasterosteus aculeatus) T-bet, ENSGACP00000005023; Tetraodon (Tetraodon nigroviridis) T-bet, ENSTNIP00000013001; Zebrafish T-bet, NP_001164070; Crucian carp (Carassius auratus langsdorfii) T-bet, BAF73805.1; Trout (Oncorhynchus mykiss) T-bet, NM_001182722.
Figure 4
Figure 4
Comparison of the location of T-bet genes in fish and mammals. The chromosomes and scaffold were identified in ENSEMBL (http://www.ensembl.org/). Boxes represent the deduced genes. Arrows indicate the deduced orientation of the gene transcription. Dash lines connecting boxes suggest the homologous relationship.
Figure 5
Figure 5
Tissue distribution of T-bet expression in healthy Atlantic salmon. Expression of salmon T-bet in different organs by real-time PCR. Gene expression data were normalized to EF-1α expression using liver as a calibrator. Bar represents the mean ± SEM (n = 6). Asterisk (*) above the bar shows significant difference (P < 0.05) compared with the organ that showed the lowest expression (liver). The value above the bars shows average real-time CT values of six fish.
Figure 6
Figure 6
Regulators of T-bet expression in salmon leukocytes. Spleen leukocytes were stimulated for 24, 48, and 72 h with ConA + PHA + huIL-2, IFN-α (0.5 mg/ml and 5 ng/ml), and the mRNA levels of T-bet were determined by real-time PCR. Gene expression is normalized against EF-1α and is shown relative to the mean of the non-stimulated cells (leukocyte cells with no treatment, i.e., only media control). Spleen leukocytes with no treatment were considered as control for each time points. Each bar represents the mean ± SE of triplicate samples. Different letters denote statistically significant differences (P < 0.05) between the groups.
Figure 7
Figure 7
Tissue specific expression of T-bet, IL-22, NKEF, and IFNγ in infected Atlantic salmon at different time-points after water-borne infection with A. salmonicida. Bars represent the relative expression levels of T-bet, IL-22, NKEF, and IFNγ normalized to EF-1α. Each value represents the mean ± SEM (n = 4). Statistical differences (P < 0.05, P < 0.01, and P < 0.001) between different time-points compared to control are indicated by asterisk (*,**, and ***) respectively, above the bars.

References

    1. Naiche LA, Harrelson Z, Kelly RG, Papaioannou VE. T-box genes in vertebrate development. Annu Rev Genet (2005) 39:219–39.10.1146/annurev.genet.39.073003.105925 - DOI - PubMed
    1. Pearce EL, Mullen AC, Martins GA, Krawczyk CM, Hutchins AS, Zediak VP, et al. Control of effector CD8+ T cell function by the transcription factor eomesodermin. Science (2003) 302:1041–3.10.1126/science.1090148 - DOI - PubMed
    1. Szabo SJ, Kim ST, Costa GL, Zhang X, Fathman CG, Glimcher LH. A novel transcription factor, T-bet, directs Th1 lineage commitment. Cell (2000) 100:655–69.10.1016/S0092-8674(00)80702-3 - DOI - PubMed
    1. Szabo SJ, Sullivan BM, Peng SL, Glimcher LH. Molecular mechanisms regulating Th1 immune responses. Annu Rev Immunol (2003) 21:713–58.10.1146/annurev.immunol.21.120601.140942 - DOI - PubMed
    1. Glimcher LH. Trawling for treasure: tales of T-bet. Nat Immunol (2007) 8:448–50.10.1038/ni0507-448 - DOI - PubMed

LinkOut - more resources