. 2015 Jul 28;10(7):e0134145.
doi: 10.1371/journal.pone.0134145. eCollection 2015.

To Break or to Brake Neuronal Network Accelerated by Ammonium Ions?

Affiliations

To Break or to Brake Neuronal Network Accelerated by Ammonium Ions?

Vladimir V Dynnik et al. PLoS One. .

Abstract

Purpose: The aim of present study was to investigate the effects of ammonium ions on in vitro neuronal network activity and to search alternative methods of acute ammonia neurotoxicity prevention.

Methods: Rat hippocampal neuronal and astrocytes co-cultures in vitro, fluorescent microscopy and perforated patch clamp were used to monitor the changes in intracellular Ca2+- and membrane potential produced by ammonium ions and various modulators in the cells implicated in neural networks.

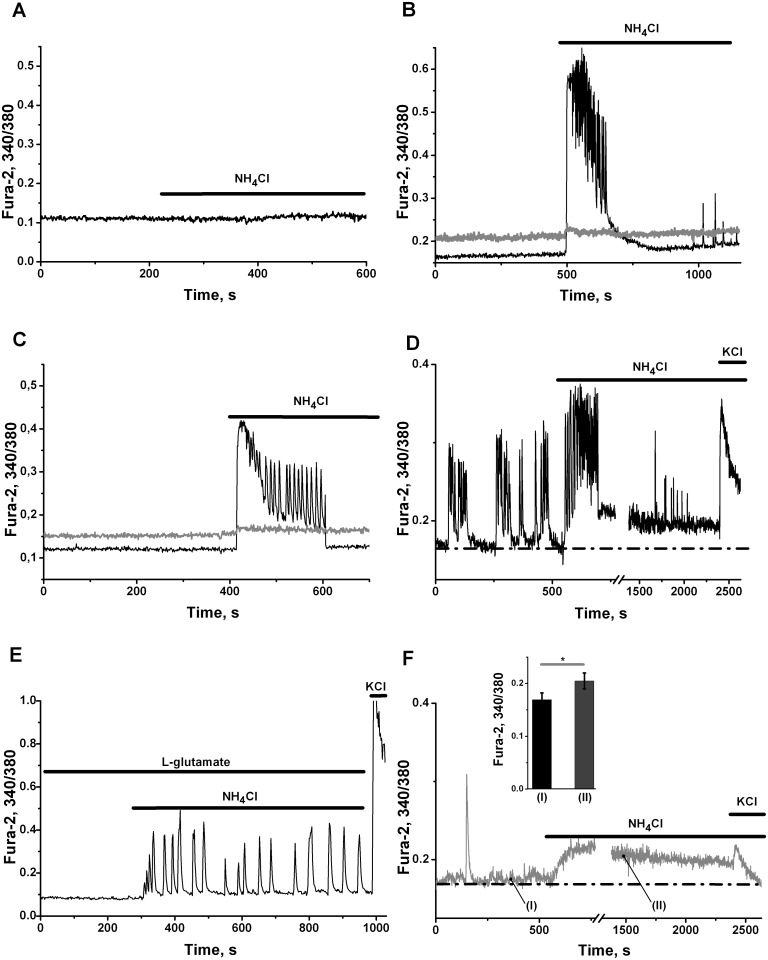
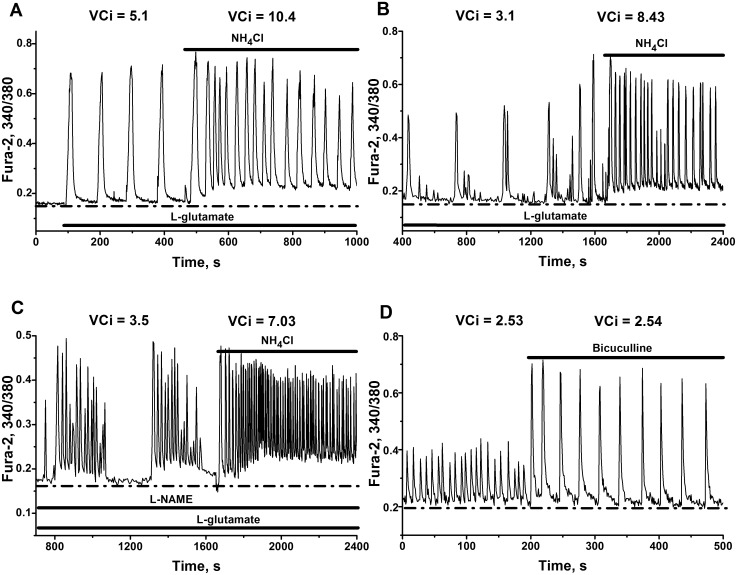
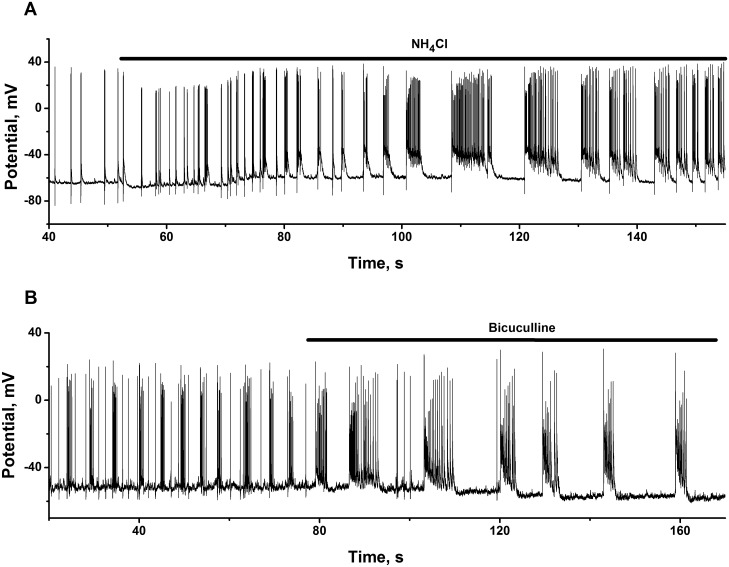
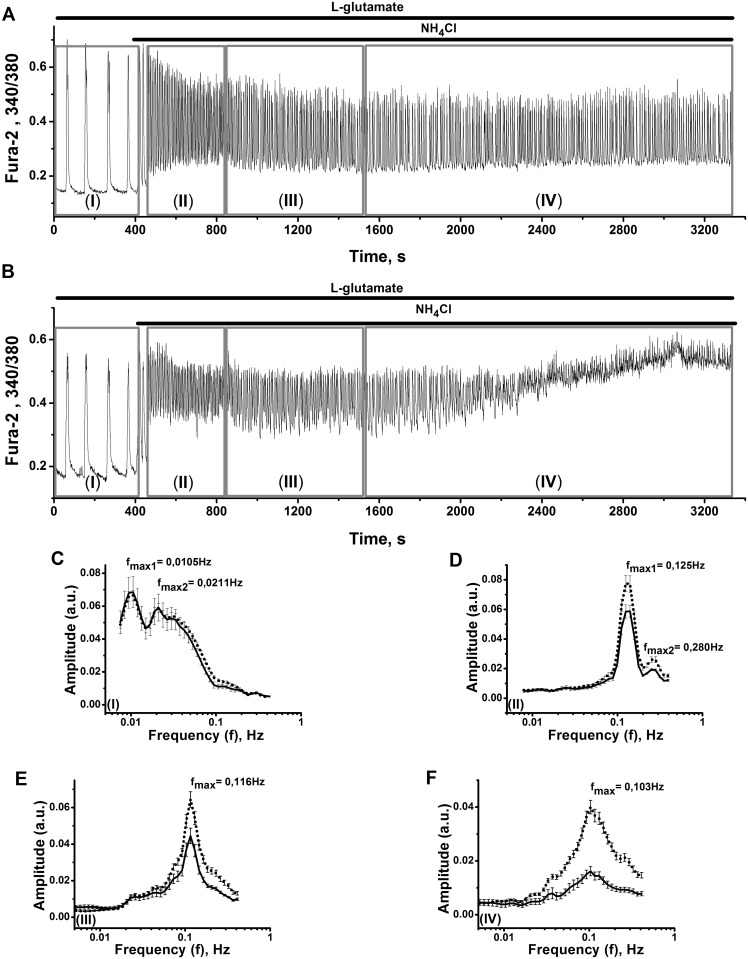
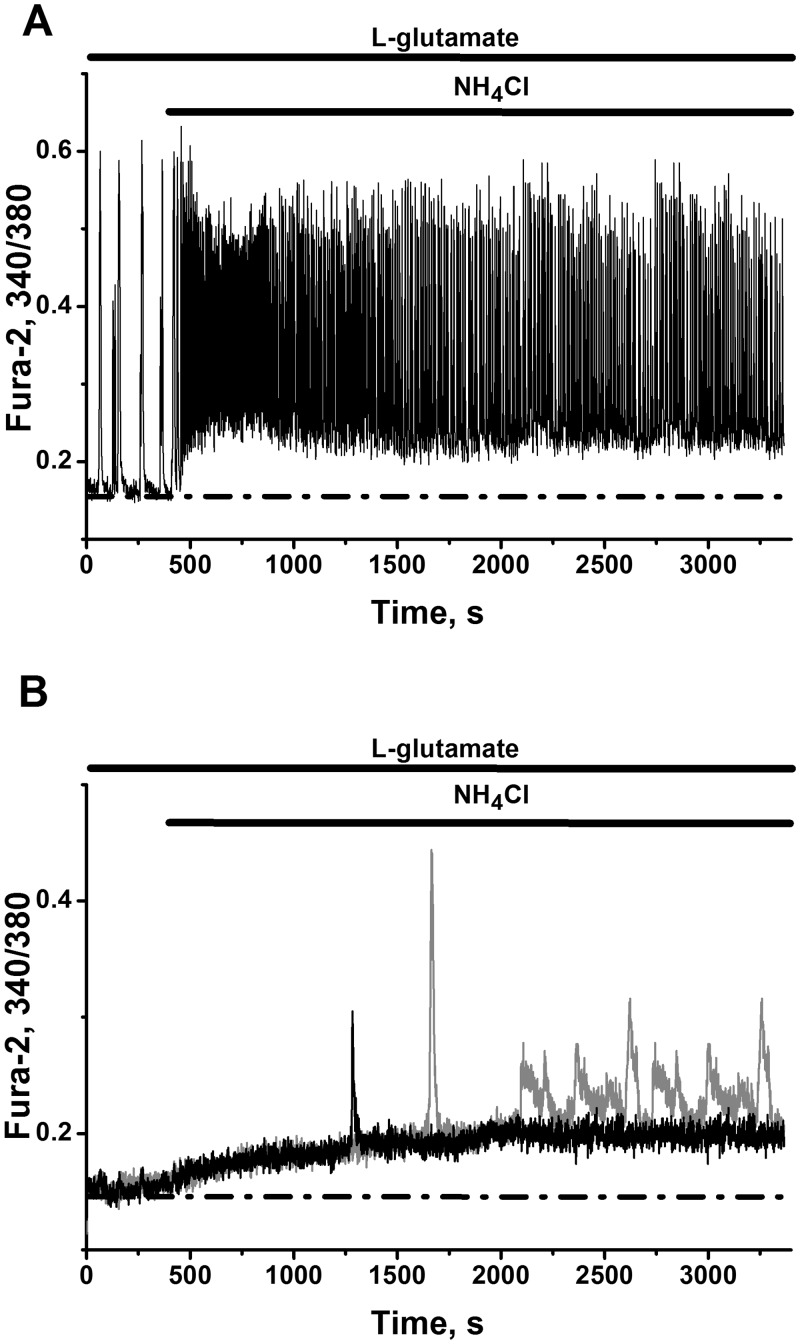
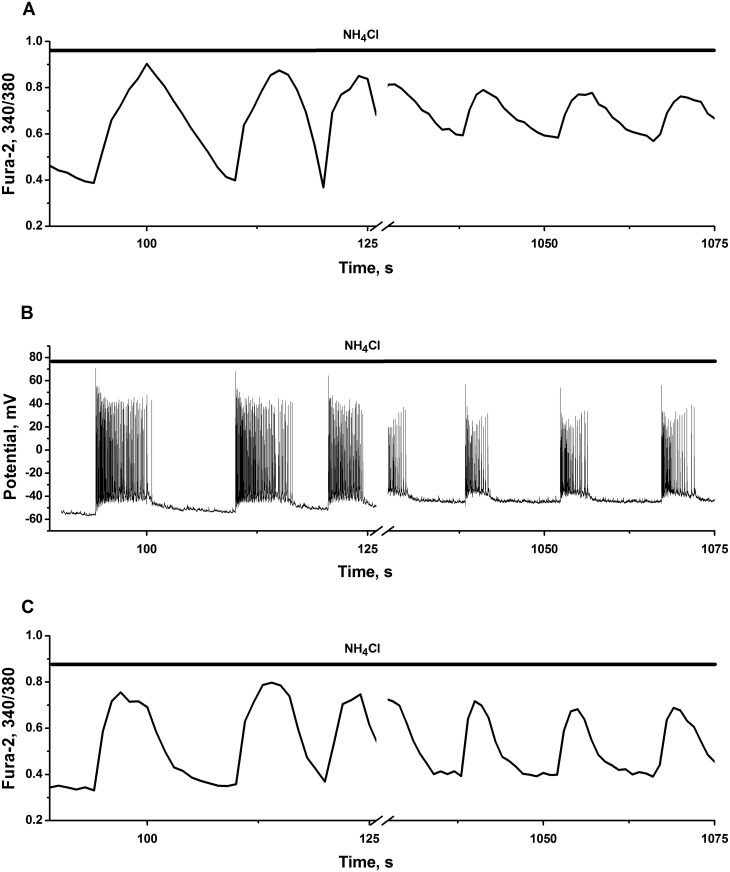
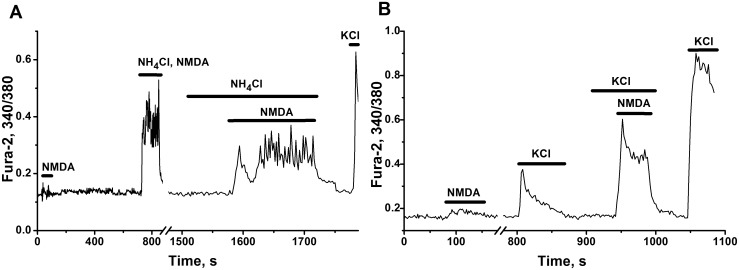
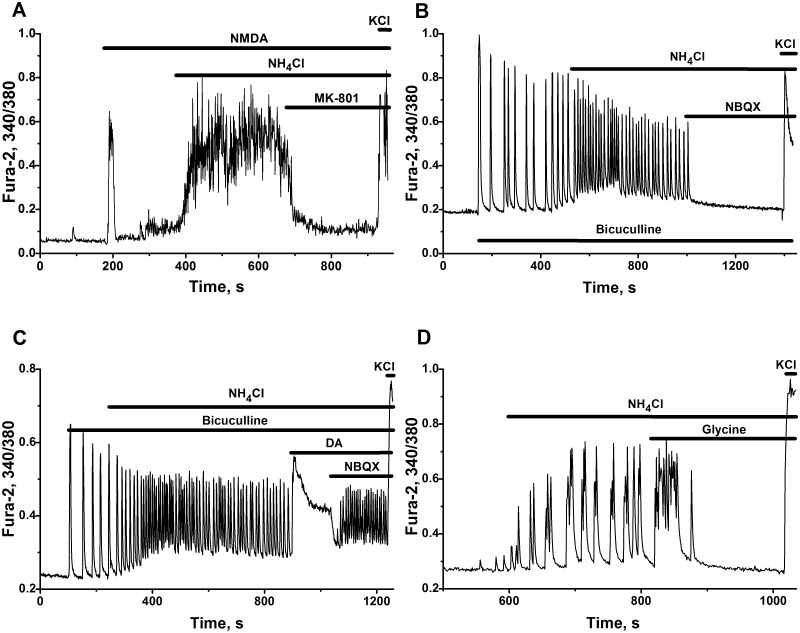
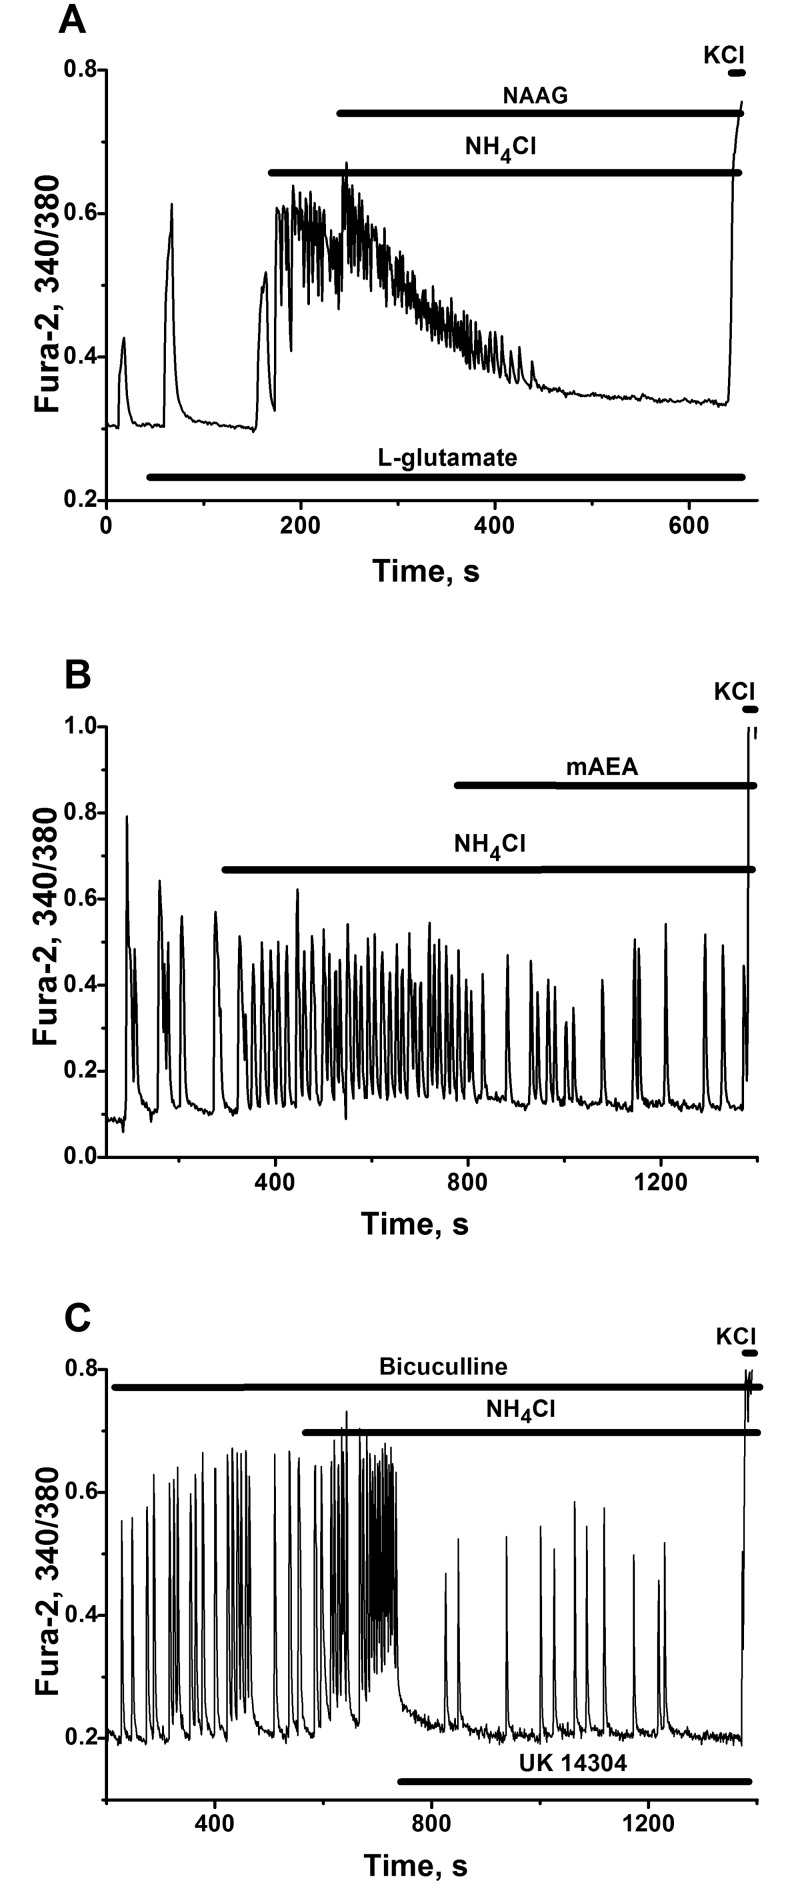
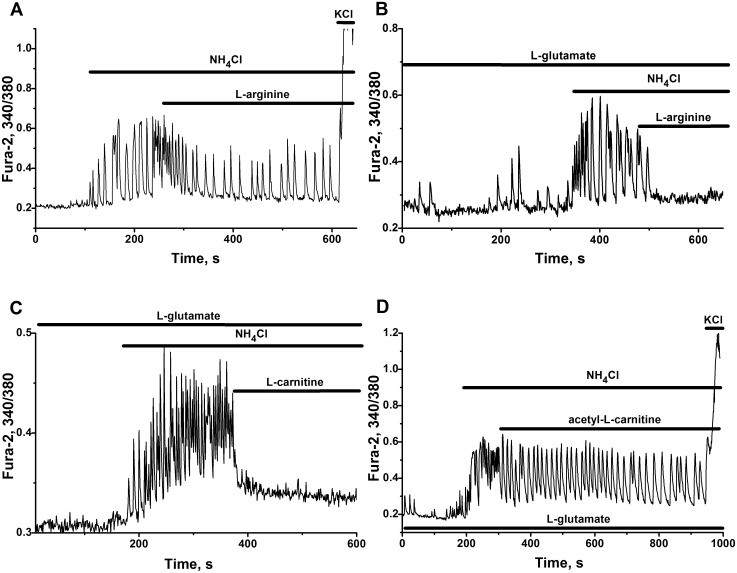
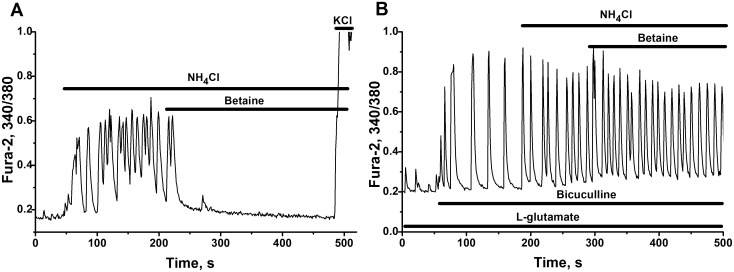
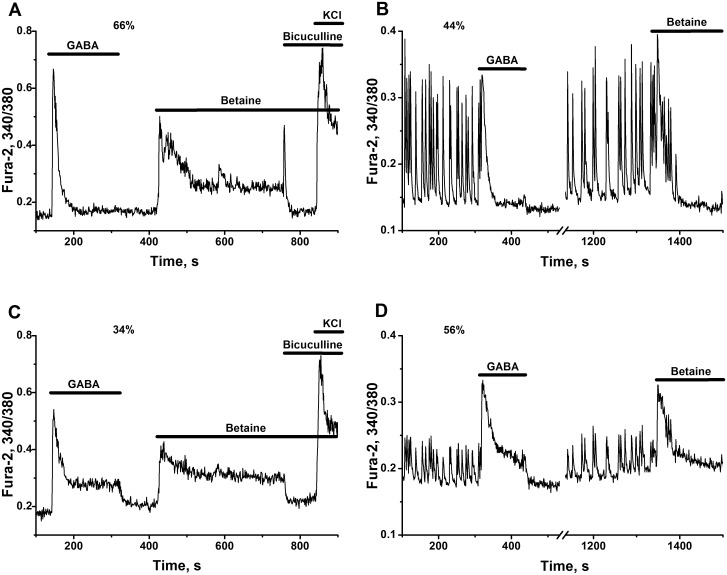
Results: Low concentrations of NH4Cl (0.1-4 mM) produce short temporal effects on network activity. Application of 5-8 mM NH4Cl: invariably transforms diverse network firing regimen to identical burst patterns, characterized by substantial neuronal membrane depolarization at plateau phase of potential and high-amplitude Ca2+-oscillations; raises frequency and average for period of oscillations Ca2+-level in all cells implicated in network; results in the appearance of group of «run out» cells with high intracellular Ca2+ and steadily diminished amplitudes of oscillations; increases astrocyte Ca2+-signalling, characterized by the appearance of groups of cells with increased intracellular Ca2+-level and/or chaotic Ca2+-oscillations. Accelerated network activity may be suppressed by the blockade of NMDA or AMPA/kainate-receptors or by overactivation of AMPA/kainite-receptors. Ammonia still activate neuronal firing in the presence of GABA(A) receptors antagonist bicuculline, indicating that «disinhibition phenomenon» is not implicated in the mechanisms of networks acceleration. Network activity may also be slowed down by glycine, agonists of metabotropic inhibitory receptors, betaine, L-carnitine, L-arginine, etc.

Conclusions: Obtained results demonstrate that ammonium ions accelerate neuronal networks firing, implicating ionotropic glutamate receptors, having preserved the activities of group of inhibitory ionotropic and metabotropic receptors. This may mean, that ammonia neurotoxicity might be prevented by the activation of various inhibitory receptors (i.e. by the reinforcement of negative feedback control), instead of application of various enzyme inhibitors and receptor antagonists (breaking of neural, metabolic and signaling systems).


Conflict of interest statement

Competing Interests: The authors have declared that no competing interests exist.

Figures

Fig 1
Fig 1. Ammonium chloride effects on neuronal network are concentration dependent.
Here and later on calcium responses are measured by Fura-2 ratio. Records characterize individual neurons (black lines) and astrocytes (grey lines), i.e. representative cells of 90–95% cells implicated in the network. Thick horizontal black lines mark the periods of application of ammonium chloride (NH4Cl, 0.1–4 mM), L-glutamate (200 nM) and KCl (35 mM). (A) Application of 0.1 mM NH4Cl does not alter Ca2+ signals registered in representative cells: neurone (black line) and astrocyte (grey line). Neuronal culture 12 DIV. Number of monitored neurons in network N = 84 and number of astrocytes N1 = 47. Here is presented one of 12 experiments (n = 12). (B) Application of 1 mM NH4Cl induces one burst of high-amplitude Ca2+ oscillations in representative neuronal cell (black line) and does not alter significantly Ca2+ level in representative astrocyte (grey line). Neuronal culture 12 DIV. Number of neurons in network N = 96 and number of monitored astrocytes N1 = 52. Here is presented 1 of 3 experiments with evoked Ca2+ signal. Total number of experiments n = 20. (C) Application of 2 mM NH4Cl induces one burst of high-amplitude Ca2+ oscillations in representative neuronal cell (black line) wich is accompanied by some temporary elevation in astrocytic Ca2+-signal (grey line). Neuronal culture 15 DIV. Total number of neurons involved into network N = 102. Number of monitored astrocytes N1 = 43. Here is presented 1 of 2 experiments with evoked Ca2+-burst. Total number of experiments n = 10. (D) Application of 3 mM NH4Cl induces one burst of high-amplitude Ca2+ oscillations in representative neuronal cell (black line) with the rise in Ca2+ level in after burst period. Neuronal culture 14 DIV. Total number of neurons involved into network N = 91. Number of monitored astrocytes N1 = 47. Here is presented 1 of 3 experiments with evoked Ca2+-burst. Total number of experiments n = 12. (E) Induction of sustained Ca2+-oscillations in neuronal network by 4 mM NH4Cl. Record of representative neuron is presented. Neuronal culture 5 DIV. Total number of neurons in network N = 84. Here is presented 1 of 6 experiments with stable high-amplitude Ca2+-oscillations. Total number of experiments n = 10. 200 nM of L-glutamate was added before application of NH4Cl. (F) The record of Ca2+-signalling in astrocyte evoked by 3 mM NH4Cl. It corresponds to the experiment presented on Fig D. Application of 3 mM NH4Cl induces immediate rise of Ca2+ level to new steady state in representative astrocyte (grey line). Note the significant differences in the responses of neurons (Fig B) and astrocytes to depolarizing action of 35 mM KCl. Neuronal culture 14 DIV. Total number of neurons N = 91. Number of monitored astrocytes N1 = 47. Inserted black bars indicate the average amplitudes ± SD of intracellular Ca2+ level in 47 astrocytes recorded at time-points indicated. *P<0.05 is given for difference between both values.
Fig 2
Fig 2. Transformation of simple and complex intracellular Ca2+-oscillations into high-amplitude impulse-shaped Ca2+-oscillations by NH4Cl or bicuculline.
Neuronal cultures 12 DIV. Resting calcium level is outlined by dot-dashed lines. Calcium increment over resting level (VCi = ΔCa (a.u.)/min) is indicated on the Figures as VCi. All other abbreviations as on Fig 1. Total number of neuronal cells in networks are: N = 116, 132, 98, 110 for Fig A, B, C and D, correspondingly. (AC) NH4Cl induces high-amplitude Ca2+-oscillations in representative cells. 200 nM of L-glutamate was added before application of NH4Cl. (C) The experiment was performed in the presence of 10 μM L-NAME and 200 nM of L-glutamate. (D) 10 μM of bicuculline evokes high-amplitude Ca2+-oscillations in spontaneously firing cell. Only parts of total records are presented on Fig B and C. Initial parts were omitted for simplicity.
Fig 3
Fig 3. Typical discharge patterns of spontaneously firing cells and their transformation into strong burst firing produced by ammonium ions and bicuculline.
Neuronal cultures 12 DIV. (A) NH4Cl (8 mM in the bath) causes the switching of tonic spiking to strong high-frequency burst firing, characterized by substantial depolarization of membrane potential at plateau phase of each burst. N = 97. n = 5. (B) Bicuculline (10 μM in the bath) transforms spontaneous bursting fluctuations of membrane potential into strong high-frequency burst firing. N = 89. n = 5. Here presented only parts of total records. Initial parts were omitted for simplicity.
Fig 4
Fig 4. The records of Ca2+ oscillations (A, B) and Amplitude-frequency (A-f) spectral characteristics of Ca2+ oscillations (C–F) of two groups of neurons in network, observed after long lasting application of 6mM NH4Cl.
Neuronal culture 14 DIV. Total number of cells involved into network is 123. 200 nM of L-glutamate was added before application of 6 mM NH4Cl. (A) The record describing typical response of one of 95% cells in the network (of representative cell). (B) The record characterizing one of 5% «run out» cells, which after time point 2000 seconds slowly moves to the state with enlarged Ca2+. (CF) A-f spectra of two groups of cells (of typical and «run out» cells) are calculated for time intervals limited by boxes (I), (II), (III) and (IV) at Fig 4A and 4B. Dotted lines on A-f spectra correspond to 95% of cells with typical calcium response to NH4Cl (Fig 4A). Continuous lines correspond to 5% of «run out» cells (Fig 4B). SEM values are given for amplitudes deviations from average values and indicated by vertical bars. Maximal frequencies (fmax) corresponding to maximal amplitudes are presented on the spectra.
Fig 5
Fig 5. Comparative simultaneous recordings of Ca2+-oscillations in representative neuronal cell (A) and calcium signaling in two types of astrocytes (B) in network activated by 6 mM NH4Cl.
Neuronal culture 14 DIV. Part of the experiment presented on Fig 4. All conditions as at Fig 4. (A) Recording of Ca2+ oscillations in representative neuronal cell (95% of cells) after application of NH4Cl. This is the repeat of the recording presented on Fig 4A. (B) Recordings of two types of responses of representative astrocytes are shown. NH4Cl slightly increases astrocyte Ca2+ i level with generation of solitary Ca2+ spikes in 44 of 67 cells (black line) and induce chaotic Ca2+ oscillations in 23 of 67 cells (gray line).
Fig 6
Fig 6. Simultaneous recordings of membrane potential and of Ca2+-oscillations in «run out» cell and representative cell in network activated by 5 mM NH4Cl.
Neuronal culture 16 DIV. Total number of neuronal cells involved into network is 106. Gaps in the traces represent pauses in data recordings. Here are presented only parts of 3 records. Initial parts were omitted for simplicity. (A) Recording of Ca2+-oscillations in «run out» cell. (B) Recording of membrane potential in «run out» cell. (C) Recording of Ca2+-oscillations in representative cell (one of 95% cells monitored in network).
Fig 7
Fig 7. Synergistic action of ammonium ions and NMDA on changes in calcium concentrations in immature neuronal cells.
Neuronal cultures 5 and 7 DIV. All other abbreviations and descriptions as on Fig 1. Gaps in the traces represent pauses in data recordings. (A) Combined synergistic action of NH4Cl (4 mM) and NMDA (10 μM) on cellular Ca2+ level, both of each separately cannot evoke Ca2+ signal and activate the cell. Culture 5 DIV. N = 66. (B) Neuronal Ca2+ responses to separate and combined action of NMDA (20 μM) and KCl (5 mM). Culture 7 DIV. N = 72.
Fig 8
Fig 8. The involvement of ionotropic glutamate, GABA and glycine receptors in the activation of neural network by ammonium ions.
Ca2+ responses of representative neurons (81% of cells on Fig A and 90–95% of cells on Fig B–D in networks monitored) were registered in cultures 12–16 DIV. All other abbreviations and descriptions as on Fig 1. (A) Suppressant effect of the antagonist of NMDA-receptors MK-801 (20 μM) on neuronal network accelerated by 8 mM NH4Cl in the presence of NMDA (10 μM). N = 97. (B) The antagonist of AMPA/Kainate receptors NBQX (20 μM) cancelled Ca2+ oscillations accelerated by 8 mM NH4Cl in the presence of GABA (A)-receptors antagonist bicuculline (20 μM). N = 124. (C) Excessive activation of AMPA/kainate receptors by domoic acid (DA, 200 nM) suppresses oscillatory regime in whole network disinhibited by bicuculline (20 μM) and further activated by NH4Cl (8 mM). Added NBQX (20 μM) renewed high-frequency oscillations, previously destroyed by DA. N = 132. (D) 100 μM glycine damped Ca2+-oscillations induced by 8 mM NH4Cl in previously silent network. N = 98.
Fig 9
Fig 9. Effects of the agonists of inhibitory metabotropic receptors on the activation of neural networks by ammonium ions.
Cultures 12–18 DIV. Responses of representative cells (90–95%) are presented. All other abbreviations and descriptions as on Fig 2. (A) Suppression of Ca2+-oscillations induced by 8mM NH4Cl after the application of 100 μM of metabotropic glutamate type II receptors agonist N-acetyl-aspartyl-glutamate (NAAG). 200 nM of L-glutamate was added before application of NH4Cl. N = 97. (B, C) Slowing down of Ca2+-oscillations in the network in the presence of 8mM NH4Cl by the agonists of α2-adrenoreceptors—UK14304 (100 nM, Fig B) and of cannabinoid CB1-receptors—mAEA (300 nM, Fig C). On Fig B the medium contained 10μM of bicuculline. N = 121 (for Fig B). N = 108 (for Fig C). Only part of total records presented on Fig C. Initial parts were omitted for simplicity.
Fig 10
Fig 10. Suppressive and modulating effects of L-arginine, L-carnitine and acetyl-L-carnitine on neuronal networks activated by ammonium ions.
Cultures 12–18 DIV. The records of representative cells (more than 90% of cells in culture) are presented. All other abbreviations and descriptions as on Fig 2. (A, B) Modulating (A) and suppressive (B) effects of L-arginine (10 mM). Typical responses of cells in few (Fig A; 20%) and in most (80%; Fig B) of cultures studied. n = 10. Culture 12 DIV. N = 89 (for Fig A). N = 106 (for Fig B). (C, D) Typical suppressant effect of L-carnitine (10 mM; Fig C) and modulatory effect of acetyl-L-carnitine (10 mM; Fig D) in most of cultures studied (75 and 80%, of cultures. n = 4 and n = 5 correspondingly). Culture 16 DIV. N = 111 (for Fig C). Culture 18 DIV. N = 126 (for Fig D). 200 nM of L-glutamate was added before application of 8 mM NH4Cl on Fig B, C, D.
Fig 11
Fig 11. Inhibitory effect of betaine on the activation of networks by ammonium ions and its dependence on the operation of GABA(A)-receptors.
Cultures 14 DIV. The records of representative cells. All other abbreviations and descriptions as on Fig 2. (A) Suppression of Ca2+-oscillations induced by 8mM NH4Cl after the application 10 mM of betaine. N = 136. (B) Disappearance of suppressive effect of betaine in the presence of GABA(A)-receptors antagonist bicuculline (10 μM). N = 124. 200 nM of L-glutamate was added before application of NH4Cl on Fig B.
Fig 12
Fig 12. Similarity of the action of GABA and betaine on Ca2+-signaling in immature cells.
Cultures 5, 7 DIV. The records of representative cells (to 60% of the cells on Fig A) and to 50% on Fig B). All other abbreviations and descriptions as on Fig 2. (A, C) Two types of Ca2+ responses to the application of GABA (5 μM) and one type of response to the action of betaine (10 mM) and suppression of betaine effect by bicuculline (2 μM) are observed in culture 5 DIV. N = 74. n = 3. (B, D) Inhibition of spontaneous Ca2+-oscillations in individual cells, observed in culture 7 DIV after addition of GABA and betaine. Two types of Ca2+ response to GABA and one type of response to betaine are observed in 20% of cultures in the cells with spontaneous activity. N = 36. n = 10. Here presented only parts of total records (Fig B, D). Initial parts were omitted for simplicity.

Similar articles

Cited by

References

    1. Sherlock S. Hepatic coma. Gastroenterology. Official publication of the American Gastroenterological Association. 1961;07: 1–8.
    1. Colombo JP. Congenital disorders of the urea cycle and ammonia detoxication. [Review]. Monogr Paediatr. 1971;1: 1–150. - PubMed
    1. Hindfelt B, Siesjo BK. Cerebral effects of acute ammonia intoxication. II. The effect upon energy metabolism. Scand J Clin Lab Invest. 1971;28: 365–74. - PubMed
    1. Hawkins RA, Miller AL, Nielsen RC, Veech RL. The acute action of ammonia on rat brain metabolism in vivo. Biochem J. 1973;134: 1001–8. - PMC - PubMed
    1. O'Connor JE, Costell M, Grisolia S. Protective effect of L-carnitine on hyperammonemia. FEBS Lett. 1984;166: 331–4. - PubMed

Publication types

LinkOut - more resources