. 2015 Jul 28;11(7):e1004974.
doi: 10.1371/journal.ppat.1004974. eCollection 2015 Jul.

A Comprehensive Analysis of Replicating Merkel Cell Polyomavirus Genomes Delineates the Viral Transcription Program and Suggests a Role for mcv-miR-M1 in Episomal Persistence

Affiliations

A Comprehensive Analysis of Replicating Merkel Cell Polyomavirus Genomes Delineates the Viral Transcription Program and Suggests a Role for mcv-miR-M1 in Episomal Persistence

Juliane Marie Theiss et al. PLoS Pathog. .

Abstract

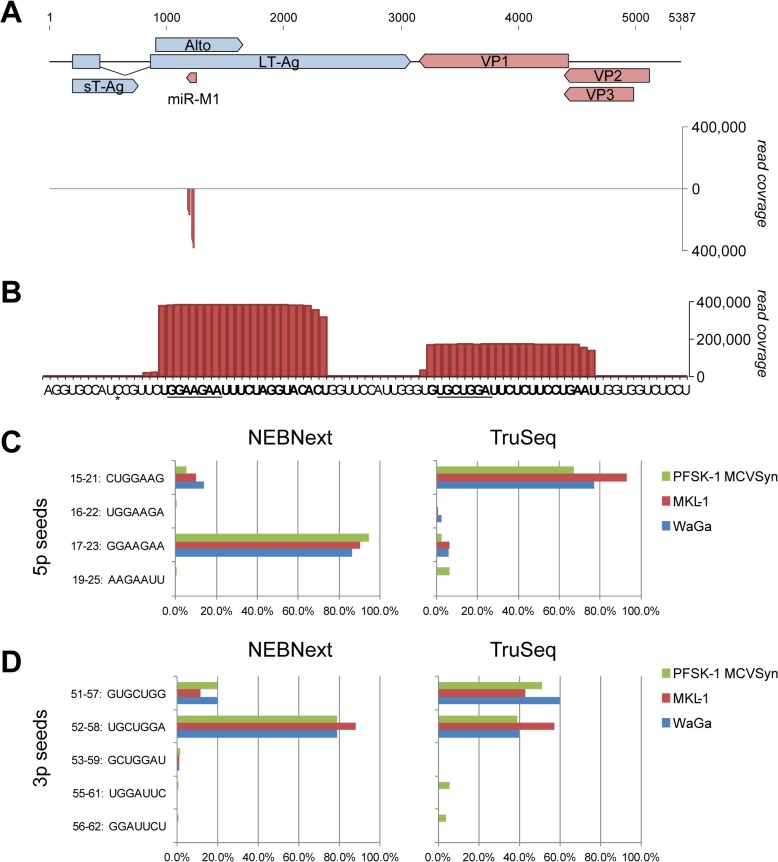
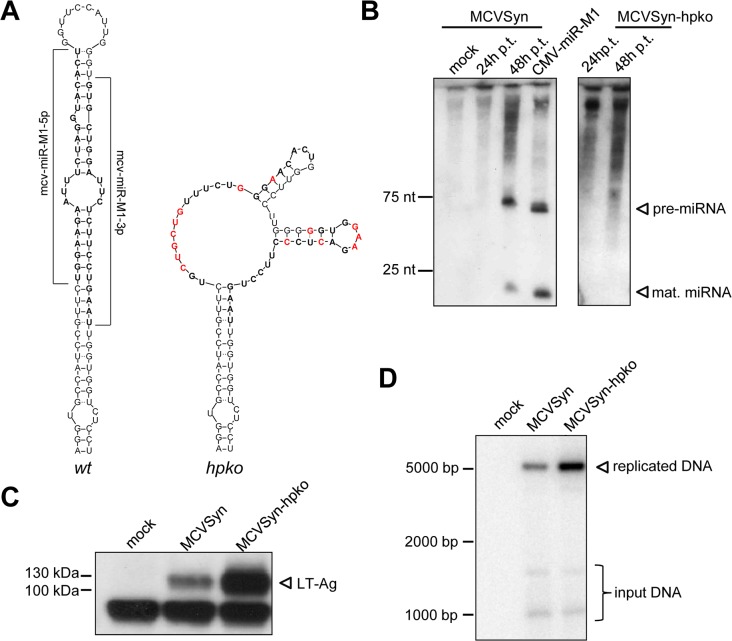
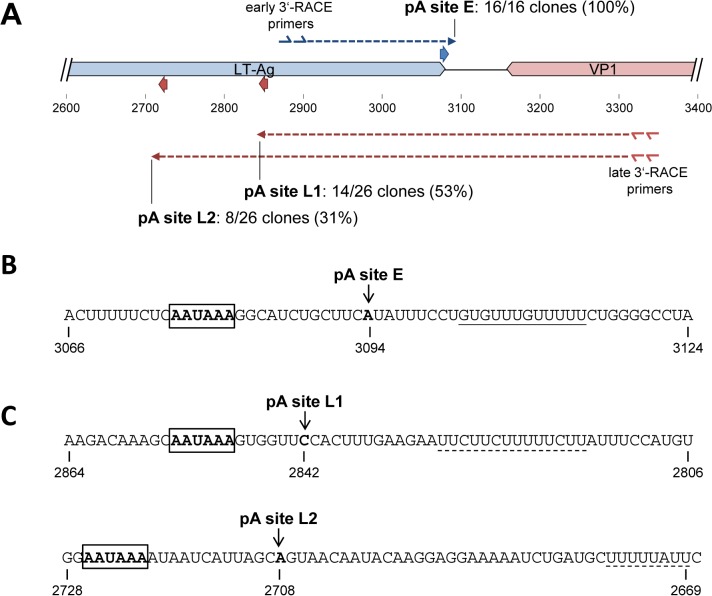
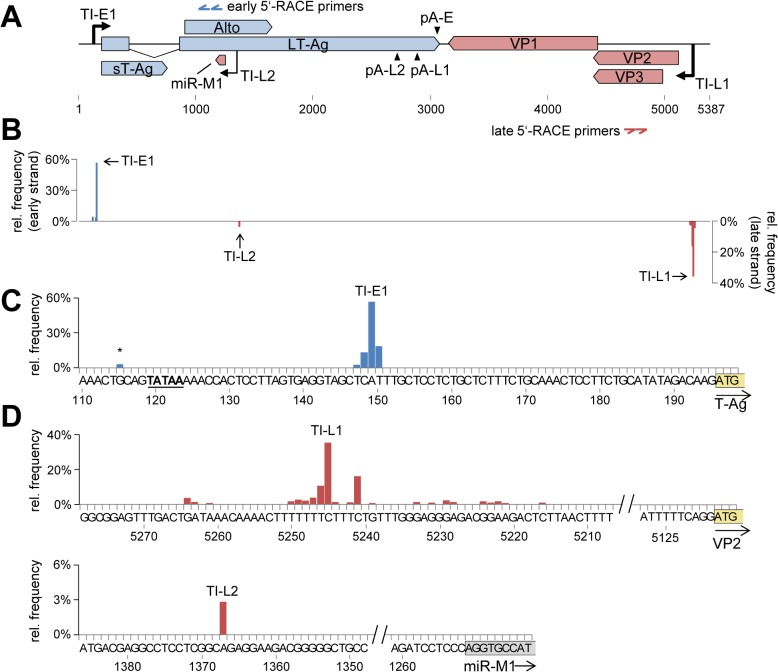
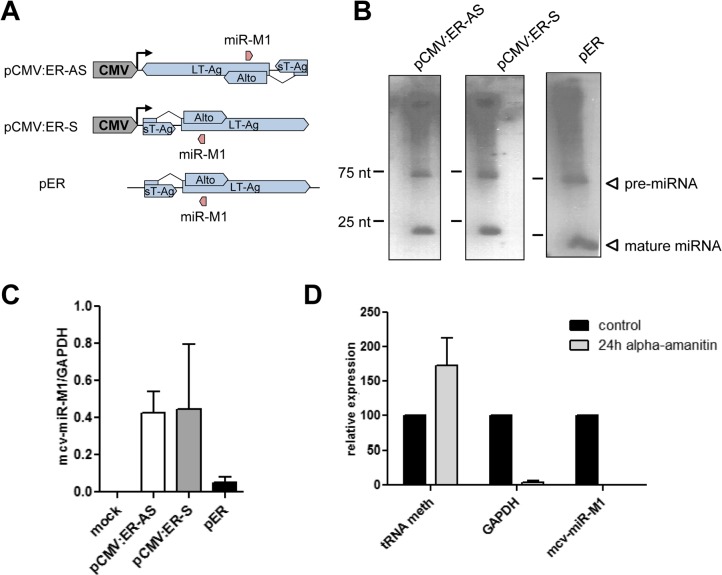
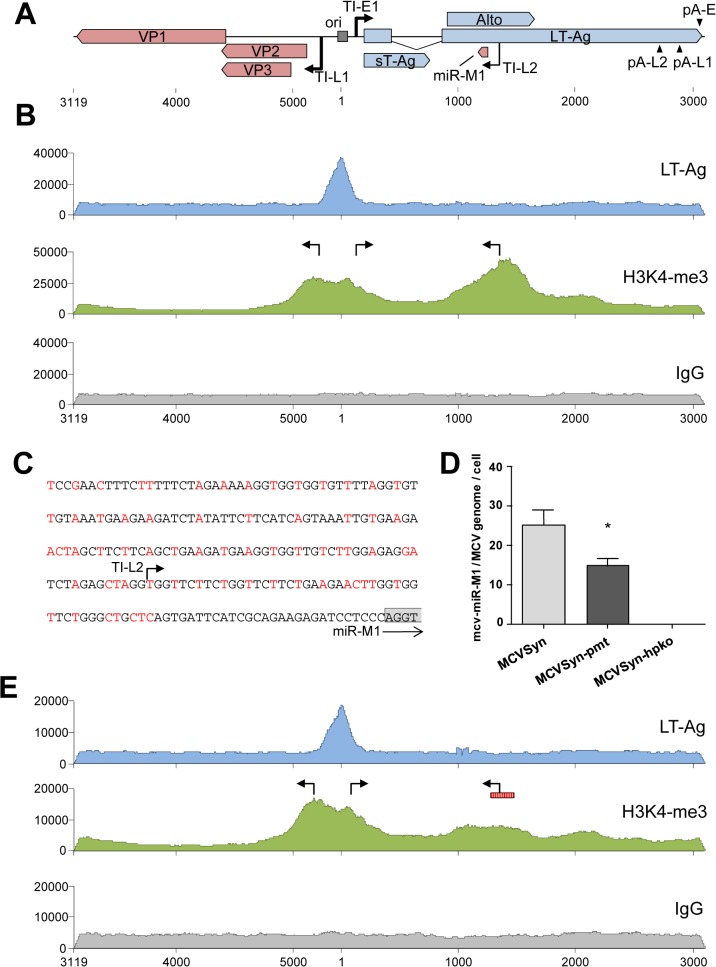
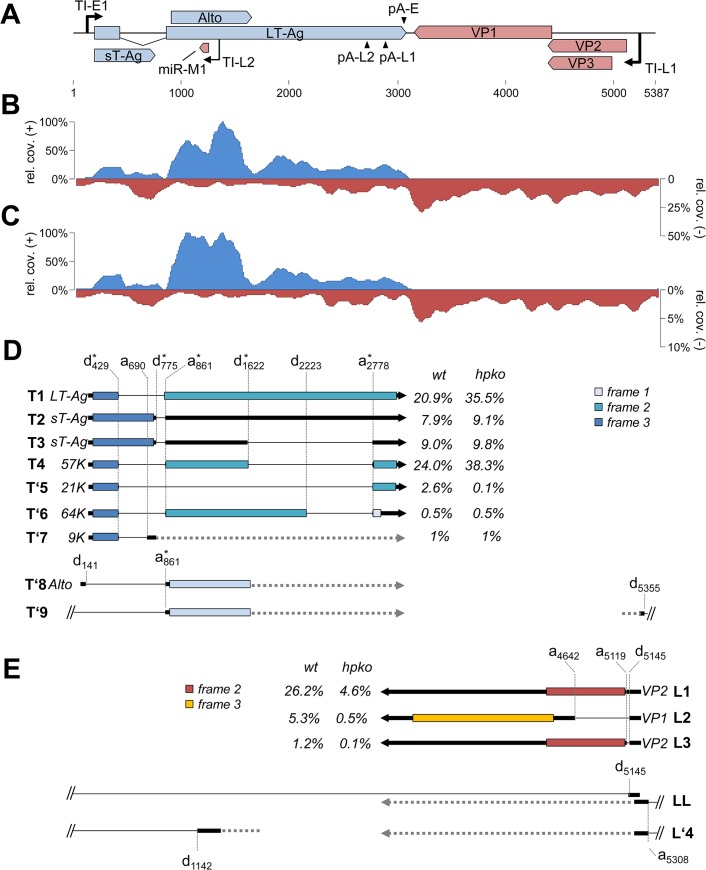
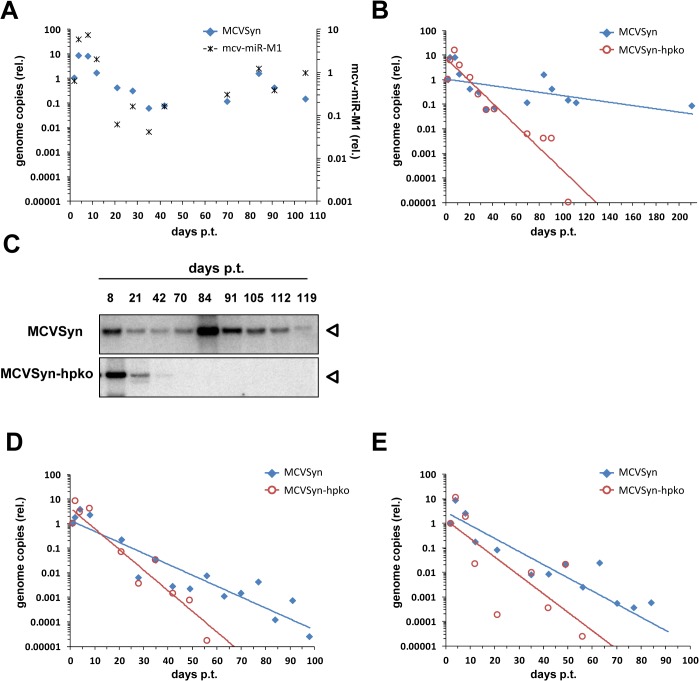
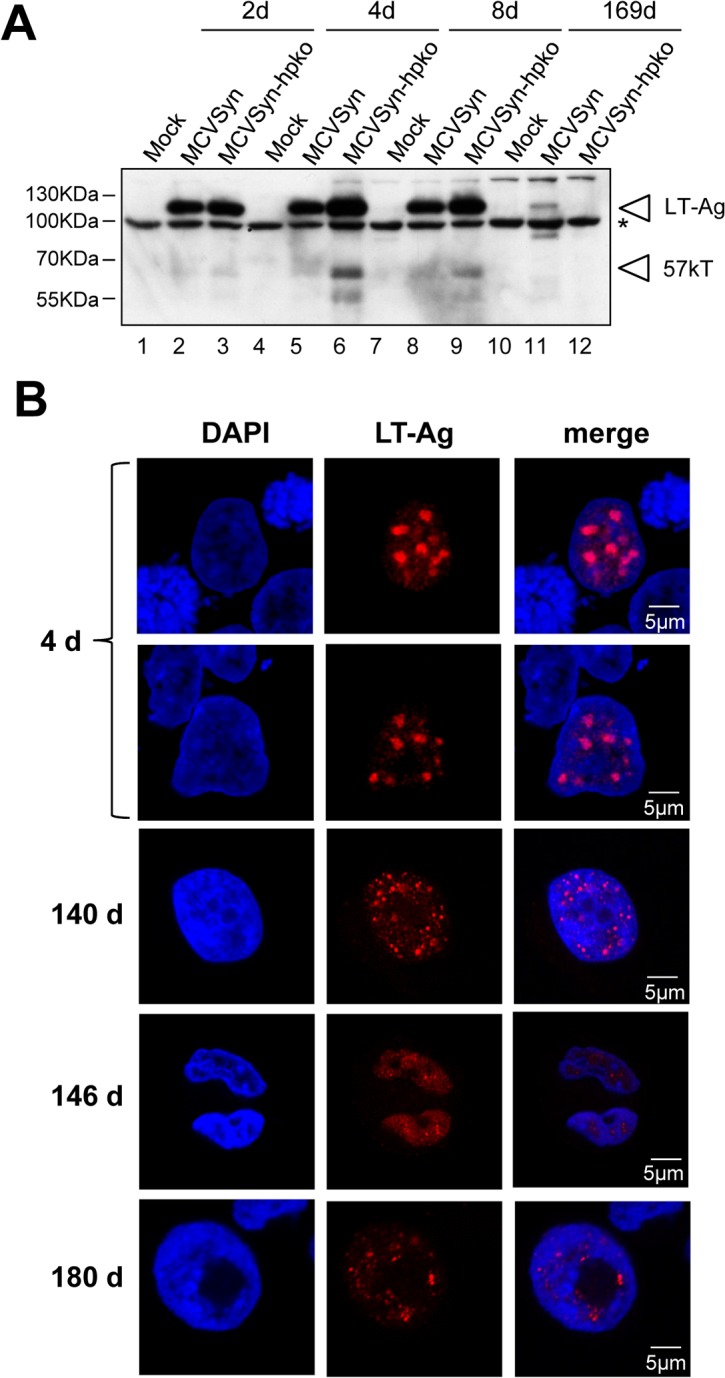
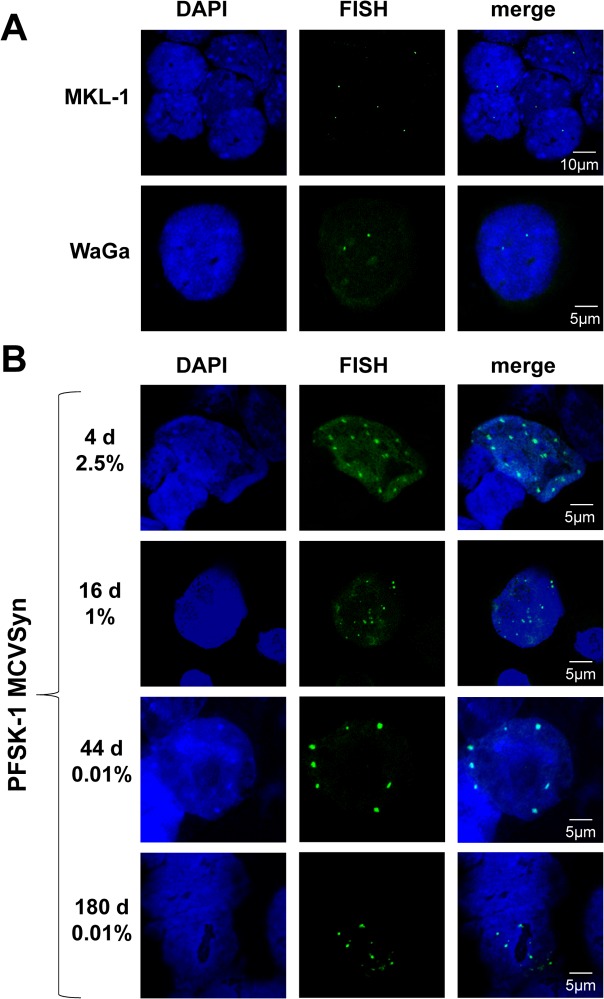
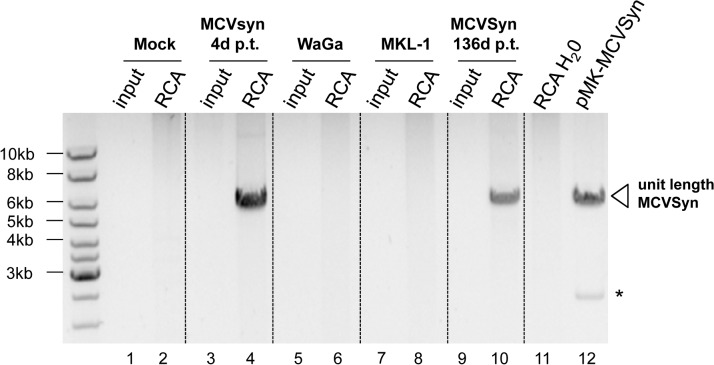
Merkel cell polyomavirus (MCPyV) is considered the etiological agent of Merkel cell carcinoma and persists asymptomatically in the majority of its healthy hosts. Largely due to the lack of appropriate model systems, the mechanisms of viral replication and MCPyV persistence remain poorly understood. Using a semi-permissive replication system, we here report a comprehensive analysis of the role of the MCPyV-encoded microRNA (miRNA) mcv-miR-M1 during short and long-term replication of authentic MCPyV episomes. We demonstrate that cells harboring intact episomes express high levels of the viral miRNA, and that expression of mcv-miR-M1 limits DNA replication. Furthermore, we present RACE, RNA-seq and ChIP-seq studies which allow insight in the viral transcription program and mechanisms of miRNA expression. While our data suggest that mcv-miR-M1 can be expressed from canonical late strand transcripts, we also present evidence for the existence of an independent miRNA promoter that is embedded within early strand coding sequences. We also report that MCPyV genomes can establish episomal persistence in a small number of cells for several months, a time period during which viral DNA as well as LT-Ag and viral miRNA expression can be detected via western blotting, FISH, qPCR and southern blot analyses. Strikingly, despite enhanced replication in short term DNA replication assays, a mutant unable to express the viral miRNA was severely limited in its ability to establish long-term persistence. Our data suggest that MCPyV may have evolved strategies to enter a non- or low level vegetative stage of infection which could aid the virus in establishing and maintaining a lifelong persistence.


Conflict of interest statement

The authors have declared that no competing interests exist.

Figures

Fig 1
Fig 1. Expression of mcv-miR-M1 by replicating MCPyV genomes.
(A) Top: Schematic illustration of the MCPyV genome. Early (light blue) and late (red) strand open reading frames as well as the mcv-miR-M1 locus are shown as solid block arrows. The 57K T-Ag ORF is not shown for simplicity. Bottom: Small RNA read coverage on early (positive axis) or late (negative axis) strands as observed in MCVSyn transfected PFSK-1 cells (NEBNext library preparation protocol). (B) Enlarged depiction of late strand coverage at the genomic mcv-miR-M1 locus as shown in (A). The regions producing the major 5p and 3p mature miRNAs are shown in bold and their seed sequences are underlined. The asterisk denotes a single nucleotide polymorphism that is frequently observed in MCPyV field strains. (C, D) Relative frequency of mature 5p (C) or 3p (D) mcv-miR-M1 reads containing the indicated seed sequences in small RNA libraries prepared with the NEBNext (left panels) or TruSeq (right panels) library preparation protocols.
Fig 2
Fig 2. A mcv-miR-M1 knockout mutant exhibits increased LT-Ag expression and enhanced viral DNA replication.
(A) Predicted secondary structures of the wt (left) and mutated (right) mcv-miR-M1 pre-miRNA sequences. Regions encoding mature miRNAs are shown in bold, mutated nucleotides are highlighted in red. (B) Small RNA Northern Blot analysis of mcv-miR-M1 expression 24 and 48 hours after transfection of MCVSyn (left panel) or MCVSyn-hpko (right panel) genomes. Mock transfected cells or cells transfected with a plasmid containing the mcv-miR-M1 pre-miRNA cloned behind a CMV promoter served as negative and positive controls, respectively. Positions of pre- and mature miRNAs are marked by arrows. (C) Western Blot analysis of LT antigen expression in PFSK-1 cells transfected with MCVSyn or MCVSyn-hpko at 4d post transfection. The position of LT-Ag is marked by an arrow. (D) Analysis of de novo replicated viral DNA by Southern Blot analysis of HIRT extracts prepared from PFSK-1 cells transfected with MCVSyn or MCVSyn-hpko genomes 4d post transfection. The position of DpnI-resistant replicated DNA is marked with an arrow. Faster migrating bands representing digestion products of the DpnI-sensitive input DNA are visible near the bottom of the blot.
Fig 3
Fig 3. Mapping of early and late strand polyadenylation sites.
(A) Schematic representation of early (blue) and late (red) strand polyadenylation sites as identified via 3’-RACE analysis. The location of nested gene specific primers is indicated by double arrows. Dashed arrows indicate individual clones recovered during 3’-RACE analysis for each of the strands. (B, C): Sequence representation of the identified polyadenylation on the early (B) and late (C) strands. The nucleotide after which cleavage occurs is marked by an arrow. Canonical polyadenlyation signals upstream of the cleavage sites are boxed. GU- or U-rich regions downstream of the cleavage sites are underlined with solid or dashed lines, respectively.
Fig 4
Fig 4. Mapping of early and late strand transcriptional initiation sites.
(A) Schematic depiction of the MCPyV genome. The binding sites of nested gene specific 5’-RACE primers for early and late strand are indicated by blue or red double arrows, respectively. The identified transcriptional initiation zones TI-E1 (early strand) or TI-L1 and –L2 (late strand) are shown as black arrows drawn towards the top or bottom, respectively. (B) Relative frequency of transcriptional initiation site (TIS) reads on the early (positive axis, blue) or late (negative axis, red) strands. (C) Detailed depiction of TIS coverage near the major early initiation zone TI-E1. A TATA box located upstream of TI-E1 is underlined. A minor initiation site upstream of the TATA box is marked with an asterisk. The T-Ag start codon is boxed and highlighted in yellow. (D) Depiction of TIS read coverage near the major late initiation zone TI-L1 (top panel), and a second initiation site outside of the NCCR (TI-L2, lower panel). The VP2 start codon is boxed and the first 9 nucleotides of the genomic mcv-miR-M1 locus are boxed and highlighted in yellow or grey, respectively.
Fig 5
Fig 5. mcv-miR-M1 can be expressed independently of NCCR-initiated late gene expression.
(A) Schematic illustration of heterologous mcv-miR-M1 constructs. pCMV:ER-AS and-S contain the entire early coding region in antisense (ER-AS) or sense orientation (ER-S) relative to the CMV promoter. pER contains the entire early coding region without an heterologous promoter. (B) Small RNA Northern Blot analysis of PFSK-1 cells after 2 days of transfection with the mcv-miR-M1 constructs shown in A. Blots from cells transfected with CMV constructs were exposed overnight. The blot from pER transfected cells was exposed for five days to facilitate visualization of miRNA signals. (C) Quantitative stem-loop RT-PCR for mcv-miR-M1-5p expression in PFSK-1 cells after 2 days of transfection with the mcv-miR-M1 constructs shown in A. (D) Quantitative RT-PCR for mcv-miR-M1-5p (right columns), GAPDH mRNA (center columns) or tRNA meth expression (left columns) in PFSK-1 cells after 2 days of transfection with construct pER. Expression of the indicated transcripts in the presence of α-amanitin (light grey bars) is displayed as mean values from three independent experiments relative to the expression in untreated control cells (black bars).
Fig 6
Fig 6. ChIP-seq analysis and miRNA expression in wt and mutated MCVSyn genomes.
(A) Schematic depiction of the MCPyV genome with polyadenylation and transcriptional initiation sites as identified by RACE analyses. The position of the viral core origin of replication (ori) is marked by a grey box. (B, E) ChIP-seq profiles of LT-Ag (top panel, blue), H3K4me3 (center panel, green) or the negative IgG control (bottom panel, grey) along the MCPyV genome in PFSK-1 cells after 4 days of transfection with MCVSyn (B) or MCVSyn-pmt (E). Positions of early and late transcriptional initiation sites are marked by bent arrows pointing right and left, respectively. The putative promoter region mutated in MCVSyn-pmt is symbolized by a vertically hatched box in E. Graphs depict raw ChIP-seq read coverage; note that absolute read numbers depend on the efficiency of individual immunoprecipitations and thus only the relative coverage distribution along the viral genome is meaningful. (C) Mutations in the putative promoter region upstream of the mcv-miR-M1 locus. Substituted nucleotides are shown in red. The positions of the transcriptional initiation site TI-L2 is indicated by an arrow. The first four nucleotides of the mcv-miR-M1 locus are boxed in gray. (D) Quantitative stem-loop RT-PCR evaluation of mcv-miR-M1-5p expression in PFSK-1 cells after 4 days of transfection with MCVSyn (left), MCVSyn-pmt (center), or MCVSyn-hpko (negative control, right). Expression levels were normalized to the number of MCVSyn genomes per cell as determined by qPCR from genomic DNA. Mean values and standard deviations were calculated from three independent experiments. mcv-miR-M1 expression in MCVSyn-pmt is significantly decreased in comparison to MCVSyn (unpaired t-test).
Fig 7
Fig 7. RNA-seq analysis of replicating MCPyV genomes.
(A) Schematic depiction of the MCPyV genome. (B, C) RNA-seq coverage of MCVSyn (B) or MCVSyn-hpko (C) genomes in PFSK-1 cells after 4 days of transfection. Read coverage on the early (positive axis; blue) or late strand (negative axis; red) is shown relative to the maximally observed nucleotide coverage (set to 100%). Note that the negative/late strand axis is shown at a lower scale in C to facilitate comparison of late strand read coverage profiles. (D, E) Structure of known or predicted early (D) or late (E) transcripts. The position of donor or acceptor sites is indicated by vertically drawn hatched lines. Previously identified donors or acceptors are marked with asterisks. Known or predicted protein products and estimated abundance values are given next to all transcripts that map to the major early or late transcription cassettes (T1-T’7 and L1-L3, respectively). We did not estimate abundance for transcripts that contain splice junctions with donors or acceptors located outside of the major transcriptional units (T’8, T’9, LL, L’4). For simplicity, regions of transcripts which are of unknown structure, or that may display splice patterns which are of no immediate consequence for coding potential are symbolized by horizontal hatched lines. Coding regions (first AUG-initiated ORF) in each of the transcripts are shown by boxes that are colored according to reading frame relative to the genomic position of major early or late transcriptional start positions (149 and 5245, respectively).
Fig 8
Fig 8. A mcv-miR-M1 knockout mutant is impaired in long-term persistence.
(A) Normalized MCVSyn copy numbers (relative to day 2; blue filled diamonds, left axis) or mcv-miR-M1 expression levels (black asterisks, right axis) as measured by qPCR from genomic DNA or stem-loop RT-PCR of long-term PFSK-1 cultures transfected with MCVSyn. All values were normalized to genomic GAPDH copy numbers; note that values thus will reflect changes in the overall percentage of positive cells as well as changes of episome numbers per positive cell. (B) GAPDH-normalized MCVSyn (blue symbols, reproduced from A) or MCVSyn-hpko (red symbols) copy numbers (relative to day 2) in long-term PFSK-1 cultures. Data points were fitted with exponential regression lines (blue or red for MCVSyn or MCVSyn-hpko, respectively) to illustrate the overall trend of copy number changes. (C) Southern Blot analysis for the detection of replicated viral DNA of HIRT extracts from MCVSyn (top panel) or MCVSyn-hpko (lower panel). Blots were performed with the same cultures shown in A and B. (D and E) Independent repeats of long-term genome maintenance assays in MCVSyn or MCVSyn-hpko-transfected PFSK-1 cells. The initial percentage of transfected cells in PFSK-1:MCVSyn as well as PFSK-1:MCVSyn-hpko cultures was between 2 and 3% for all three experiments shown in this figure. MCVSyn or MCVSyn-hpko-transfected cultures did not exhibit gross growth differences and were subcultured at the same intervals.
Fig 9
Fig 9. LT antigen expression in long term cultures of MCVSyn or MCVSyn-hpko transfected PFSK-1 cells.
(A) Western blot analysis and (B) confocal laser scanning immunofluorescence microscopy of PFSK-1 cells transfected with MCVSyn or MCVSyn-hpko and analyzed at the indicated time points. Material was derived from the same cultures shown in Fig 8A to 8C. The asterisk in (A) denotes the position of an unspecific background band. Antibody CM2B4 recognizes LT-Ag as well as the alternative splice product 57k T. The positions of both protein bands are indicated by arrowheads.
Fig 10
Fig 10. FISH analysis of MCPyV genome in MCC cell lines and long term cultures of MCVSyn transfected cells.
(A) FISH analysis (center) and Dapi staining (left) of the MCPyV positive MCC cell lines MKL-1 and WaGa. (B) Analysis of MCVSyn wt transfected PFSK-1 cells at early and late time points after initial transfection. The estimated percentage of MCVSyn positive cells is indicated for each time point.
Fig 11
Fig 11. RCA analysis suggests episomal persistence of MCVSyn genomes.
Inverted image of a ethidium bromide-stained agarose gel with input material (lanes 1,3,5,7 and 9) or RCA products (lanes 2,4,6,8, 10 and 11) from mock-transfected PFSK-1 cells (lanes 1 and 2), MCVSyn-transfected PFSK-1 cells at 4 days (lanes 3 and 4) or 136 days (lanes 9 and 10) post transfection, the MCC-derived cell lines WaGa or MKL-1 (lanes 5 and 6 or 7 and 8, respectively) or a water control (lane 11). DNA was subjected to restriction enzyme digestion to produce linear, unit-length viral genomes from concatameric RCA products. For size comparison, lane 12 shows unit length MCVSyn genomes excised from plasmid pMK-MCVSyn. The asterisk marks the position of the bacterial pMK plasmid backbone.

Similar articles

Cited by

References

    1. Feng H, Shuda M, Chang Y, Moore PS. Clonal integration of a polyomavirus in human Merkel cell carcinoma. Science. 2008;319(5866):1096–100. 10.1126/science.1152586 - DOI - PMC - PubMed
    1. Chang Y, Moore PS. Merkel cell carcinoma: a virus-induced human cancer. Annu Rev Pathol. 2012;7:123–44. 10.1146/annurev-pathol-011110-130227 - DOI - PMC - PubMed
    1. Tolstov YL, Pastrana DV, Feng H, Becker JC, Jenkins FJ, Moschos S, et al. Human Merkel cell polyomavirus infection II. MCV is a common human infection that can be detected by conformational capsid epitope immunoassays. Int J Cancer. 2009;125(6):1250–6. 10.1002/ijc.24509 - DOI - PMC - PubMed
    1. Schowalter RM, Pastrana DV, Pumphrey KA, Moyer AL, Buck CB. Merkel cell polyomavirus and two previously unknown polyomaviruses are chronically shed from human skin. Cell Host Microbe. 2010;7(6):509–15. 10.1016/j.chom.2010.05.006 - DOI - PMC - PubMed
    1. Chen T, Hedman L, Mattila PS, Jartti T, Ruuskanen O, Soderlund-Venermo M, et al. Serological evidence of Merkel cell polyomavirus primary infections in childhood. J Clin Virol. 2011;50(2):125–9. 10.1016/j.jcv.2010.10.015 - DOI - PubMed

Publication types

MeSH terms

LinkOut - more resources