. 2015 Jul 28:5:12520.
doi: 10.1038/srep12520.

PKCζ Promotes Breast Cancer Invasion by Regulating Expression of E-cadherin and Zonula Occludens-1 (ZO-1) via NFκB-p65

Affiliations

PKCζ Promotes Breast Cancer Invasion by Regulating Expression of E-cadherin and Zonula Occludens-1 (ZO-1) via NFκB-p65

Arindam Paul et al. Sci Rep. .

Abstract

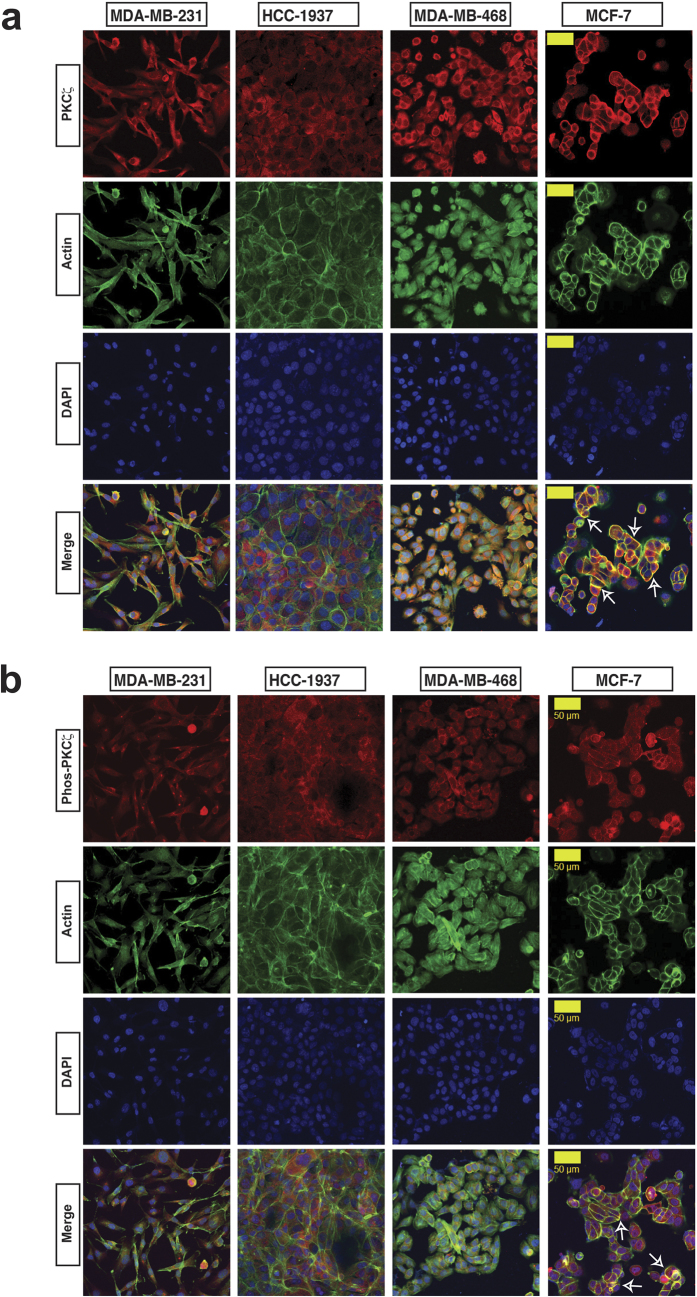
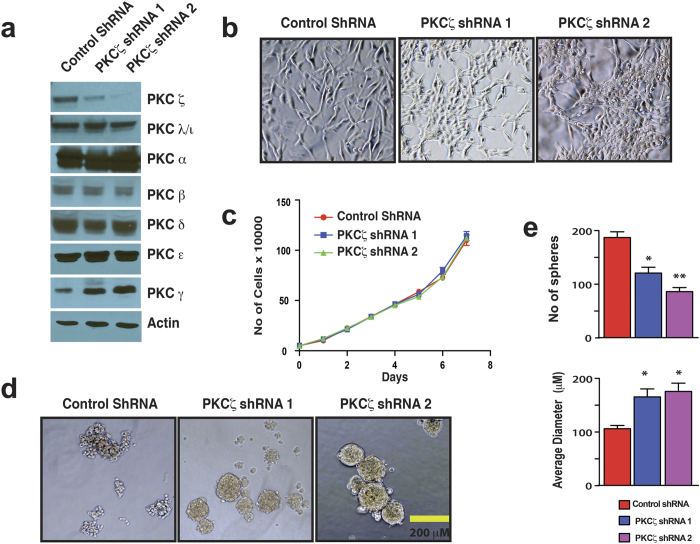
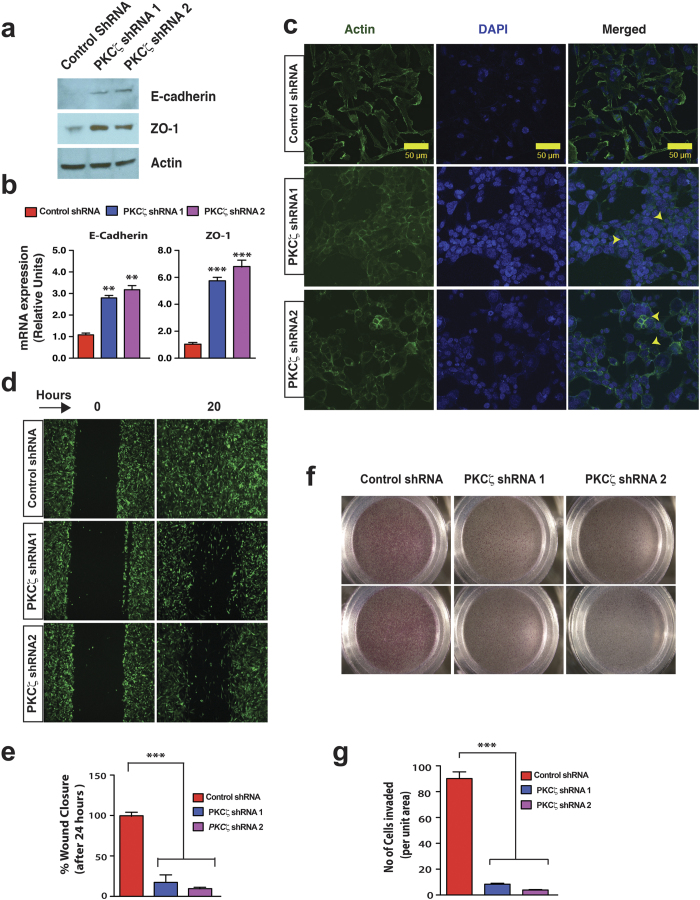
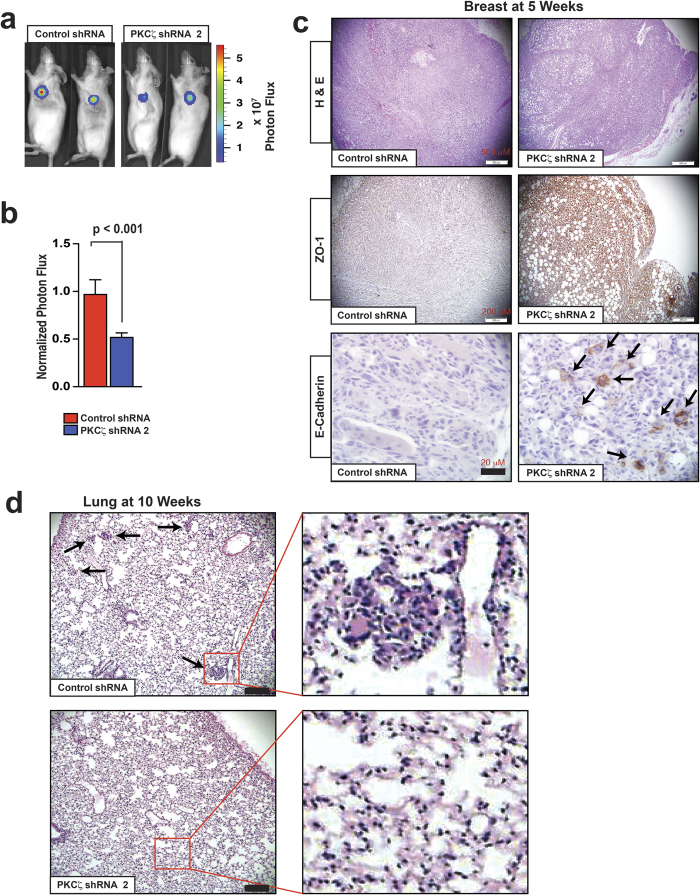
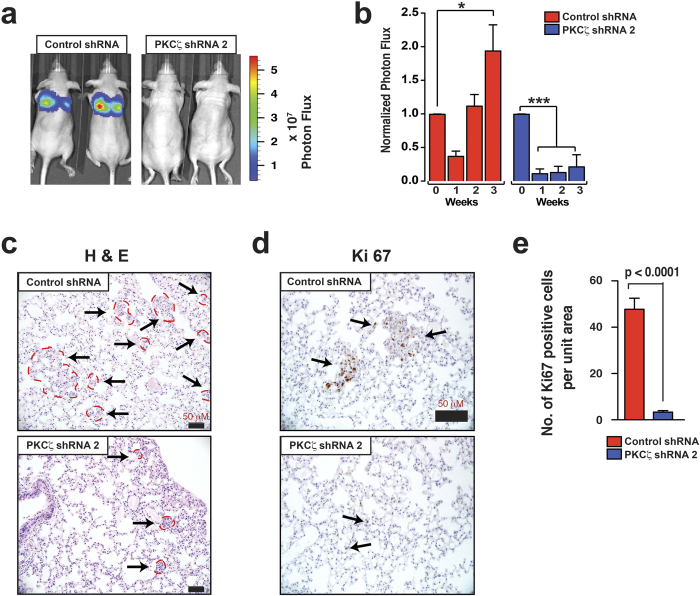
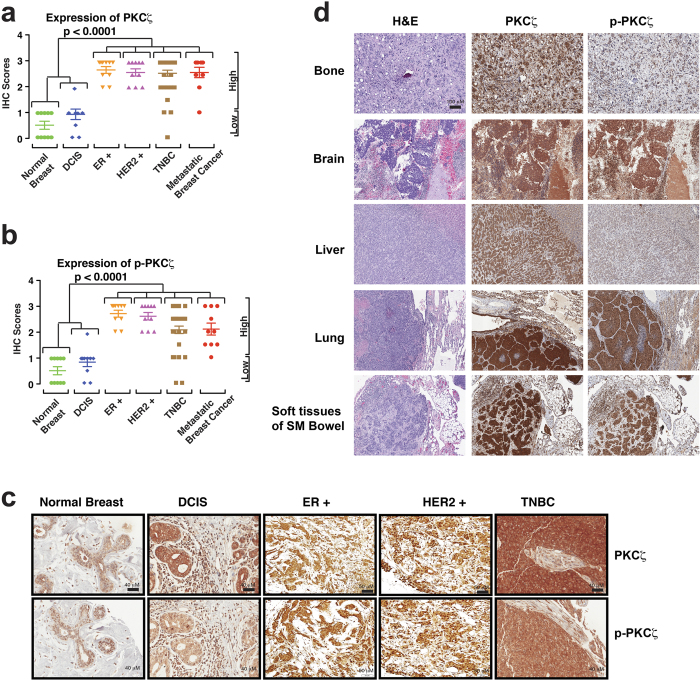
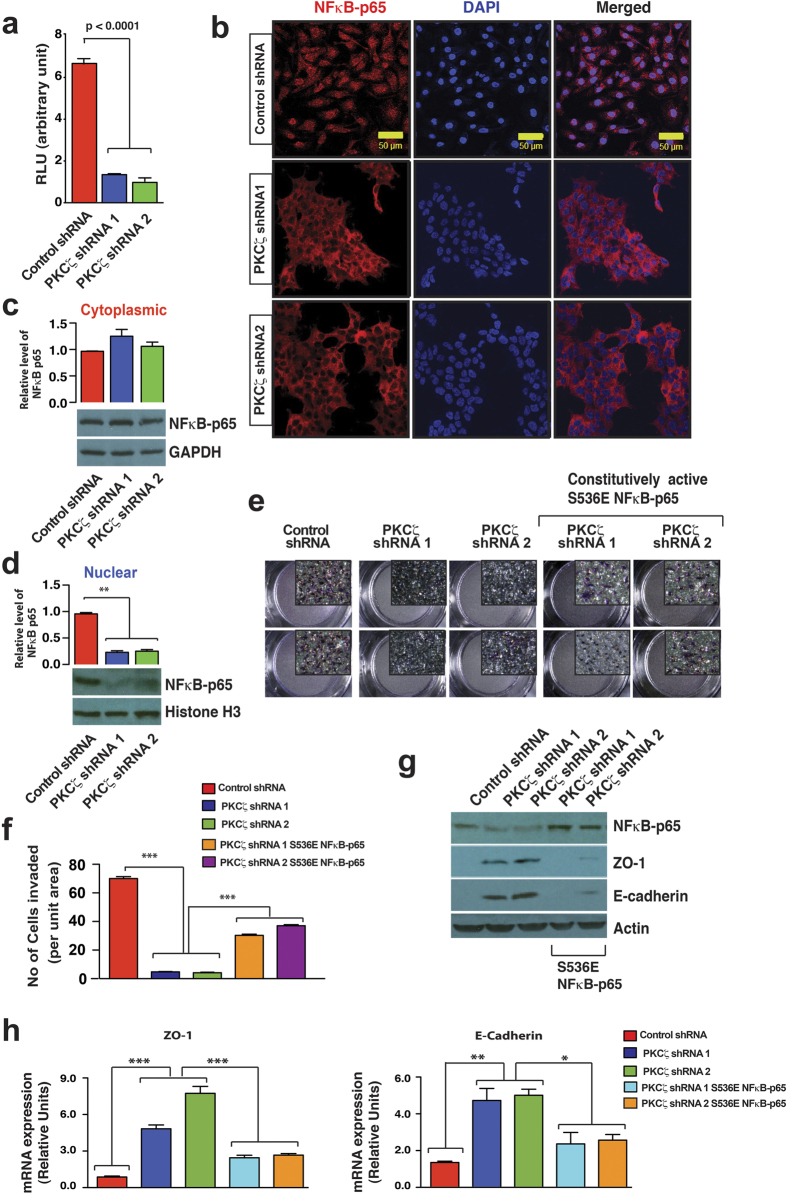
Atypical Protein Kinase C zeta (PKCζ) forms Partitioning-defective (PAR) polarity complex for apico-basal distribution of membrane proteins essential to maintain normal cellular junctional complexes and tissue homeostasis. Consistently, tumor suppressive role of PKCζ has been established for multiple human cancers. However, recent studies also indicate pro-oncogenic function of PKCζ without firm understanding of detailed molecular mechanism. Here we report a possible mechanism of oncogenic PKCζ signaling in the context of breast cancer. We observed that depletion of PKCζ promotes epithelial morphology in mesenchymal-like MDA-MB-231 cells. The induction of epithelial morphology is associated with significant upregulation of adherens junction (AJ) protein E-cadherin and tight junction (TJ) protein Zonula Occludens-1 (ZO-1). Functionally, depletion of PKCζ significantly inhibits invasion and metastatic progression. Consistently, we observed higher expression and activation of PKCζ signaling in invasive and metastatic breast cancers compared to non-invasive diseases. Mechanistically, an oncogenic PKCζ- NFκB-p65 signaling node might be involved to suppress E-cadherin and ZO-1 expression and ectopic expression of a constitutively active form of NFκB-p65 (S536E-NFκB-p65) significantly rescues invasive potential of PKCζ-depleted breast cancer cells. Thus, our study discovered a PKCζ - NFκB-p65 signaling pathway might be involved to alter cellular junctional dynamics for breast cancer invasive progression.


Figures

Figure 1
Figure 1. PKCζ Signaling in Breast Cancer Cells.
Expression of PKCζ (a) and phospho-PKCζ (b) in basal-like MDA-MB-231, HCC-1937, and MDA-MB-468 cells in comparison with luminal MCF-7 cells. Expression of PKCζ and phospho-PKCζ showed in red, actin in green and nuclear staining showed by DAPI. Yellow scale bar 50 μM. White arrows indicated localization of PKCζ and phospho-PKCζ at the plasma membrane domains of MCF-7 cells.
Figure 2
Figure 2. PKCζ Signaling Regulates Cell-Cell Adhesion in Breast Cancer Cells.
(a) Western blot analysis indicating specific knockdown of PKCζ in MDA-MB-231 cells. (b) Morphologies of MDA-MB-231 cell with and without PKCζ depletion. (c) Specific depletion of PKCζ has no effect on cell proliferation. (d) Morphologies of MDA-MB-231 cell aggregates with and without PKCζ depletion. (e) Quantification of number of MDA-MB-231 cell aggregates and their size with and without PKCζ depletion. Results represent means ± S.E.M. P values were calculated one-way ANOVA with Bonferroni post-test. *P values ≤ 0.01, **P values ≤ 0.001, ***P values ≤ 0.0001.
Figure 3
Figure 3. PKCζ Signaling Regulates Cell-Cell Junction Dynamics and Invasion.
(a) Western blot analysis of E-cadherin and ZO-1 after specific knockdown of PKCζ in MDA-MB-231 cells. (b) Quantitative RT-PCR measurements of E-cadherin and ZO-1 after specific knockdown of PKCζ in MDA-MB-231 cells. Results represent means ± S.E.M. P values were calculated by two-tailed unpaired Student’s t test. **P values ≤ 0.01, ***P values ≤ 0.001. (c) Rearrangement of actin in MDA-MB-231 cells with and without PKCζ depletion. Specific knockdown of PKCζ in MDA-MB-231 cells induced appearance of cortical actin showed by yellow arrowheads. Scale bar 50 μM. (d) Wound closure assays of PKCζ-depleted MDA-MB-231 cells. (e) Quantification of wound closure assays (n = 3). (f) Transwell invasion of PKCζ-depleted MDA-MB-231 cells. (g) Quantification of invasion assays (each field was divided into 9 unit areas and 3 fields per condition). For all quantifications, results represent means ± S.E.M. P values were calculated by two-tailed unpaired Student’s t test. ***P values ≤ 0.001.
Figure 4
Figure 4. Depletion of PKCζ Inhibits Breast Cancer Metastasis.
(a) Representative whole-animal images at five weeks after orthotopic transplantation of MDA-MB-231-luc cells with and without PKCζ depletion. (b) Quantification of tumor growth via luminescence measurements at five weeks after orthotopic transplantation (n = 8). Results represent means ± S.E.M. P values were calculated one-way ANOVA with Bonferroni post-test. (c) H&E and immunohistochemical analysis of ZO-1 and E-cadherin expression in xenograft breast tumors removed at five weeks after orthotopic transplantation. The mice were kept alive for another five weeks for spontaneous metastasis to lung. Black arrows indicate expression of E-cadherin. (d) H&E staining of lung tissues at 10 weeks after orthotopic transplantation. Black arrows showed lung colonization and outlined areas by indicated red squares represent the higher magnification images in right panels.
Figure 5
Figure 5. Depletion of PKCζ Inhibits Lung Metastatic Colonization.
(a) Representative whole-animal images at three weeks after intravenous transplantation (via tail vein) of MDA-MB-231-luc cells with and without PKCζ depletion. (b) Quantification of metastatic lung colonization via luminescence measurements (n = 5). Results represent means ± S.E.M. P values were calculated using one-way ANOVA with Bonferroni post-test. *P values ≤ 0.01, **P values ≤ 0.001, ***P values ≤ 0.0001. (c) H&E staining of lung tissues three weeks after intravenous transplantation. Indicated regions by perforated red lines and arrows showed lung colonization. Scale bar 50 μM. (d) Ki-67 staining of lung tissues at three weeks post-transplantation. Scale bar 50 μM. (e) Quantification of Ki67 staining (n = 12). Results represent means ± S.E.M. P values were calculated by one-way ANOVA with Bonferroni post-test.
Figure 6
Figure 6. Aggressive Breast Cancers Are Associated With Higher Expression and Activation of PKCζ.
Expression of PKCζ (a) and phospho-PKCζ (b) in human normal breast, DCIS, IDCs (ER+, HER2+, and TNBC), and metastatic breast cancer samples. Results were expressed as IHC scores of individual samples (by two independent pathologists) using a scale 0 to 3. IHC scores in between 0 to 1 considered as low expression whereas IHC scores >1 considered as high expression. Majority of IDCs and metastatic breast cancer samples showed high expression of PKCζ and phospho-PKCζ. P-values were calculated by two-way ANOVA with Bonferroni post-test. (c) Representative images showing expression and localization of PKCζ and phospho-PKCζ in normal breast, DCIS, and IDCs with ER+, HER2+, and triple negative status. Expression of PKCζ and phospho-PKCζ gradually increased from normal breast to DCIS, and significantly increased in IDC and metastatic breast cancer samples. (d) Expression of PKCζ and phospho-PKCζ in human metastatic breast cancers. Scale bar 100 μM.
Figure 7
Figure 7. Involvement of PKCζ-NFκB Regulatory Axis.
(a) NFκB reporter gene assay of MDA-MB-231 cells with and without PKCζ depletion (n = 3). Results represent means ± S.E.M. P values were calculated using two-tailed unpaired Student’s t test. (b) Localization of NFκB-p65 in MDA-MB-231 cells with and without PKCζ depletion. Expression of NFκB-p65 showed in red and nuclear staining showed by DAPI. Scale bar, 50 μM. Western blot analysis of cytolasmic NFκB-p65 (c) and nuclear NFκB-p65 (d) expression level after PKCζ depletion indicating impaired NFκB-p65 nuclear translocation. For quantification, results represent means ± S.E.M. (n = 3) and P value was calculated using one-way ANOVA with Bonferroni post-test. (e) Rescue of invasive potential in PKCζ-depleted MDA-MB-231 cells via ectopic expression of constitutively active S536E NFκB-p65 mutant. Inset represents higher magnification image of the corresponding transwell filter. (f) Quantification of invasion assay performed by counting cells present per unit area (each field was divided into 9 unit areas and 3 fields per condition) indicating significant rescue of invasion. For all quantifications, results represent means ± S.E.M. (n = 3). P values were calculated by one-way ANOVA with Bonferroni post-test. *P values ≤ 0.05, **P values ≤ 0.01, ***P values ≤ 0.001. (g) Western blot analysis of NFκB-p65, ZO-1, E-cadherin, and Actin after ectopic expression of a constitutively active S536E NFκB-p65 mutant in PKCζ-depleted MDA-MB-231 cells. (h) Quantitative RT-PCR measurements of ZO-1 and E-cadherin after ectopic expression of a constitutively active S536E NFκB-p65 mutant in PKCζ-depleted MDA-MB-231 cells. Results represent means ± S.E.M. P values were calculated by two-tailed unpaired Student’s t test. *P values ≤ 0.05, **P values ≤ 0.01, ***P values ≤ 0.001.

References

    1. Hutchinson L. Breast cancer: challenges, controversies, breakthroughs. Nat Rev Clin Oncol 7, 669–670, nrclinonc.2010.19210.1038/nrclinonc.2010.192 (2010). - PubMed
    1. Hennessy B. T. et al. Characterization of a naturally occurring breast cancer subset enriched in epithelial-to-mesenchymal transition and stem cell characteristics. Cancer Res 69, 4116–4124, 0008-5472.CAN-08-344110.1158/0008-5472.CAN-08-3441 (2009). - PMC - PubMed
    1. Perou C. M. et al. Molecular portraits of human breast tumours. Nature 406, 747–752, 10.1038/35021093 (2000). - DOI - PubMed
    1. Sorlie T. et al. Gene expression patterns of breast carcinomas distinguish tumor subclasses with clinical implications. Proc Natl Acad Sci USA 98, 10869–10874, 10.1073/pnas.19136709898/19/10869 (2001). - DOI - PMC - PubMed
    1. Sotiriou C. et al. Breast cancer classification and prognosis based on gene expression profiles from a population-based study. Proc Natl Acad Sci USA 100, 10393–10398, 10.1073/pnas.17329121001732912100 (2003). - DOI - PMC - PubMed

Publication types

MeSH terms