

CT protocol management: simplifying the process by using a master protocol concept
- PMID: 26219005
- PMCID: PMC5690004
- DOI: 10.1120/jacmp.v16i4.5412
CT protocol management: simplifying the process by using a master protocol concept
Abstract
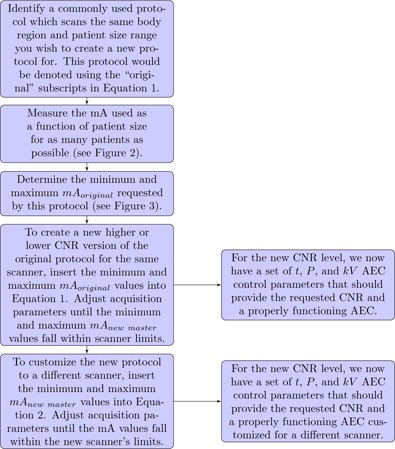
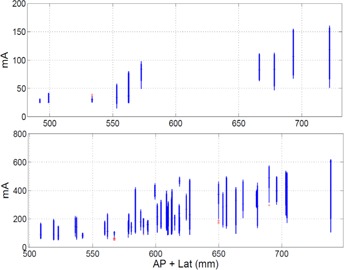
This article explains a method for creating CT protocols for a wide range of patient body sizes and clinical indications, using detailed tube current information from a small set of commonly used protocols. Analytical expressions were created relating CT technical acquisition parameters which can be used to create new CT protocols on a given scanner or customize protocols from one scanner to another. Plots of mA as a function of patient size for specific anatomical regions were generated and used to identify the tube output needs for patients as a function of size for a single master protocol. Tube output data were obtained from the DICOM header of clinical images from our PACS and patient size was measured from CT localizer radiographs under IRB approval. This master protocol was then used to create 11 additional master protocols. The 12 master protocols were further combined to create 39 single and multiphase clinical protocols. Radiologist acceptance rate of exams scanned using the clinical protocols was monitored for 12,857 patients to analyze the effectiveness of the presented protocol management methods using a two-tailed Fisher's exact test. A single routine adult abdominal protocol was used as the master protocol to create 11 additional master abdominal protocols of varying dose and beam energy. Situations in which the maximum tube current would have been exceeded are presented, and the trade-offs between increasing the effective tube output via 1) decreasing pitch, 2) increasing the scan time, or 3) increasing the kV are discussed. Out of 12 master protocols customized across three different scanners, only one had a statistically significant acceptance rate that differed from the scanner it was customized from. The difference, however, was only 1% and was judged to be negligible. All other master protocols differed in acceptance rate insignificantly between scanners. The methodology described in this paper allows a small set of master protocols to be adapted among different clinical indications on a single scanner and among different CT scanners.
Figures


References
-
- AAPM. CT Lexicon ver. 1.3; 2012. Available from: http://www.aapm.org/pubs/CTProtocols/documents/CTTerminologyLexicon.pdf
-
- Keat N. CT scanner automatic exposure control systems. Report 05016. London: ImPACT; 2005.
-
- Gutierrez D, Schmidt S, Denys A, Schnyder P, Bochud FO, Verdun FR. CT‐automatic exposure control devices: What are their performances? Nucl Instrum Meth Phys Res A. 2007;580(2):990–95.
-
- Gudjonsdottir J, Ween B, Olsen DR. Optimal use of AEC in CT: a literature review. Radiol Technol. 2010;81(4):309–17. - PubMed
-
- Gudjonsdottir J, Svensson J, Campling S, Brennan P, Jonsdottir B. Efficient use of automatic exposure control systems in computed tomography requires correct patient positioning. Acta Radiol. 2009;50(9):1035–41. - PubMed
Publication types
MeSH terms
LinkOut - more resources
Full Text Sources
Other Literature Sources
Medical
