

Mortality, Hospitalizations, and Expenditures for the Medicare Population Aged 65 Years or Older, 1999-2013
- PMID: 26219053
- PMCID: PMC5459402
- DOI: 10.1001/jama.2015.8035
Mortality, Hospitalizations, and Expenditures for the Medicare Population Aged 65 Years or Older, 1999-2013
Erratum in
-
Lines Omitted From Table.JAMA. 2015 Aug 25;314(8):837. doi: 10.1001/jama.2015.10005. JAMA. 2015. PMID: 26305662 No abstract available.
Abstract
Importance: In a period of dynamic change in health care technology, delivery, and behaviors, tracking trends in health and health care can provide a perspective on what is being achieved.
Objective: To comprehensively describe national trends in mortality, hospitalizations, and expenditures in the Medicare fee-for-service population between 1999 and 2013.
Design, setting, and participants: Serial cross-sectional analysis of Medicare beneficiaries aged 65 years or older between 1999 and 2013 using Medicare denominator and inpatient files.
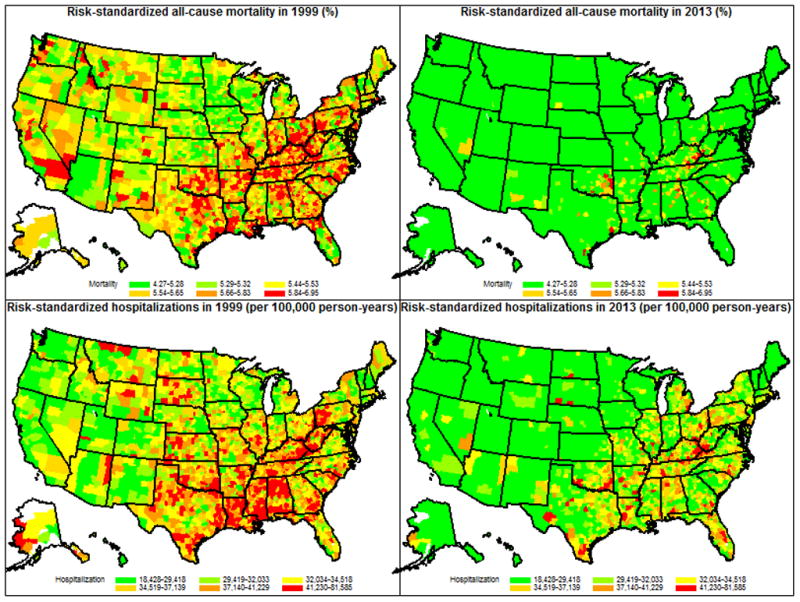
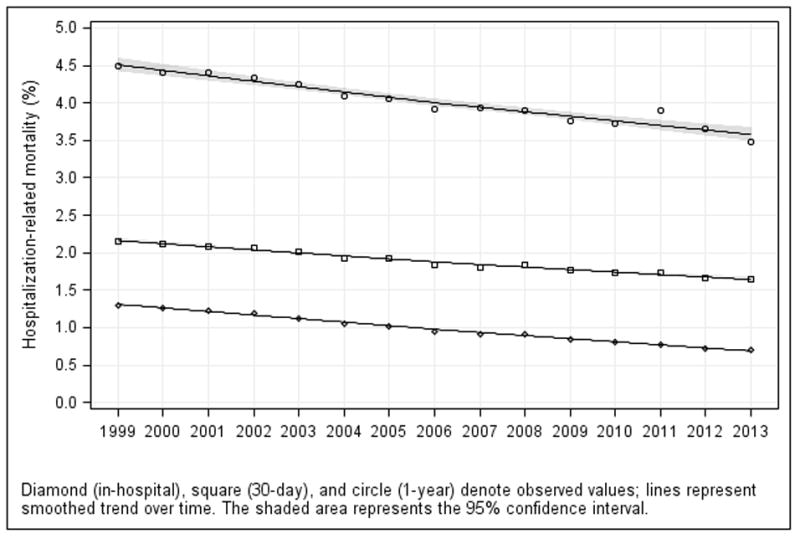
Main outcomes and measures: For all Medicare beneficiaries, trends in all-cause mortality; for fee-for-service beneficiaries, trends in all-cause hospitalization and hospitalization-associated outcomes and expenditures. Geographic variation, stratified by key demographic groups, and changes in the intensity of care for fee-for-service beneficiaries in the last 1, 3, and 6 months of life were also assessed.
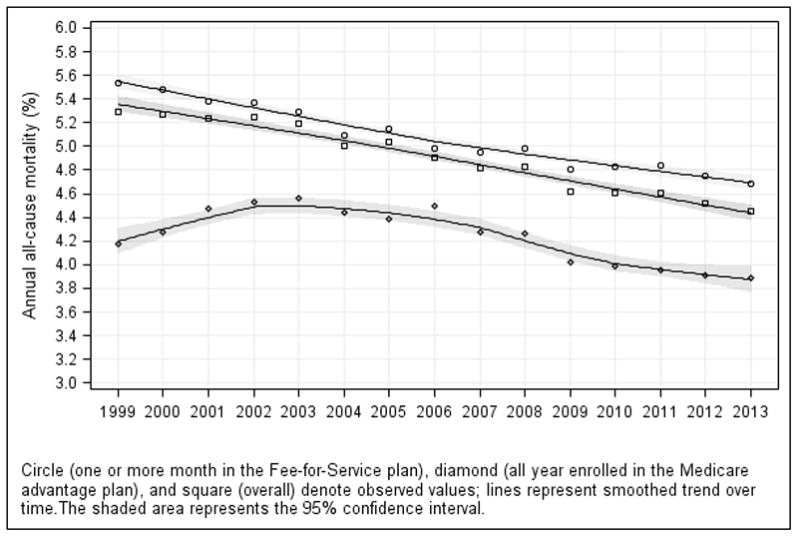
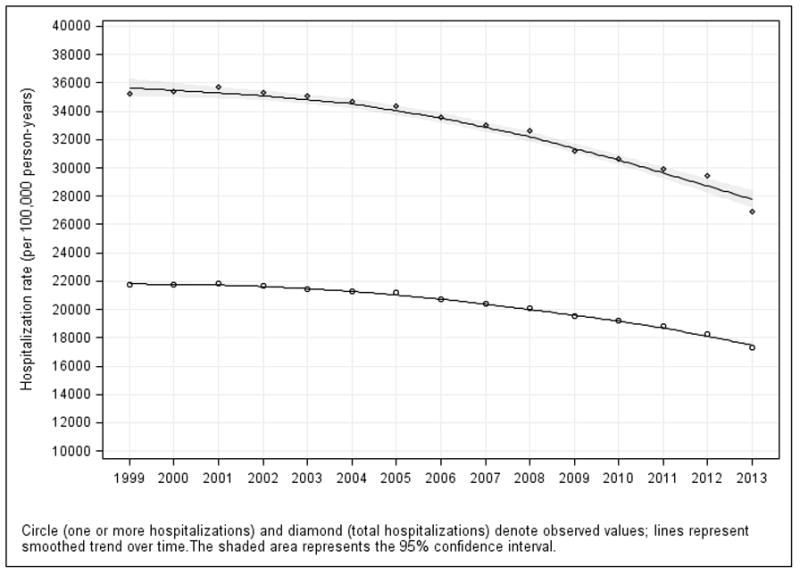
Results: The sample consisted of 68,374,904 unique Medicare beneficiaries (fee-for-service and Medicare Advantage). All-cause mortality for all Medicare beneficiaries declined from 5.30% in 1999 to 4.45% in 2013 (difference, 0.85 percentage points; 95% CI, 0.83-0.87). Among fee-for-service beneficiaries (n = 60,056,069), the total number of hospitalizations per 100,000 person-years decreased from 35,274 to 26,930 (difference, 8344; 95% CI, 8315-8374). Mean inflation-adjusted inpatient expenditures per Medicare fee-for-service beneficiary declined from $3290 to $2801 (difference, $489; 95% CI, $487-$490). Among fee-for-service beneficiaries in the last 6 months of life, the number of hospitalizations decreased from 131.1 to 102.9 per 100 deaths (difference, 28.2; 95% CI, 27.9-28.4). The percentage of beneficiaries with 1 or more hospitalizations decreased from 70.5 to 56.8 per 100 deaths (difference, 13.7; 95% CI, 13.5-13.8), while the inflation-adjusted inpatient expenditure per death increased from $15,312 in 1999 to $17,423 in 2009 and then decreased to $13,388 in 2013. Findings were consistent across geographic and demographic groups.
Conclusions and relevance: Among Medicare fee-for-service beneficiaries aged 65 years or older, all-cause mortality rates, hospitalization rates, and expenditures per beneficiary decreased from 1999 to 2013. In the last 6 months of life, total hospitalizations and inpatient expenditures decreased in recent years.
Figures
Comment in
-
Medicare outcomes have improved markedly over past two decades, study indicates.BMJ. 2015 Jul 29;351:h4124. doi: 10.1136/bmj.h4124. BMJ. 2015. PMID: 26224202 No abstract available.
-
Use of Observation Stays in Calculating Hospitalizations Among Medicare Beneficiaries.JAMA. 2015 Dec 22-29;314(24):2690-1. doi: 10.1001/jama.2015.15049. JAMA. 2015. PMID: 26720030 No abstract available.
-
Use of Observation Stays in Calculating Hospitalizations Among Medicare Beneficiaries--Reply.JAMA. 2015 Dec 22-29;314(24):2691. doi: 10.1001/jama.2015.15064. JAMA. 2015. PMID: 26720032 No abstract available.
-
Re: Mortality, Hospitalizations, and Expenditures for the Medicare Population Aged 65 Years or Older, 1999-2013.J Urol. 2016 Apr;195(4 Pt 1):1078-9. doi: 10.1016/j.juro.2015.12.013. Epub 2015 Dec 10. J Urol. 2016. PMID: 27302814 No abstract available.
References
-
- Krumholz HM, Wang Y, Mattera JA, et al. An administrative claims model suitable for profiling hospital performance based on 30-day mortality rates among patients with heart failure. Circulation. 2006;113(13):1693–1701. - PubMed
-
- Krumholz HM, Wang Y, Mattera JA, et al. An administrative claims model suitable for profiling hospital performance based on 30-day mortality rates among patients with an acute myocardial infarction. Circulation. 2006;113(13):1683–1692. - PubMed
-
- [Accessed June 19, 2015];Surgical Care Improvement Project. http://www.jointcommission.org/surgical_care_improvement_project/
-
- CPI Inflation Calculator. [Accessed June 19, 2015];2014 http://www.bls.gov/data/inflation_calculator.htm.
Publication types
MeSH terms
Grants and funding
LinkOut - more resources
Full Text Sources
Other Literature Sources
Medical
