

Multiple Trigger Points for Quantifying Heat-Health Impacts: New Evidence from a Hot Climate
- PMID: 26219102
- PMCID: PMC4749077
- DOI: 10.1289/ehp.1409119
Multiple Trigger Points for Quantifying Heat-Health Impacts: New Evidence from a Hot Climate
Abstract
Background: Extreme heat is a public health challenge. The scarcity of directly comparable studies on the association of heat with morbidity and mortality and the inconsistent identification of threshold temperatures for severe impacts hampers the development of comprehensive strategies aimed at reducing adverse heat-health events.
Objectives: This quantitative study was designed to link temperature with mortality and morbidity events in Maricopa County, Arizona, USA, with a focus on the summer season.
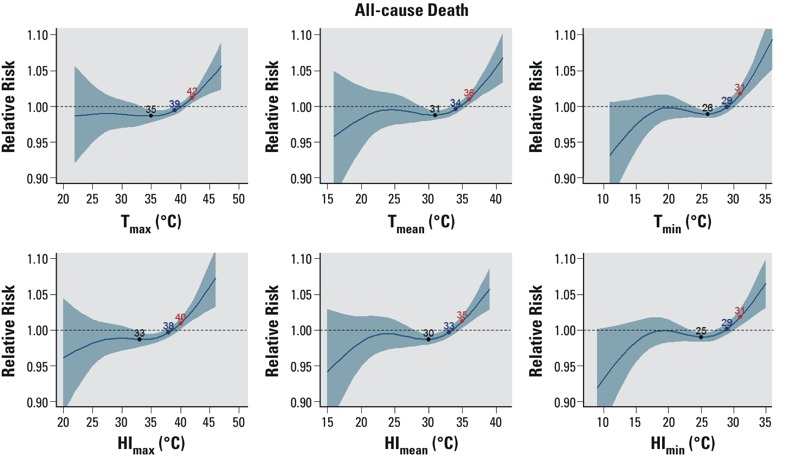
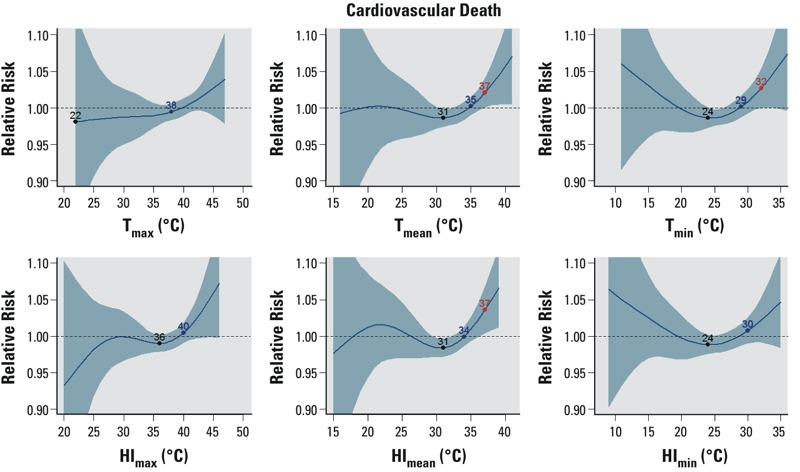
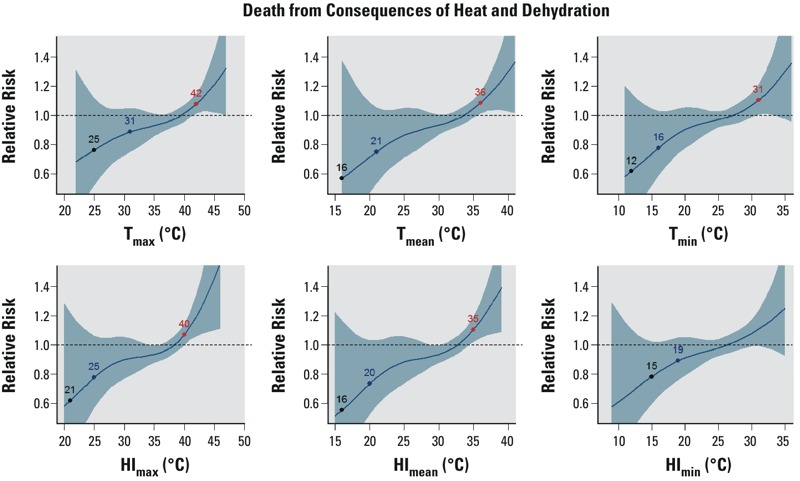
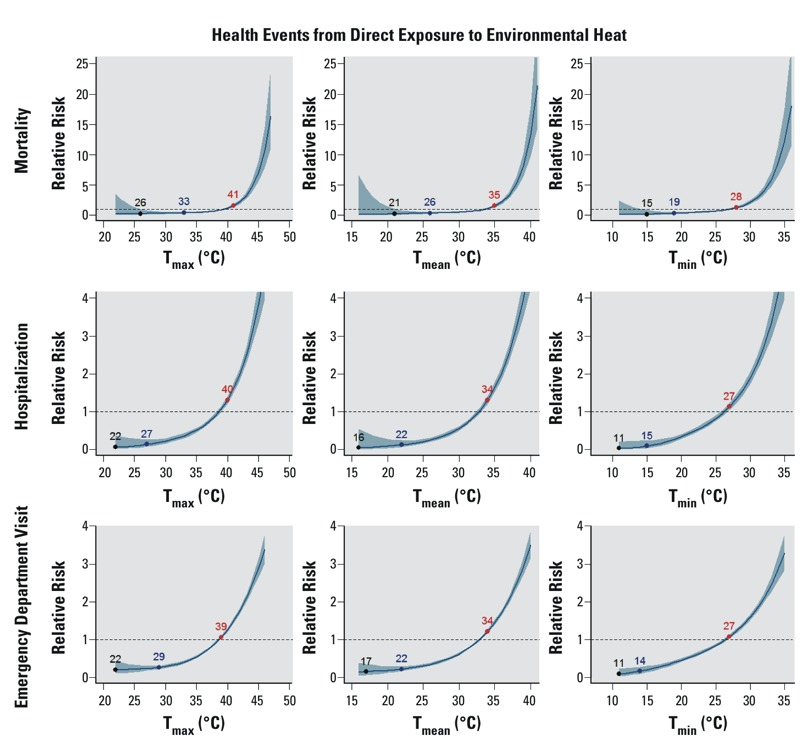
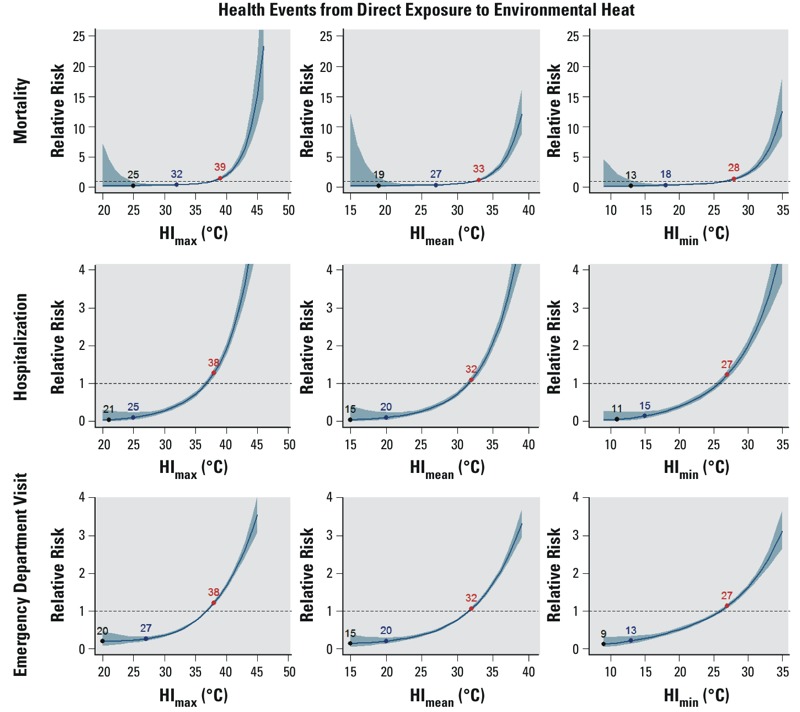
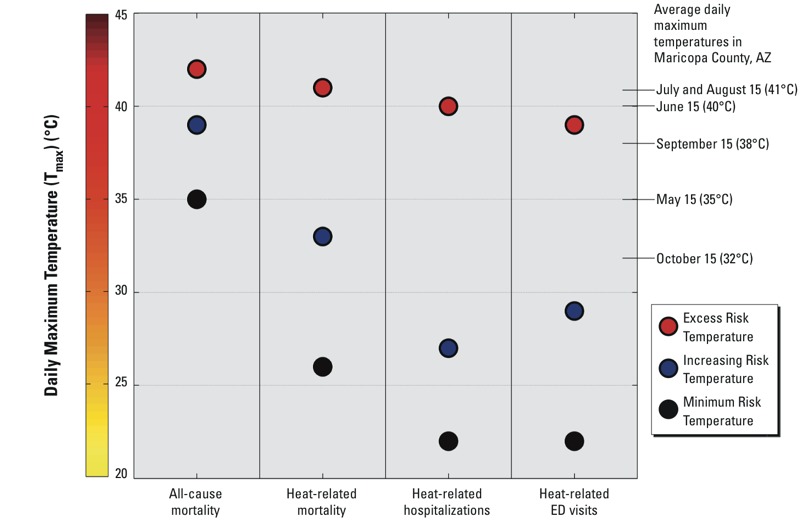
Methods: Using Poisson regression models that controlled for temporal confounders, we assessed daily temperature-health associations for a suite of mortality and morbidity events, diagnoses, and temperature metrics. Minimum risk temperatures, increasing risk temperatures, and excess risk temperatures were statistically identified to represent different "trigger points" at which heat-health intervention measures might be activated.
Results: We found significant and consistent associations of high environmental temperature with all-cause mortality, cardiovascular mortality, heat-related mortality, and mortality resulting from conditions that are consequences of heat and dehydration. Hospitalizations and emergency department visits due to heat-related conditions and conditions associated with consequences of heat and dehydration were also strongly associated with high temperatures, and there were several times more of those events than there were deaths. For each temperature metric, we observed large contrasts in trigger points (up to 22 °C) across multiple health events and diagnoses.
Conclusion: Consideration of multiple health events and diagnoses together with a comprehensive approach to identifying threshold temperatures revealed large differences in trigger points for possible interventions related to heat. Providing an array of heat trigger points applicable for different end-users may improve the public health response to a problem that is projected to worsen in the coming decades.
Conflict of interest statement
The authors declare they have no actual or potential competing financial interests.
Figures
Similar articles
-
Impact of Extreme Heat Events on Emergency Department Visits in North Carolina (2007-2011).J Community Health. 2016 Feb;41(1):146-56. doi: 10.1007/s10900-015-0080-7. J Community Health. 2016. PMID: 26289379
-
Geographic dimensions of heat-related mortality in seven U.S. cities.Environ Res. 2015 Apr;138:439-52. doi: 10.1016/j.envres.2015.02.033. Epub 2015 Mar 17. Environ Res. 2015. PMID: 25791867
-
Role of Acclimatization in Weather-Related Human Mortality During the Transition Seasons of Autumn and Spring in a Thermally Extreme Mid-Latitude Continental Climate.Int J Environ Res Public Health. 2015 Nov 26;12(12):14974-87. doi: 10.3390/ijerph121214962. Int J Environ Res Public Health. 2015. PMID: 26703633 Free PMC article.
-
The potential impacts of climate variability and change on temperature-related morbidity and mortality in the United States.Environ Health Perspect. 2001 May;109 Suppl 2(Suppl 2):185-9. doi: 10.1289/ehp.109-1240665. Environ Health Perspect. 2001. PMID: 11359685 Free PMC article. Review.
-
Climate change and extreme heat events.Am J Prev Med. 2008 Nov;35(5):429-35. doi: 10.1016/j.amepre.2008.08.021. Am J Prev Med. 2008. PMID: 18929969 Review.
Cited by
-
Heat-Related Mortality in the Extreme Summer of 2022—an Analysis Based on Daily Data.Dtsch Arztebl Int. 2024 Feb 9;121(3):79-85. doi: 10.3238/arztebl.m2023.0254. Dtsch Arztebl Int. 2024. PMID: 38169332 Free PMC article.
-
The predictability of heat-related mortality in Prague, Czech Republic, during summer 2015-a comparison of selected thermal indices.Int J Biometeorol. 2019 Apr;63(4):535-548. doi: 10.1007/s00484-019-01684-3. Epub 2019 Feb 9. Int J Biometeorol. 2019. PMID: 30739159
-
Case-crossover analysis of heat-coded deaths and vulnerable subpopulations: Oklahoma, 1990-2011.Int J Biometeorol. 2017 Nov;61(11):1973-1981. doi: 10.1007/s00484-017-1387-0. Epub 2017 Jun 7. Int J Biometeorol. 2017. PMID: 28589228
-
Impact of the warm summer 2015 on emergency hospital admissions in Switzerland.Environ Health. 2019 Aug 15;18(1):66. doi: 10.1186/s12940-019-0507-1. Environ Health. 2019. PMID: 31412877 Free PMC article.
-
The effects of changing meteorological parameters on fatal aortic catastrophes.BMC Cardiovasc Disord. 2020 Jun 13;20(1):291. doi: 10.1186/s12872-020-01575-1. BMC Cardiovasc Disord. 2020. PMID: 32534566 Free PMC article.
References
-
- Agency for Healthcare Research and Quality (AHRQ) Healthcare Cost and Utilization Project (HCUP). Overview of the State Inpatient Databases (SID). Available http://www.hcup-us.ahrq.gov/sidoverview.jsp [accessed 24 December 2015] - PubMed
-
- AHS (American Housing Survey) American Housing Survey Data Homepage. 2014 Available: http://factfinder2.census.gov/faces/nav/jsf/pages/searchresults.xhtml?re... [accessed 21 July 2014]
-
- Alessandrini E, Zauli Sajani S, Scotto F, Miglio R, Marchesi S, Lauriola P. Emergency ambulance dispatches and apparent temperature: a time series analysis in Emilia-Romagna, Italy. Environ Res. 2011;111:1192–1200. - PubMed
Publication types
MeSH terms
LinkOut - more resources
Full Text Sources
Other Literature Sources
Medical
