

Genome-wide analysis of enhancer RNA in gene regulation across 12 mouse tissues
- PMID: 26219400
- PMCID: PMC4518263
- DOI: 10.1038/srep12648
Genome-wide analysis of enhancer RNA in gene regulation across 12 mouse tissues
Abstract
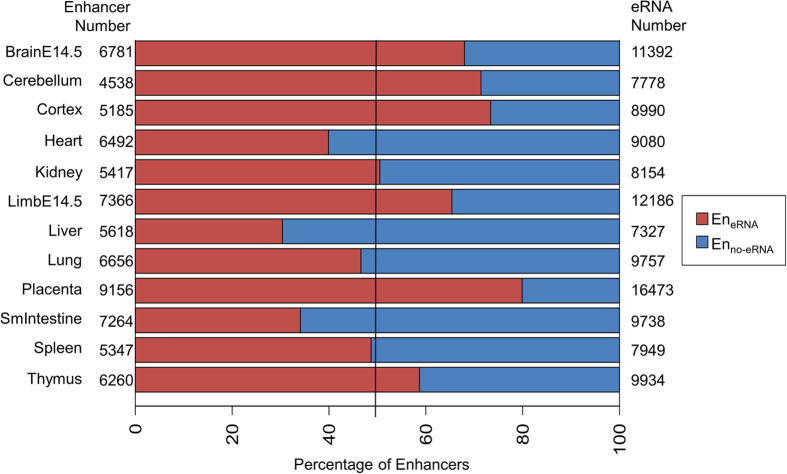
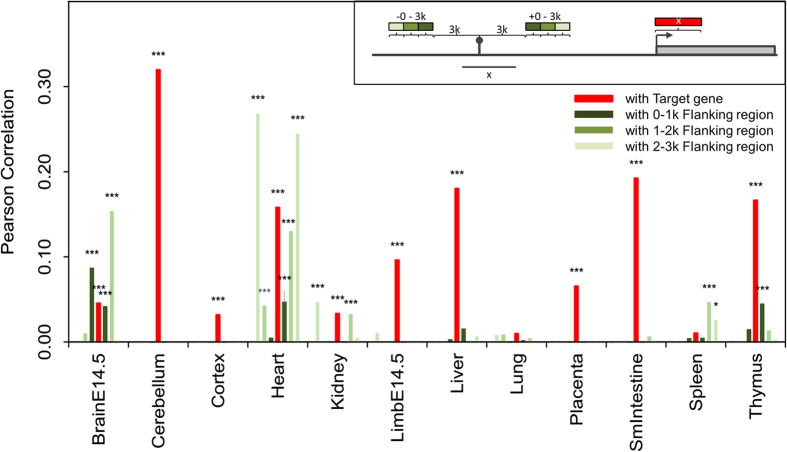
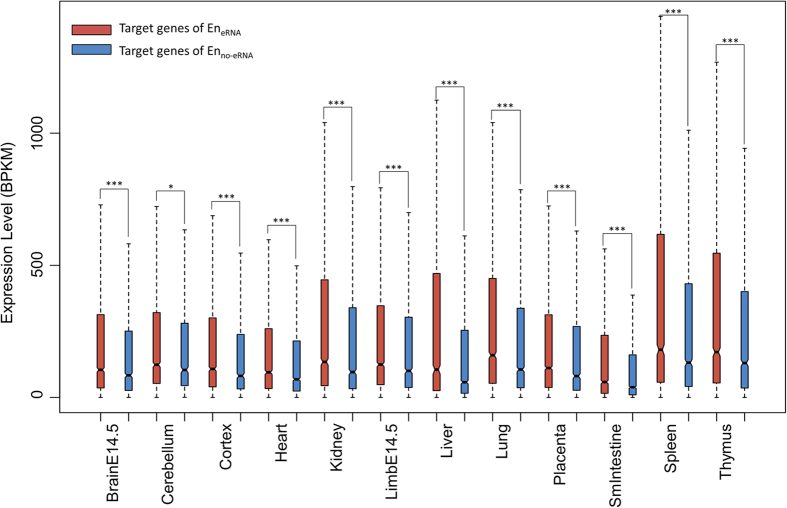
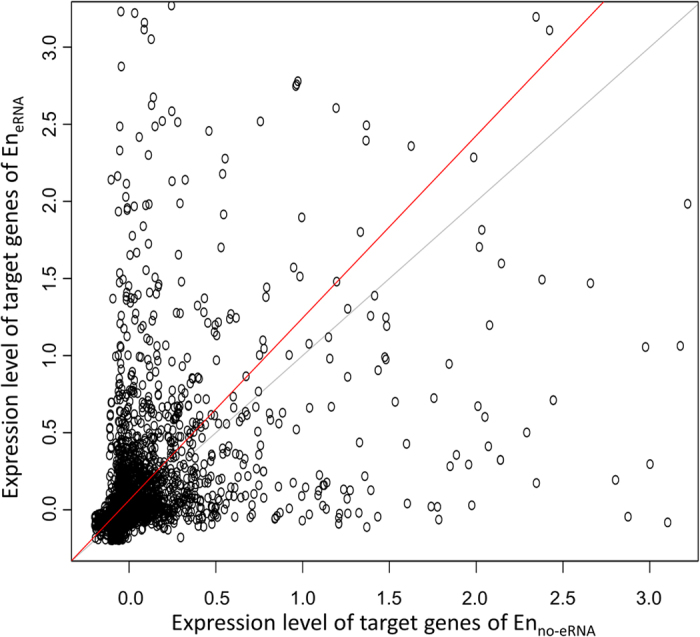
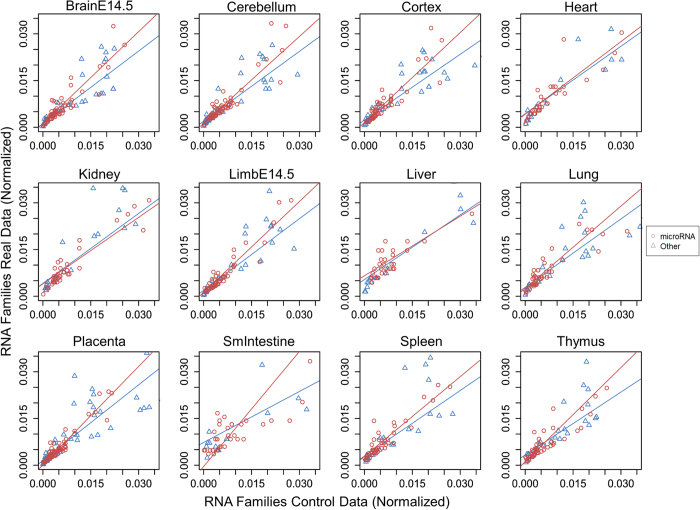
Enhancers play a crucial role in gene regulation but the participation of enhancer transcripts (i.e. enhancer RNA, eRNAs) in regulatory systems remains unclear. We provide a computational analysis on eRNAs using genome-wide data across 12 mouse tissues. The expression of genes targeted by transcribing enhancer is positively correlated with eRNA expression and significantly higher than expression of genes targeted by non-transcribing enhancers. This result implies eRNA transcription indicates a state of enhancer that further increases gene expression. This state of enhancer is tissue-specific, as the same enhancer differentially transcribes eRNAs across tissues. Therefore, the presence of eRNAs describes a tissue-specific state of enhancer that is generally associated with higher expressed target genes, surmising as to whether eRNAs have gene activation potential. We further found a large number of eRNAs contain regions in which sequences and secondary structures are similar to microRNAs. Interestingly, an increasing number of recent studies hypothesize that microRNAs may switch from their general repressive role to an activating role when targeting promoter sequences. Collectively, our results provide speculation that eRNAs may be associated with the selective activation of enhancer target genes.
Figures
Similar articles
-
The current research status of enhancer RNAs.Yi Chuan. 2017 Sep 20;39(9):784-797. doi: 10.16288/j.yczz.17-010. Yi Chuan. 2017. PMID: 28936977 Review.
-
Enhancer-derived RNA: A Primer.Genomics Proteomics Bioinformatics. 2017 Jun;15(3):196-200. doi: 10.1016/j.gpb.2016.12.006. Epub 2017 May 19. Genomics Proteomics Bioinformatics. 2017. PMID: 28533025 Free PMC article. Review.
-
HeRA: an atlas of enhancer RNAs across human tissues.Nucleic Acids Res. 2021 Jan 8;49(D1):D932-D938. doi: 10.1093/nar/gkaa940. Nucleic Acids Res. 2021. PMID: 33119754 Free PMC article.
-
Enhancer RNA: biogenesis, function, and regulation.Essays Biochem. 2020 Dec 7;64(6):883-894. doi: 10.1042/EBC20200014. Essays Biochem. 2020. PMID: 33034351 Review.
-
Enforced Activation of Enhancer RNAs In Situ through the dCas9 Synergistic Activation Mediator System.J Vis Exp. 2020 Jun 5;(160). doi: 10.3791/61460. J Vis Exp. 2020. PMID: 32568241
Cited by
-
The role of epigenetic mechanisms in the regulation of gene expression in the cyclical endometrium.Clin Epigenetics. 2021 May 25;13(1):116. doi: 10.1186/s13148-021-01103-8. Clin Epigenetics. 2021. PMID: 34034824 Free PMC article. Review.
-
Enhancer RNA Transcription Is Essential for a Novel CSF1 Enhancer in Triple-Negative Breast Cancer.Cancers (Basel). 2022 Apr 6;14(7):1852. doi: 10.3390/cancers14071852. Cancers (Basel). 2022. PMID: 35406623 Free PMC article.
-
Transcriptional regulation of macrophage cholesterol efflux and atherogenesis by a long noncoding RNA.Nat Med. 2018 Mar;24(3):304-312. doi: 10.1038/nm.4479. Epub 2018 Feb 12. Nat Med. 2018. PMID: 29431742 Free PMC article.
-
VULCAN integrates ChIP-seq with patient-derived co-expression networks to identify GRHL2 as a key co-regulator of ERa at enhancers in breast cancer.Genome Biol. 2019 May 13;20(1):91. doi: 10.1186/s13059-019-1698-z. Genome Biol. 2019. PMID: 31084623 Free PMC article.
-
Transcriptional control by enhancers and enhancer RNAs.Transcription. 2019 Aug-Oct;10(4-5):171-186. doi: 10.1080/21541264.2019.1695492. Epub 2019 Dec 2. Transcription. 2019. PMID: 31791217 Free PMC article.
References
Publication types
MeSH terms
Substances
LinkOut - more resources
Full Text Sources
Other Literature Sources
