. 2015 Jul 29:5:12580.
doi: 10.1038/srep12580.

Induction of p53-independent apoptosis by ectopic expression of HOXA5 in human liposarcomas

Affiliations

Induction of p53-independent apoptosis by ectopic expression of HOXA5 in human liposarcomas

Dhong Hyun Lee et al. Sci Rep. .

Abstract

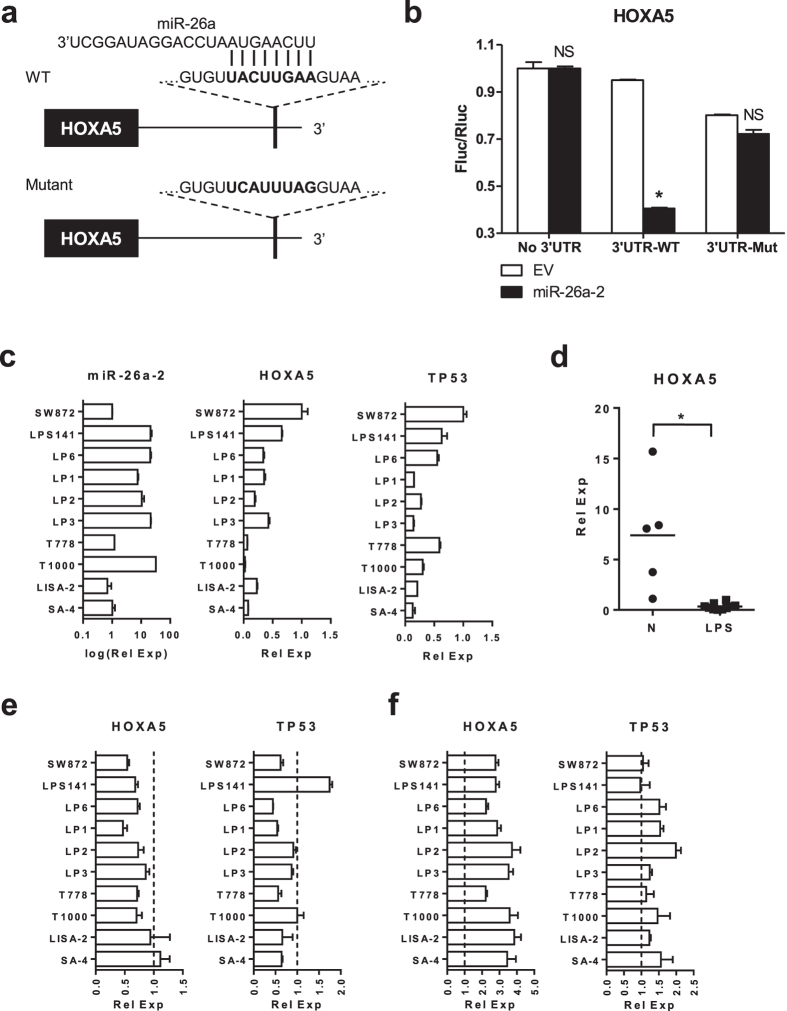
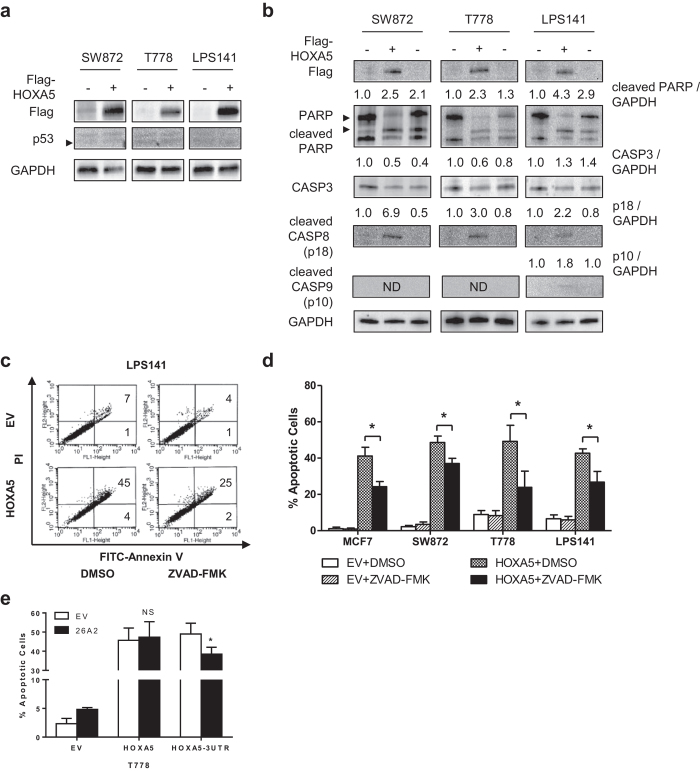
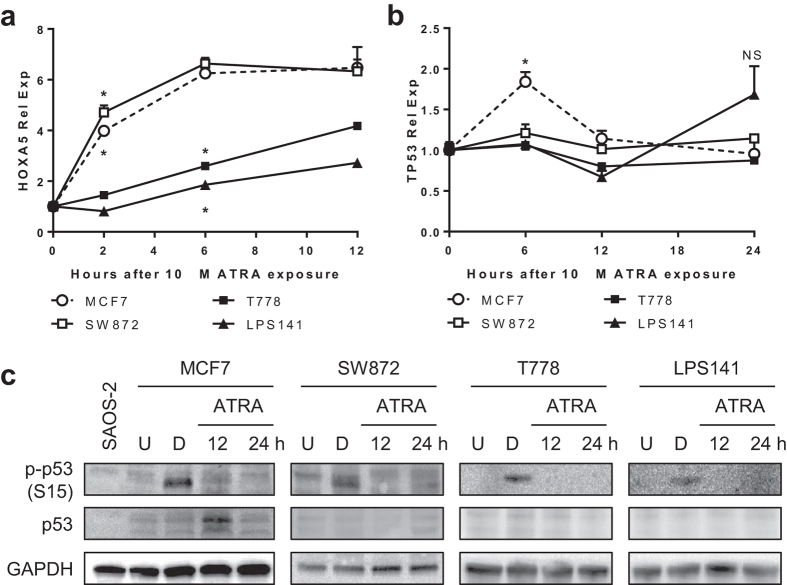
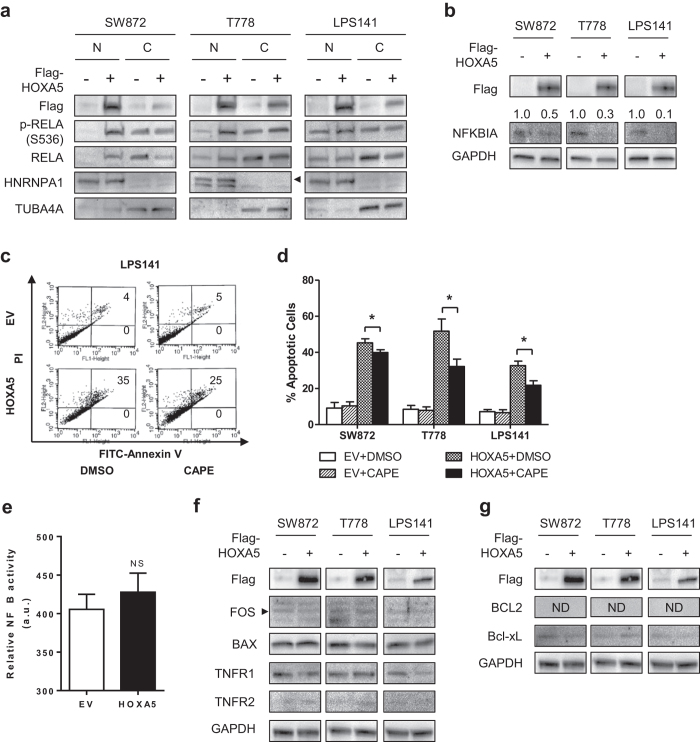
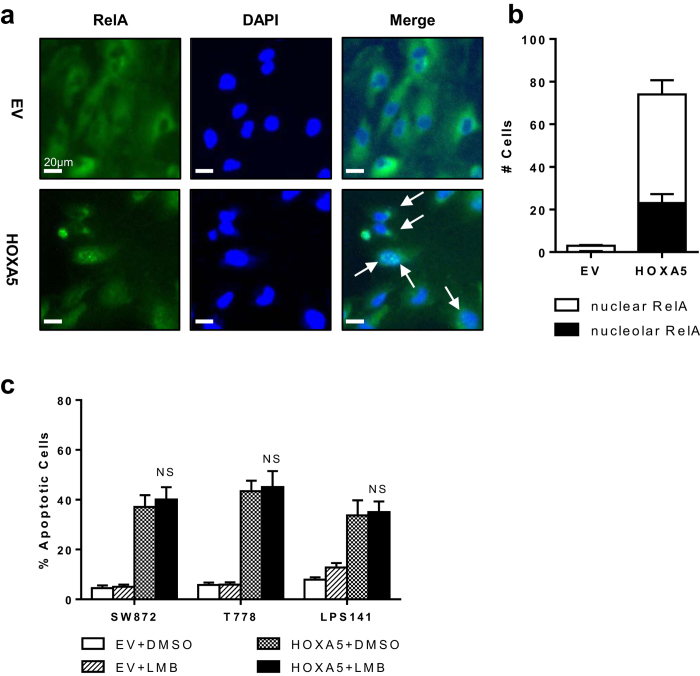
Dedifferentiated liposarcoma (DDLPS) is a highly malignant subtype of human liposarcoma (LPS), whose genomic profile is characterized by chromosomal amplification at 12q13-q22. miR-26a-2 is one of the most frequently amplified genes in the region, and inhibition of its downstream target genes likely contributes to LPS tumorigenesis. Our previous study of LPS predicted homeobox protein A5 (HOXA5) as a target of miR-26a-2, and here we explored further the function of HOXA5, and its relationship with miR-26a-2 in DDLPS cells. Compared to normal human adipocytes, all LPS cell lines showed significant downregulation of HOXA5 (p = 0.046), and inhibition of miR-26a-2 using anti-miR-26a-2 substantially upregulated HOXA5 expression in these LPS cells. Interestingly, overexpression of HOXA5 alone induced very strong apoptotic response of LPS cells. HOXA5-induced apoptosis was p53-independent and caspase-dependent. Surprisingly, overexpression of HOXA5 induced nuclear translocation of RELA (p65), which was not associated with the transcriptional activity of RELA. Rather, nucleolar sequestration of RELA was observed. Overall, our study demonstrated for the first time that the downregulation of HOXA5 in LPS cells, partly by overexpression of miR-26a-2 in DDLPS, confers LPS cells resistance to apoptotic death. Further studies are required to understand the relationship of HOXA5 and the NFκB pathway in LPS cells.


Figures

Figure 1
Figure 1. HOXA5 as a target of miR-26a-2 in LPS cells.
(a) Schematic diagram of HOXA5 3′UTR showing seed sequence (UACUUGAA) of miR-26a-2 binding site. In mutant construct, the seed sequence was mutated to UCAUUUAG by site-directed mutagenesis. WT = wild type. (b) Summary of dual luciferase assays. pGL3-Promoter 3′UTR luciferase reporter vector was cotransfected with either miR-26a-2 expression vector or empty vector control (EV) in 293T cells. After 48 h, cells were harvested and luciferase activity was quantified. Assays were repeated three times to ensure accuracy. Fluc/Rluc = Firefly luciferase/Renilla luciferase. Data represent average Fluc/Rluc ratio ± standard deviation (SD, error bars). Asterisk (*) indicate p-value less than 0.05 by t-test. NS = not significant. (c) Endogenous mRNA expression level of miR-26a-2, HOXA5, and TP53 in LPS cell lines. Data represent average relative mRNA expression (Rel. Exp.) ± SD. (d) Endogenous mRNA expression level of HOXA5 in normal adipose tissue (N) and LPS cell lines (LPS) shown in panel c. Each dot represents HOXA5 expression level of each sample. Horizontal bars represent average HOXA5 expression level within the group. (e) Effect of forced expression of miR-26a-2 on the mRNA expression level of HOXA5 and TP53 in LPS cell lines. Cells were transfected with either miR-26a-2 expression vector or EV. After 48 h, cells were harvested and subjected to qRT-PCR. Dashed lines indicate the expression level of each gene in cells with EV. (f) Effect of inhibition of miR-26a-2 using anti-miR-26a-2 oligos on the mRNA expression level of HOXA5 and p53 in LPS cells. Cells were transfected with either scrambled oligos (SCR) or anti-miR-26a-2. After 48 h, cells were harvested and subjected to qRT-PCR. Dashed lines indicate the expression level of each gene in cells with SCR.
Figure 2
Figure 2. Forced expression of HOXA5 induces apoptosis of LPS cells.
For panels a and b, LPS cells were transfected with either HOXA5 expression vector or empty vector control (EV). Cells were harvested 24 h after transfection and subjected to Western blot analyses. GAPDH was used as a loading control. (a) Representative Western blot images of p53. (b) Representative Western blot images of PARP and selected caspases. Third lane of each cell line is 5 µM doxorubicin-treated positive control. Numbers indicate relative band intensity of each gene normalized to the intensity of the genes in EV (1.0) for each fraction. For panels c and d, LPS cells were transfected with either HOXA5 expression vector or EV, and subsequently treated with 10 μM ZVAD-FMK 12 h after transfection. Cells were further incubated for an additional 12 h, and subjected to apoptosis assay. MCF7 cell line was used as a positive control. (c) Representative apoptosis assay results of LPS141 cells. Numbers indicate the percentage of early-apoptotic (bottom) and late-apoptotic (top) cells. (d) Summary of apoptosis assay results. Data represent % apoptotic cells ± standard deviation (SD, error bars). Asterisk (*) indicates p-value less than 0.05 by t-test. (e) Effect of miR-26a-2 on HOXA5-induced apoptosis. Cotransfection of miR-26a-2 with either HOXA5 (no 3′UTR) or HOXA5-3′UTR (having miR-26a-2 binding site) expression vector was done in T778 cells. Graph shows the summary of apoptosis assay results. NS = not significant.
Figure 3
Figure 3. Effect of all-trans retinoic acid (ATRA) on the expression of HOXA5 and TP53 in LPS cells.
LPS cells were treated with 10 μM ATRA for 2–12 h. At each time point, cells were harvested and subjected to qRT-PCR and Western blot analyses. MCF7 cell line was used as a positive control. (a,b) Changes in mRNA expression levels of HOXA5 (panel A) and TP53 (panel B) upon ATRA treatment. Data represent relative mRNA expression ± standard deviation (SD, error bars). GAPDH was used as a loading control. Asterisk (*) indicates p-value less than 0.05 by t-test. NS = not significant. (c) Representative Western blot images showing the changes of p53 protein levels in ATRA-treated LPS cells. SAOS-2 cell line is p53-negative and was used as a p53-negative control. For positive control of p53 activity upon cellular stress, cells were treated with 500 nM doxorubicin (D) for 6 h. U = Untreated control (DMSO-treated).
Figure 4
Figure 4. Effect of HOXA5 on the NFκB signaling pathway.
For panels a and b, LPS cells were transfected with either HOXA5 expression vector or empty vector control (EV). Cells were harvested 12 h after transfection, and subjected to Western blotting. (a) Representative Western blot images showing subcellular distribution of RELA protein 12 h after transfection. HNRNPA1 and TUBA4A were used as loading controls for nuclear (N) and cytoplasmic (C) fraction of cells, respectively. (b) NFKBIA level from cells under the same condition. For panels c and d, LPS cells were transfected with either HOXA5 expression vector or EV, treated with 25 μg/ml CAPE 9 h after transfection, cultured for additional 15 h, and subjected to apoptosis assay. (c) Representative apoptosis assay of LPS141 cells. Numbers indicate the percentage of early-apoptotic (bottom) and late-apoptotic (top) cells. (d) Summary of apoptosis assay results. Data represent % apoptotic cells ± standard deviation (SD, error bars). Asterisk (*) indicates p-value less than 0.05 by t-test. (e) Summary of dual luciferase assay results. T778 cells were transfected with either 3×κB ConA luciferase reporter vector or ConA vector control without κB element. 24 h after transfection, cells were subsequently transfected with either HOXA5 expression vector (HOXA5) or empty vector control (EV). 12 h after transfection, cells were harvested and luciferase activity was quantified. Data represent average Fluc/Rluc ratio ± SD. a. u. = arbitrary unit, NS = not significant. For panels f and g, LPS cells were transfected with either HOXA5 expression vector or empty vector control (EV). Cells were harvested 24 h after transfection, and subjected to Western blotting. (f) Representative Western blot images showing protein levels of selected pro-apoptotic NFκB target proteins. (g) Representative Western blot images showing protein levels of selected anti-apoptotic NFκB target proteins.
Figure 5
Figure 5. Effect of forced expression of HOXA5 on subcellular distributions of RELA in LPS cells.
For panels a and b, T778 cells were transfected with either HOXA5 expression vector or empty vector control (EV), and subjected to immunocytochemistry with RELA antibody 12 h after transfection. (a) Representative immunofluorescent images are shown. Nuclei were stained with DAPI. Arrows indicate the location of RELA puncta. ×40. Size bar = 20 μm. (b) Cell counting summary showing number of cells with nuclear RELA and nucleolar RELA (presence of RELA puncta). Data represent average number of cells in a given field ± standard deviation (SD, error bars). (c) Summary of apoptosis assay results. LPS cells were transfected with either HOXA5 expression vector or EV. Cells were treated with 100 nM leptomycin B (LMB) 9 h after transfection, and incubated further for an additional 15 h. Data represent % apoptotic cells ± SD. NS = not significant.

Similar articles

Cited by

References

    1. Lee D. H. et al. Overexpression of miR-26a-2 in human liposarcoma is correlated with poor patient survival. Oncogenesis 2, e47 (2013). - PMC - PubMed
    1. Singer S. et al. Gene expression profiling of liposarcoma identifies distinct biological types/subtypes and potential therapeutic targets in well-differentiated and dedifferentiated liposarcoma. Cancer Res 67, 6626–6636 (2007). - PubMed
    1. Ray-Coquard I. et al. Effect of the MDM2 antagonist RG7112 on the P53 pathway in patients with MDM2-amplified, well-differentiated or dedifferentiated liposarcoma: an exploratory proof-of-mechanism study. Lancet Oncol 13, 1133–1140 (2012). - PubMed
    1. Gesta S. et al. Evidence for a role of developmental genes in the origin of obesity and body fat distribution. Proc Natl Acad Sci USA 103, 6676–6681 (2006). - PMC - PubMed
    1. Gesta S., Tseng Y. H. & Kahn C. R. Developmental origin of fat: tracking obesity to its source. Cell 131, 242–256 (2007). - PubMed

Publication types

MeSH terms