. 2015 Oct;36(10):4184-201.
doi: 10.1002/hbm.22910. Epub 2015 Jul 28.

Common neural correlates of emotion perception in humans

Affiliations

Common neural correlates of emotion perception in humans

Jan Jastorff et al. Hum Brain Mapp. 2015 Oct.

Abstract

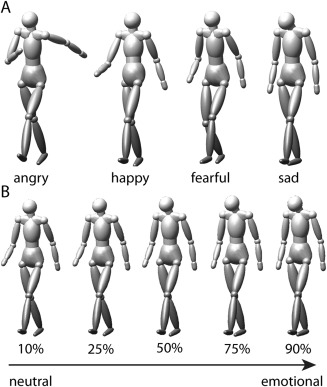
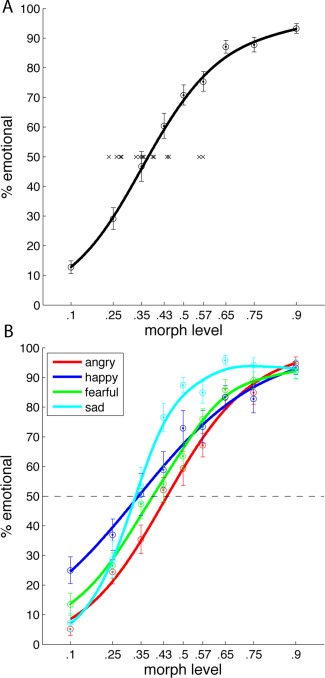
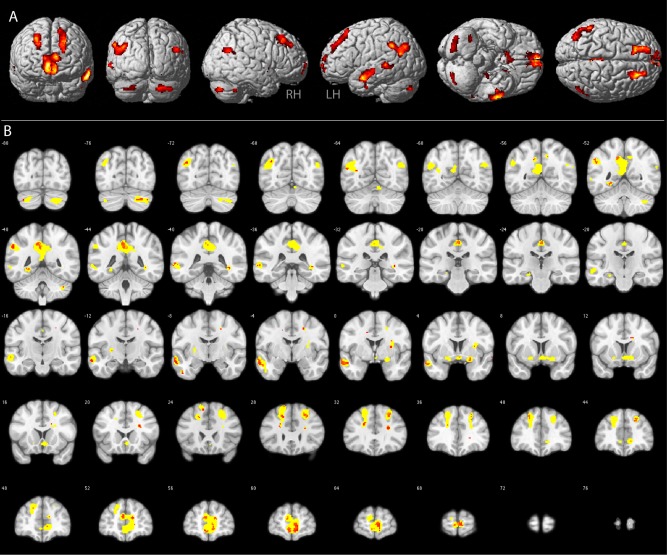
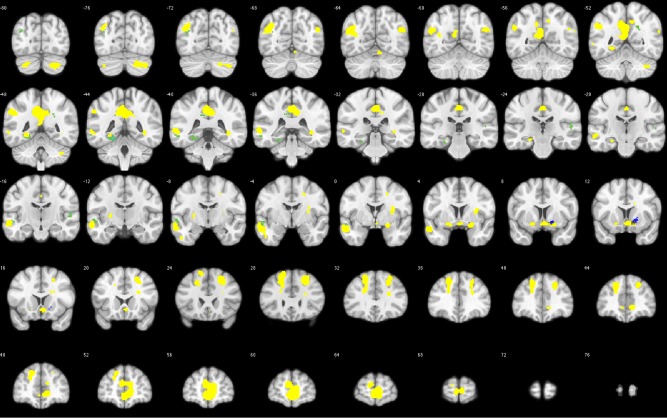
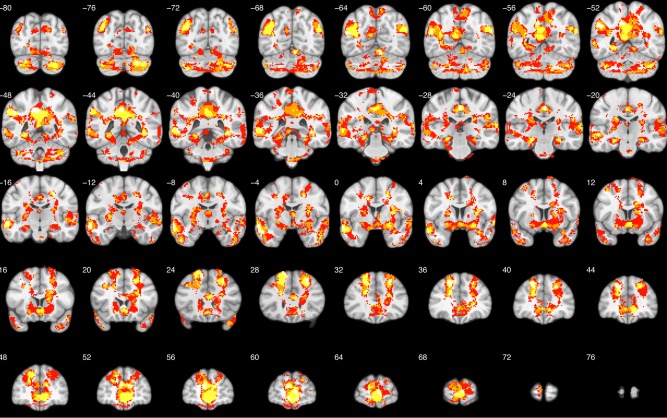
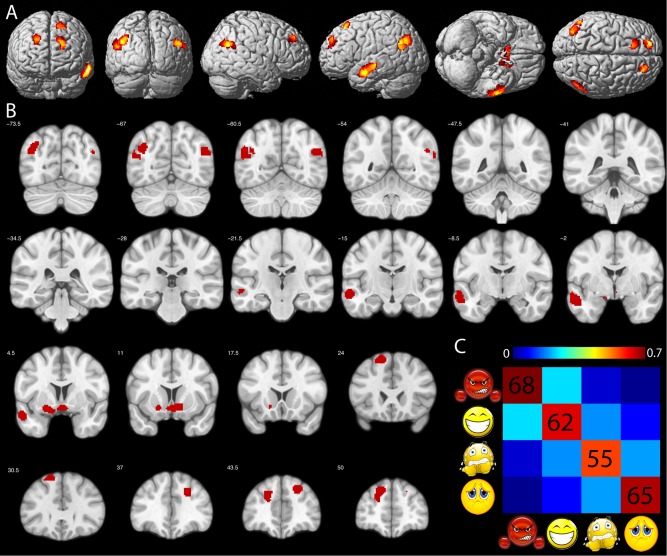
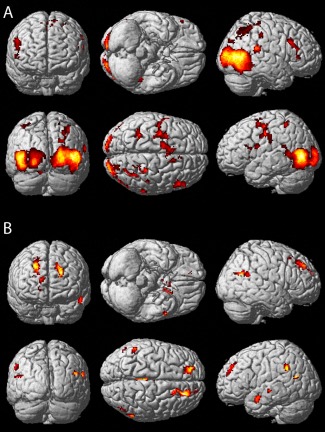
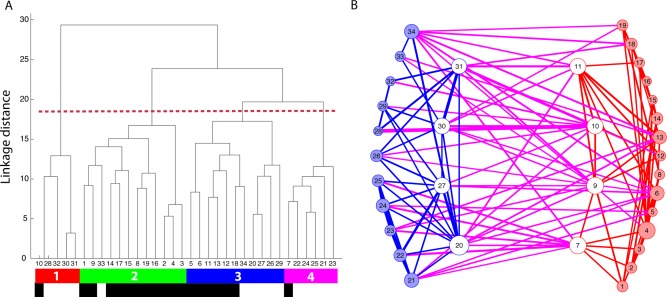
Whether neuroimaging findings support discriminable neural correlates of emotion categories is a longstanding controversy. Two recent meta-analyses arrived at opposite conclusions, with one supporting (Vytal and Hamann []: J Cogn Neurosci 22:2864-2885) and the other opposing this proposition (Lindquist et al. []: Behav Brain Sci 35:121-143). To obtain direct evidence regarding this issue, we compared activations for four emotions within a single fMRI design. Angry, happy, fearful, sad and neutral stimuli were presented as dynamic body expressions. In addition, observers categorized motion morphs between neutral and emotional stimuli in a behavioral experiment to determine their relative sensitivities. Brain-behavior correlations revealed a large brain network that was identical for all four tested emotions. This network consisted predominantly of regions located within the default mode network and the salience network. Despite showing brain-behavior correlations for all emotions, muli-voxel pattern analyses indicated that several nodes of this emotion general network contained information capable of discriminating between individual emotions. However, significant discrimination was not limited to the emotional network, but was also observed in several regions within the action observation network. Taken together, our results favor the position that one common emotional brain network supports the visual processing and discrimination of emotional stimuli.

Keywords: action observation; bodies; emotion; fMRI; human; perception; visual.


Figures

Figure 1
Figure 1
Stimuli. A: Example frames taken from four prototypical stimuli displaying the emotions angry, happy, fearful, and sad used in the functional imaging experiment. B: Illustration of the morphed stimuli indicating different morph levels between neutral and emotional (sad) gaits tested during the behavioral experiment.
Figure 2
Figure 2
Behavioral results. A: Average “emotional” responses across subjects and across emotions at the different morph levels (± sem) fitted by a sigmoid curve. Crosses indicate the individual ambiguity points of the 16 subjects. B: Average “emotional” responses across subjects separate for each emotion at the different morph levels (±sem). [Color figure can be viewed in the online issue, which is available at http://wileyonlinelibrary.com.]
Figure 3
Figure 3
GEN. Group results of the brain–behavior correlation analysis between the fMRI contrast all emotions versus neutral stimuli and the average perceptual ambiguity point determined in the behavioral experiment. Results are displayed on the rendered MNI brain template (A) and respective coronal sections (B). Yellow voxels in B: P < 0.01, red voxels in B: P < 0.001. See Table 1 for anatomical locations and respective t‐scores of the red voxels. [Color figure can be viewed in the online issue, which is available at http://wileyonlinelibrary.com.]
Figure 4
Figure 4
Emotion‐specific voxels. Yellow voxels indicate the GEN (same as Fig. 3). Green voxels show stronger brain–behavior correlations for sad, and blue voxels show stronger brain–behavior correlations for happy compared to the other emotions. [Color figure can be viewed in the online issue, which is available at http://wileyonlinelibrary.com.]
Figure 5
Figure 5
Conjunction map. Conjunction of all four brain–behavior correlation maps. White indicates spatial overlap for all four maps. Yellow indicates spatial overlap for three of the four maps. Orange indicates spatial overlap for two of the maps and red indicates no spatial overlap. [Color figure can be viewed in the online issue, which is available at http://wileyonlinelibrary.com.]
Figure 6
Figure 6
SVM classification. Colored voxels in (A) and (B) indicate ROIs of the GEN showing significant SVM classification performance. C: Average percent correct classification across the 10 ROIs highlighted in (A) and (B). Chance level = 25%. Order of conditions from left to right and top to bottom: angry, happy, fearful, and sad. [Color figure can be viewed in the online issue, which is available at http://wileyonlinelibrary.com.]
Figure 7
Figure 7
Searchlight analysis. A: Regions of the AON with significant classification performance in the SVM searchlight analysis rendered on the MNI brain template. B: Regions of the GEN with significant classification performance. Searchlight results confirm the results of the ROI‐based classification indicated by the similarity of Figures 6A and 7B. [Color figure can be viewed in the online issue, which is available at http://wileyonlinelibrary.com.]
Figure 8
Figure 8
Resting‐state fMRI analysis. A: Results of the clustering analysis based on the pairwise correlation between seed regions from the GEN and the AON. Numbers 1–34 refer to the numbers in Table 2 and indicate the location of the seed region. We obtained four main clusters, color‐coded in red, green, blue, and pink respectively. Black labels indicate seeds from the GEN and white labels indicated seeds from the AON. B: Illustration of significant functional connections within the AON (blue) and within the GEN (red). Significant functional connections between these two networks are shown in purple. White circles signal between group hubs. Numbers within each circle refer to the location of the seed region defined in Table 2. [Color figure can be viewed in the online issue, which is available at http://wileyonlinelibrary.com.]

Similar articles

Cited by

References

    1. Atkinson AP, Dittrich WH, Gemmell AJ, Young AW (2004): Emotion perception from dynamic and static body expressions in point‐light and full‐light displays. Perception 33:717–746. - PubMed
    1. Barrett LF (2006): Solving the emotion paradox: Categorization and the experience of emotion. Pers Soc Psychol Rev 10:20–46. - PubMed
    1. Barrett LF, Mesquita B, Ochsner KN, Gross JJ (2007): The experience of emotion. Annu Rev Psychol 58:373–403. - PMC - PubMed
    1. Blair RJ, Morris JS, Frith CD, Perrett DI, Dolan RJ (1999): Dissociable neural responses to facial expressions of sadness and anger. Brain 122 (Part 5):883–893. - PubMed
    1. Blakemore SJ, Decety J (2001): From the perception of action to the understanding of intention. Nat Rev Neurosci 2:561–567. - PubMed

Publication types